
 ?Mathematical formulae have been encoded as MathML and are displayed in this HTML version using MathJax in order to improve their display. Uncheck the box to turn MathJax off. This feature requires Javascript. Click on a formula to zoom.
ABSTRACT
Clinical relevance
Contrast thresholds under photopic and mesopic luminance conditions are compromised in subjects with vitreous degeneration. A plausible explanation is needed for the visual discomfort expressed by patients suffering from symptomatic vitreous degeneration.
Background
The current study investigates the effect of symptomatic vitreous degeneration on photopic and mesopic contrast at high spatial frequencies.
Methods
An age-matched sample of 115 subjects, comprising 30 subjects with symptomatic vitreous floaters (cases) and 85 healthy subjects (controls), was included in this study. Visual acuity and flicker thresholds were measured for all participants. Photopic and mesopic functional contrast thresholds at 10 cycles per degree were measured for all participants to assess the effect of floaters on contrast. Further, to determine the effect of posterior vitreous detachment on contrast, the sample was divided into three groups: cases with posterior vitreous detachment (n = 12); cases without posterior vitreous detachment (n = 18); and controls (n = 85), and their contrast thresholds were compared.
Results
Photopic and mesopic contrast thresholds were lower by 37.4% and 27.5%, respectively, when the cases were compared with the controls (p = 0.028 and p < 0.001 for photopic and mesopic contrast thresholds, respectively). Photopic contrast was lower by 64.0% in cases with posterior vitreous detachment compared with controls (p = 0.001). Compared with controls, mesopic contrast was lower in cases with posterior vitreous detachment and in cases without posterior vitreous detachment by 30.3% and 25.6%, respectively (p = 0.014 and p = 0.017 for cases with and without posterior vitreous detachment, respectively).
Conclusion
: Subjects with vitreous degeneration have diminished photopic and mesopic contrast thresholds compared with controls. This finding highlights the negative impact of vitreous degeneration on the quality of vision.
Introduction
The ultrastructure of the human vitreous gel is composed mainly of water, collagen and hyaluronan. Ageing and disease cause this fine structure to destabilise and even disintegrate.Citation1 The disintegration of the vitreous gel results in the formation of aggregated collagen bundles and liquid pools of vitreous, culminating in an entoptic phenomenon termed vitreous floaters.Citation2 Sufferers of symptomatic floaters attend eye clinics with characteristic presentations of the perception of dark grey spots, amorphous clouds, and moving objects within their central visual field.Citation3
Further degeneration of the vitreous gel results in the weakening of the vitreoretinal adhesions and the separation of the posterior vitreous cortex from the inner limiting membrane of the retina, at the vitreoretinal interface, a phenomenon referred to as posterior vitreous detachment (PVD).Citation4 PVD has been described as the principal underlying phenomenon for the sudden onset of primary floaters (that is, vitreous opacities that arise from structures endogenous to the vitreous body).Citation2 That notwithstanding, primary floaters can occur asynchronously from PVD, especially when sufferers are myopic.
High contrast visual acuity (VA) tests provide an effective way of assessing spatial vision in a clinical setting. The task of the subject in a conventional VA test is to correctly name small letters that are close to 100% contrast and have spatial features that approach the resolving power of the eye.Citation5 The difficulty of the task varies across letters and subjects often achieve VA values within ‘normal limits’, even when the contrast of the retinal image is lowered as a result of aberrations and scattered light.
Contrast thresholds for either spatially periodic patterns or single optotypes such as Landolt rings can provide a sensitive measure of spatial vision that can be used to detect changes in retinal image contrast even when individual observers manage to achieve VA values within the normal range.Citation6,Citation7 The size of the optotype employed is usually fixed at three times the mean acuity limit of 5 min arc (6/6) and the reciprocal of the contrast threshold needed to resolve the gap is usually described as functional contrast sensitivity (FCS).Citation8 When a contrast test is conducted in conjunction with a conventional VA test, the combined results provide a more informative assessment of spatial vision.Citation9
Ageing and ocular disease can result in a decline in contrast sensitivity.Citation10 Factors responsible for contrast sensitivity degradation are broadly categorised as optical or neural. Optical aberrations,Citation11 increased lenticular optical density (leading to reduced retinal illuminance),Citation12 and increased intraocular light scatter (resulting from either increased lenticular opacity or increased vitreous opacification)Citation13 constitute optical factors whereas parafoveal loss of rodsCitation14 and ganglion cell complex thinning, secondary to retinal ganglion cell loss,Citation15 comprise the neural factors for contrast sensitivity decline. The influence of neural factors for contrast sensitivity decline is more pronounced within the low to mid-spatial frequencies, whereas optical factors are more striking at high spatial frequencies.Citation16
Both vitreous opacities and PVD have been shown to compromise visual function, specifically contrast sensitivity under mesopic luminance,Citation17–21 and degrade the quality of life of patients suffering from floaters.Citation22 It follows from the foregoing that when vitreous opacities occur in tandem with PVD, there should be a further decline in contrast sensitivity. Also, the impact of vitreous opacities and PVD on contrast sensitivity under photopic luminance have not yet been studied and reported. This is particularly necessary given the fact that the visual disturbances associated with vitreous degeneration mostly occur against uniformCitation23 and brightCitation3 backgrounds.
In view of the above, it seems plausible that a contrast sensitivity test designed to assess predominantly high spatial frequencies (and under photopic luminance) may be more suitable for assessing the impact of vitreous degeneration on contrast threshold. In this study, the authors have sought to ascertain the impact of vitreous opacities and PVD, if any, on photopic and mesopic contrast thresholds while controlling for other potential confounding factors to contrast threshold decline – mainly age, lenticular opacity and retinal dysfunction. In order to control for contrast threshold loss due to lenticular opacity, participants included in this study had clear lenses or were pseudophakes fitted with monofocal intraocular lenses and had no posterior capsular opacification.Citation24,Citation25
Retinal function was assessed by employing a 15-Hz flickering stimulus test, which remains largely uninfluenced by small changes in the optics of the ageing eye. Age-related loss of flicker threshold is attributed to changes in, or loss of, retinal ganglion cells, which in turn cause a degradation of spatial contrast.Citation26 Thus, a significant difference in flicker threshold between the groups in the present study would imply an age interaction with retinal function and indicate the presence of a neural confounding factor to contrast sensitivity decline.
Methods
Study design and sample
An age-matched sample of 115 subjects, comprising 30 subjects with primary floaters (cases) and 85 subjects devoid of vitreoretinal disease (controls), was included, in a 1:3 case–control fashion, into this cross-sectional study. All eligible volunteers who were aged 35 years and above were included in this study, as floaters are usually developed at the fourth decade of life, with myopic vitreopathy occurring 5–10 years before the fourth decade.Citation2
Cases were recruited from a vitreoretinal sub-speciality clinic (Institute of Eye Surgery, Waterford) and as such the diagnosis, while current, was not prospective. For these cases, the eye in subjects with unilateral floaters was selected as the study eye. In cases with bilateral floaters, the eye described by the subject as more bothersome was selected as the study eye. For the controls, the dominant eye (as determined by the convergence near-point method)Citation27 or the eye with the better distance visual acuity was selected as the study eye.
Exclusion criteria included prior treatment for floaters (laser vitreolysis or pars plana vitrectomy), secondary floaters (as described by Milston et al.)Citation2; lens opacification including posterior subcapsular cataracts, nuclear and cortical opacification; pseudophakes fitted with multifocal intraocular lenses; neural, developmental and retinal diseases (for example, glaucoma, age-related macular degeneration, diabetic retinopathy, branch retinal vein occlusion, vitreomacular traction, macular oedema, and amblyopia); and visual acuity worse than 6/12 (0.3 logMAR).
The study was conducted following ethical approval from the Research Ethics Committee, Waterford Institute of Technology, Waterford, Ireland, and from the Research Ethics Committee, Health Service Executive, South Eastern Area, Ireland. The study adhered to the tenets of the declaration of Helsinki. Informed consent forms were completed by all participants prior to enrolment into the study.
Study assessments
Visual acuity and contrast threshold
Visual acuity and functional contrast threshold were assessed monocularly for the study eye of participants using the Acuity-Plus test from the Advanced Vision and Optometric Test (AVOT; https://www.city.ac.uk/avot).Citation10,Citation28 Stimuli were presented on a high-resolution EIZO Color LCD Monitor (ColorEdge CS240, 21.5 inches; EIZO Corporation, Japan) with 1900 × 1200 pixels and 10 bits per primary colour. The visual display was calibrated spectrally for each primary colour for both spectral radiance and luminance using bespoke software (LUMCAL; City Occupational Ltd., London, UK). The monitor incorporates digital uniformity equaliser (DUE) technology (EIZO) to avoid fluctuations in brightness and chromaticity in different parts of the screen. The display was located 3 m from the observer.
The Acuity-Plus test involved a range of positive and negative polarity Landolt ring optotypes with varying gap sizes, which were presented randomly during the test. A staircase procedure with 12 reversals was used to vary the gap size of the stimulus using a two-down, one-up procedure. All participants were tested first using the photopic protocol (background luminance of 34 cd/m2). This was then followed by similar measurements using the high mesopic protocol (background luminance of 1 cd/m2) which involved short dark adaptation. Spectrally calibrated ‘neutral density’ filters were employed for the mesopic testing. Participants wore their distance spectacle prescription, if any, for VA testing.
The Acuity-Plus test employed diagonal guides, which pointed towards the centre of the screen. A small outline square and cross flashed briefly in the centre of the screen to attract the participant’s point of regard. A short time afterwards, a Landolt ring was presented to the eye for 160 ms, and the task of the participant was to register the location of the gap or to guess its location, if unable to do so. This stimulus arrangement facilitated fixation at the centre of the screen and accommodation in the plane of the screen. In addition, the stimulus employed also eliminated eye movements and multiple fixations during the task.Citation8 The VA results generated by the program were displayed as the minimum angle of resolution (MAR). These were converted to logMAR values for reporting. In this study, photopic and mesopic VA as assessed with Landolt ring stimuli of 100% negative luminance contrast are presented.
Functional contrast threshold was assessed as described previously.Citation10 To summarise, functional contrast threshold was measured by randomly displaying either a positive or negative polarity Landolt ring optotype with a fixed gap size of 3 min arc. The latter contains a range of spatial frequencies centred around 10 cycles per degree. The reasons for selecting this contrast test protocol are because the use of a Landolt ring optotype with a 3 min arc gap size is rich in high spatial frequencies, which are most affected by increased scatter, residual refractive errors and higher order aberrations.Citation8,Citation29 Any smaller gap size, say 1 or 2 min arc, may become undetectable in some subjects, even at maximum contrast. In addition, this protocol is easy to carry out, and the test has been shown to be sensitive to changes in the retina as well as reduction in image contrast caused by increased light scatter in the eye.Citation29
A staircase procedure with 10 reversals was used to vary the luminance contrast of the stimulus using a two-down, one-up procedure, reducing the chance response probability to 1/16. Participants were tested first under photopic luminance, followed by testing under mesopic luminance. The same, spectrally calibrated ‘neutral density’ filters were also employed for assessing mesopic functional contrast threshold. All tests were conducted, while subjects wore spectacles that ensured optimum refraction. Functional contrast threshold results represent the percentage contrast thresholds needed to achieve ~73% correct response. Photopic and mesopic functional contrast threshold with negative polarity stimuli results have been reported in the present study. The relative percentage differences in contrast threshold between the study groups were calculated as:
where CTcases = mean contrast threshold of cases [that is, either the entire cases (n = 30), cases with PVD (n = 12) or cases without PVD (n = 18)]; CTcontrols = mean contrast threshold of controls
Flicker threshold
Rapid flicker thresholds under high mesopic conditions were measured using the Flicker-Plus test from the AVOT suite. The test measures flicker thresholds at five discrete locations in the visual field using an efficient experimental technique based on a five-alternative forced-choice procedure with five randomly interleaved staircases.Citation30 Temporal contrast modulation thresholds were measured using a 1-up, 2-down procedure and the thresholds were estimated by averaging the last six staircase reversals.Citation31,Citation32 The disc stimuli were modulated sinusoidally at a frequency of 15-Hz and subtended 45 min arc at the fovea and 60 min arc, 5° away from fixation in each of the four quadrants. The stimulus presentation time was 600 ms and the time-averaged luminance remained equal to that of the uniform background (that is, 0.5 cd/m2). In addition to the low luminance, the spectral composition, size and temporal modulation frequency of the test stimuli were selected appropriately to favour rods.
Prior to the stimulus presentation, a small outline square and cross flashed briefly in the centre of the screen to attract the point of regard of the participant. Participants viewed the display from 1 m through spectrally calibrated ‘neutral density’ filters. Participants had to indicate the location of the stimulus presentation by pressing one of the five buttons arranged to simulate the stimulus positions on the screen. A separate button indicated that the subject was totally unaware of any stimulus. When this button was pressed, the program randomly allocated the response of the subject to one of the five buttons.
The staircase algorithm requires two consecutive correct responses at a given stimulus location during the random sequence presentation before a reversal occurs and the stimulus contrast is reduced for the following presentation. The five randomly interleaved staircases make the test procedure statistically efficient since in the absence of any signal, the chance probability of a correct response is only 1/25. Flicker thresholds under high mesopic adaptation were computed in central vision and at each of the four parafoveal locations. For this study, the thresholds for the parafoveal locations were averaged to produce a single threshold, as a measure of the parafoveal flicker threshold. The results reported in this study are expressed as flicker thresholds (%).
Assessment of posterior vitreous detachment
PVD was diagnosed based on the assessment of optical coherence tomography (OCT) scans, captured with the Spectralis HRA + OCT Multicolour (Heidelberg Engineering GmbH, Heidelberg, Germany) and funduscopic examination findings. In this study, macula and peripapillary disc OCT scans were obtained for all the cases. The high resolution 19-line raster scan protocol and a 20º x 20º scan angle of the macula was employed to obtain IR+OCT horizontal line scans of the macula area of each participant. The scan was only initiated when sufficient vitreous was identified on the B-scan to enable PVD assessment. The horizontal line through the foveal area was used to assess PVD within the parafoveal area.
The optic disc protocol was used to obtain a circumferential papillary scan and was assessed for detachment. A single vitreoretinal surgeon (E.N) assessed and graded all cases into cases with PVD and cases without PVD. PVD was identified based on the observation of a Weiss ring upon indirect ophthalmoscopic examination and/or a complete separation of the posterior vitreous cortex from the inner limiting membrane along the horizontal macula area and from the optic disc on the macula and peripapillary disc scans, respectively.
Outcome measures
Outcome measures for this study were photopic and mesopic functional contrast thresholds.
Statistical analysis
The statistical package IBM SPSS® Statistics version 25 was used for all analyses, and the 5% level of significance was applied. The differences in study outcomes between cases and controls were assessed using independent samples t-test for visual acuity, functional contrast thresholds, and flicker threshold variables, and chi-squared test for sex. All quantitative variables were expressed as mean ± standard deviation (Mean ± SD). In the sub-analysis to assess the effect of PVD on functional contrast thresholds, subjects were split into cases with PVD (n = 12), cases without PVD (n = 18) and controls (n = 85). One-way analysis of co-variance (ANCOVA) was used to compare the mean functional contrast thresholds between the three groups. The Bonferroni’s correction procedure was used for subsequent pairwise post-hoc comparisons.
Results
Effect of vitreous floaters on contrast thresholds
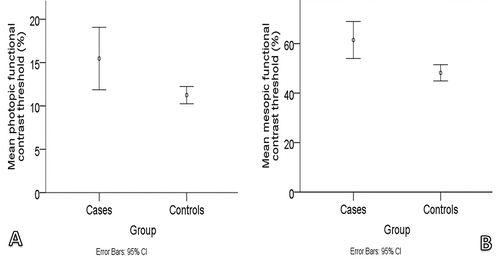
presents the demographic and visual function measurements of cases and controls. VA (photopic and mesopic) and flicker thresholds (foveal and parafoveal) were not significantly different between the two groups (p > 0.05 for all; ). Compared with controls, cases recorded significantly worse contrast thresholds at photopic and mesopic luminance (p = 0.028 and p < 0.001 for photopic and mesopic contrast thresholds, respectively; ). Photopic and mesopic contrast thresholds were lower by 37.4% and 27.5%, respectively, when the cases were compared with the controls.
Table 1. Demographic and visual function variables for study participants.
Figure 1. Error plots showing the mean photopic A: and mean mesopic B: visual acuity of the cases and controls (cases = subjects with symptomatic floaters; controls = subjects with healthy eyes).
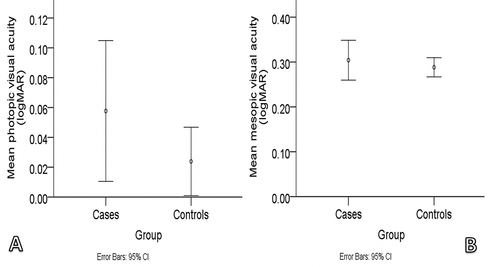
Figure 2. Error plots showing the mean foveal A: and average parafoveal B: flicker thresholds of the cases and controls (cases = subjects with symptomatic floaters; controls = subjects with healthy eyes).
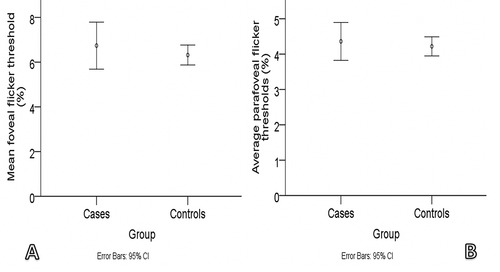
Figure 3. Error plots showing the photopic A: and mesopic B: functional contrast thresholds of the cases and controls (Cases = subjects with symptomatic floaters; controls = subjects with healthy eyes).
Effect of PVD on contrast thresholds
To assess the effect of PVD on functional contrast threshold, participants were split into cases with PVD (n = 12), cases without PVD (n = 18), and controls (n = 85). Cases with PVD were then compared with cases without PVD and controls to determine the influence of PVD on contrast threshold (). Foveal and parafoveal flicker thresholds were not significantly different between the three groups [F (2,112) = 0.433; p = 0.650 and F (2,112) = 2.024; p = 0.137 for foveal and parafoveal flicker thresholds, respectively]. In addition, photopic and mesopic VA were not statistically significantly different between the three groups [F (2,112) = 1.088; p = 0.340 and F (2, 112) = 0.338; p = 0.714 for photopic and mesopic VA, respectively]. Cases with PVD were significantly older than cases without PVD and controls [F (2, 112) = 3.974; p = 0.022; ). Therefore, subsequent analyses to determine the effect of PVD on contrast threshold were controlled for age by employing a one-way ANCOVA test.
Table 2. Visual function outcomes of the 3 groups.
One-way ANCOVA was conducted to compare mean differences in functional contrast thresholds between the three groups. Photopic functional contrast was shown to be significantly different for the three groups [F (2, 112) = 5.875; p = 0.004]. Post hoc pairwise comparisons indicated a significantly lower photopic contrast threshold in the cases with PVD compared with controls (a relative percentage difference in functional contrast threshold of 64.0%; p = 0.001). However, photopic contrast threshold in cases without PVD did not significantly differ from cases with PVD (p = 0.100) or controls (p = 0.504).
Mesopic functional contrast threshold was significantly different in the three groups [F (2, 112) = 5.605; p = 0.005]. Post hoc analysis indicated significantly lower mesopic contrast thresholds in cases with PVD (a relative percentage difference of 30.3%; p = 0.014) and in cases without PVD (a relative percentage difference of 25.6%; p = 0.017) when compared with controls. However, mesopic functional contrast threshold in cases without PVD did not significantly differ from the cases with PVD (p > 0.999).
Discussion
The findings of this study indicate that contrast sensitivity is compromised in subjects with vitreous degeneration under both photopic and mesopic luminance. The aim of the study was to investigate whether the degeneration of the vitreous and the corresponding increase in scattered light can be detected as a change in functional contrast threshold by employing a stimulus rich in high spatial frequencies, which is known to be significantly influenced by optical factors (including ocular forward light scatter) while controlling for cofounders including age, lens opacity and neural factors.
Contrary to earlier reports of the vitreous not contributing to intraocular light scatter, recent studies have shown increased intraocular light scattering and hence, increased straylight, with vitreous degeneration.Citation33,Citation34 The crystalline lens has been proposed to be the most likely cause of and major contributor to increased forward scatter and as a result, optical degradation, in the ageing eye, particularly at photopic luminance when the contrast sensitivity of retina is high.Citation13,Citation35,Citation36 Also, a rapid increase in forward scatter, with an associated reduction in photopic contrast sensitivity, has been reported for subjects over 45 years, in a study, which excluded subjects with significant cataract.Citation13,Citation29 This suggests that there is a contribution to forward scatter and consequent reduction in photopic contrast sensitivity beyond the fourth decade that may be attributable to other intraocular light scattering sources, including vitreous degeneration.
With cataract and neural factors controlled for in the present study, the difference in contrast thresholds observed in this case–control comparison to vitreous degeneration is attributed to the following reasons. First, while residual, higher-order optical aberrations, such as spherical aberration and coma have been implicated in the decrease in contrast sensitivity in older eyes, the assumption is made that the effect of these aberrations on contrast, if any, would be similar for our age-matched sample such that the decrease in contrast herein observed could be attributed to vitreous degeneration.Citation37 Second, senile miosis, observed in the ageing eye, has been shown to improve depth of focus and to limit spherical aberration and coma. With the exception of reduced retinal illuminance, smaller pupils may contribute to enhanced spatial vision in our study population.Citation38 In addition, the directional sensitivity of cones also limits the detrimental effects of spherical aberration, when large pupils are involved.Citation39
Impact of vitreous degeneration on photopic contrast threshold
Photopic functional contrast threshold was lower by 37.4% when cases were compared with controls, and by 64.0% when the PVD subgroup was compared with controls. This study is the first to assess the impact of vitreous degeneration on the photopic contrast threshold by employing a contrast test that maximises the contribution of optical factors to the loss of retinal image contrast. It can be inferred from the present study that vitreous degeneration can account for at least 35% of photopic contrast threshold loss when compared with healthy eyes and worsens further with increasing vitreous degeneration. Intraocular light scattering, arising from the degenerated vitreous, casts a veil of undesired light upon the retinal image, resulting in decreased contrast sensitivity.Citation40,Citation41 This reduction in image contrast remains regardless of increases in light level and may even result in a concurrent increase in glare as the illumination increases, causing a further reduction in contrast.
While the major contributor to photopic contrast decline has been attributed to cataractous lens changes, the data here are novel and support the hypothesis that vitreous degeneration contributes to the loss of photopic contrast threshold.Citation35 This significant decrease in photopic contrast threshold possibly explains the visual discomfort expressed by patients while performing important activities of daily life that involve bright backgrounds such as reading a book, working on a computer, enjoying outdoor sceneries, and driving during the day.Citation3
Effect of vitreous degeneration on mesopic contrast threshold
In the present study, mesopic contrast was 27.5% less in cases compared with controls. Also, cases with PVD demonstrated a 30.3% lower mesopic contrast when they were compared with controls. Sebag and colleagues performed an age-matched analysis of 16 subjects with floaters, who were considered for minimally invasive vitrectomy, with 16 healthy controls and reported that mesopic contrast sensitivity was worse by 67% in the floaters group.Citation18 The same group prospectively studied previously normal eyes of subjects who subsequently developed PVD and reported a decline in mesopic contrast sensitivity of 52.5% following PVD development.Citation19 A retrospective study by the same group, designed to investigate the effect of the ageing vitreous on contrast, reported that contrast sensitivity was worse by 51.2% in eyes with PVD compared with eyes with no PVD.Citation20 The same group has recently published a retrospective study describing a 91% reduction in mesopic contrast sensitivity when 195 eyes of 145 subjects with vitreous floaters (of whom 77.9% had PVD) were compared with controls.Citation21
The outcome of mesopic visual function assessment is influenced by the level of retinal illuminance, retinal location tested and the spectral and spatial contents of the stimuli. Each of these parameters can affect the interaction between rod and cone signals in the mesopic range and hence, the outcome of the test.Citation42 As these parameters differ for the commercially available mesopic contrast tests, it is not unusual to observe differences in mesopic contrast sensitivity outcomes when comparing different test devices. The previous studies employed either three cycles per degree or a composition of low to medium spatial frequencies to assess mesopic contrast sensitivity while we employed a stimulus optotype rich in high spatial frequencies, which is arguably more relevant when assessing functional spatial vision. High spatial frequencies contribute less to spatial vision at lower light levels. This is because high spatial frequencies are affected more, compared to lower spatial frequencies, at lower light levelsCitation41 and results in loss of retinal sensitivity to contrast. Subsequently, an increase in scattered light would be expected, which attenuates preferentially the high frequency end of the stimulus spectrum, should cause the greatest loss of contrast sensitivity at higher light levels, when the retinal sensitivity to contrast is high, and less so, at lower light levels, when high spatial frequencies are no longer resolved by the retina.Citation35,Citation43 The difference between this finding and results from other studies, which report a greater loss of contrast sensitivity in the mesopic range, illustrates why the method of assessing contrast sensitivity is important and can affect significantly the outcome of the experiment.
A limitation to the present study is that residual, higher-order optical aberrations were not measured and corrected, particularly for large pupil sizes in the mesopic range. While the impact of higher-order aberration on contrast sensitivity is acknowledged, the age-matched study design assumes that both groups are affected similarly by the effects of these aberrations, and the difference in contrast thresholds observed can therefore be attributed to vitreous degeneration. Higher order aberrations are indeed important, but less so with smaller pupil size (at photopic light levels) and with a Landolt ring stimulus three times above the mean acuity limit. Pupil size was undoubtedly larger under mesopic conditions but the lower, expected, retinal sensitivity to contrast in the mesopic range makes the increase in higher order aberrations less effective.Citation44
Another limitation is that the sample sizes of the cases with PVD and cases without PVD were small and a larger study is needed to confirm the findings when comparing the contrast thresholds of the three groups. While smaller samples could have provided results that were not sufficiently powered to detect a difference between the groups and a higher propensity for a type II error to occur, the significant difference in contrast thresholds observed between the groups underscore the major impact of the varying degrees of vitreous degeneration on contrast. The severity of vitreous degeneration was not assessed with quantitative ultrasonography, which has been shown to correlate with loss of contrast sensitivity.Citation17 Overall, the findings of the present study confirm previous reports and add to knowledge of the contribution vitreous degeneration makes to the loss of contrast threshold, especially under photopic luminance.
Conclusion
Vitreous opacities and PVD diminish spatial contrast under photopic and mesopic luminances. The findings from the present study also highlight the importance of the method employed to assess contrast thresholds at photopic and mesopic light levels. In addition to eliminating the symptomatic effects caused by vitreous degeneration, any treatment that can safely reduce or eliminate vitreous degeneration will also improve contrast sensitivity.
Acknowledgements
This work was funded by Waterford Institute of Technology (WIT) and ebiga-VISION GmbH through a WIT Co-Fund PhD scholarship (WD_2017_43). The sponsors had no role in the study design or in the collection, analysis and interpretation of the data or in the writing of the report or in the decision to submit the paper for publication. John Barbur is an inventor of AVOT tests (some of which were employed in this study); an employee of City, University of London; and a director of City Occupational Ltd (a City University spin-out company setup to manufacture and supply AVOT tests). All the other authors report no conflicts of interest and have no proprietary interest in any of the materials mentioned in this article.
Disclosure statement
No potential conflict of interest was reported by the author(s).
Additional information
Funding
References
- Bishop P. The biochemical structure of mammalian vitreous. Eye. 1996;10:664.
- Milston R, Madigan MC, Sebag J. Vitreous floaters: etiology, diagnostics, and management. Surv Ophthalmol. 2016;61:211–227.
- Lumi X, Hawlina M, Glavač D, et al. Ageing of the vitreous: from acute onset floaters and flashes to retinal detachment. Ageing Res Rev. 2015;21:71–77.
- Johnson MW. Perifoveal vitreous detachment and its macular complications. Trans Am Ophthalmol Soc. 2005;103:537.
- Johnson CA, Casson EJ. Effects of luminance, contrast, and blur on visual acuity. Optom Vis Sci. 1995;72:864–869.
- Regan D, Neima D. Low-contrast letter charts in early diabetic retinopathy, ocular hypertension, glaucoma, and Parkinson’s disease. Br J Ophthalmol. 1984;68:885–889.
- Della Sala S, Bertoni G, Somazzi L, et al. Impaired contrast sensitivity in diabetic patients with and without retinopathy: a new technique for rapid assessment. Br J Ophthalmol. 1985;69:136–142.
- Chisholm CM, Evans ADB, Harlow JA, et al. New test to assess pilot’s vision following refractive surgery. Aviat Space Environ Med. 2003;74:551–559.
- Owsley C, Sloane ME. Contrast sensitivity, acuity, and the perception of’real-world’targets. Br J Ophthalmol. 1987;71:791–796.
- Gillespie-Gallery H, Konstantakopoulou E, Harlow JA, et al. Capturing age-related changes in functional contrast sensitivity with decreasing light levels in monocular and binocular vision. Invest Ophthalmol Vis Sci. 2013;54:6093–6103.
- Artal P, Guirao A, Berrio E, et al. Optical aberrations and the aging eye. Int Ophthalmol Clin. 2003;43:63–77.
- Pokorny J, Smith VC, Lutze M. Aging of the human lens. Appl Opt. 1987;26:1437–1440.
- Hennelly ML, Barbur JL, Edgar DF, et al. The effect of age on the light scattering characteristics of the eye. Ophthalmic Physiol Opt. 1998;18:197–203.
- Curcio CA, Millican CL, Allen KA, et al. Aging of the human photoreceptor mosaic: evidence for selective vulnerability of rods in central retina. Invest Ophthalmol Vis Sci. 1993;34:3278–3296.
- Gao H, Hollyfield JG. Aging of the human retina. Differential loss of neurons and retinal pigment epithelial cells. Invest Ophthalmol Vis Sci. 1992;33:1–17.
- Pardhan S. Contrast sensitivity loss with aging: sampling efficiency and equivalent noise at different spatial frequencies. JOSA A. 2004;21:169–175.
- Mamou J, Wa CA, Yee KMP, et al. Ultrasound-based quantification of vitreous floaters correlates with contrast sensitivity and quality of life. Invest Ophthalmol Vis Sci. 2015;56:1611–1617.
- Sebag J, Yee KMP, Wa CA, et al. Vitrectomy for floaters: prospective efficacy analyses and retrospective safety profile. Retina. 2014;34:1062–1068.
- Garcia GA, Khoshnevis M, Yee KMP, et al. Degradation of contrast sensitivity function following posterior vitreous detachment. Am J Ophthalmol. 2016;172:7–12.
- Garcia GA, Khoshnevis M, Yee KMP, et al. The effects of aging vitreous on contrast sensitivity function. Graefes Arch Clin Exp Ophthalmol. 2018;256:919–925.
- Sebag J, Yee KMP, Nguyen JH, et al. Long-term safety and efficacy of limited vitrectomy for vision degrading vitreopathy resulting from vitreous floaters. Ophthalmol Retina. 2018;2:881–887.
- Wagle AM, Lim WY, Yap TP, et al. Utility values associated with vitreous floaters. Am J Ophthalmol. 2011;152:60–65.e61.
- Margo CE, Harman LE. Posterior vitreous detachment: how to approach sudden-onset floaters and flashing lights. Postgrad Med. 2005;117:37–42.
- Dadeya S, Kaushik S. Contrast sensitivity and depth of focus with aspheric multifocal versus conventional monofocal intraocular lens. Can J Ophthalmol. 2001;36:197–201.
- Chylack LT, Wolfe JK, Singer DM, et al. The lens opacities classification system III. Arch Ophthalmol. 1993;111:831–836.
- Bi W, Gillespie-Gallery H, Binns A, et al. Flicker Sensitivity in Normal Aging—Monocular Tests of Retinal Function at Photopic and Mesopic Light Levels. Invest Ophthalmol Vis Sci. 2016;57:387–395.
- Cheng C-Y, Yen M-Y, Lin H-Y, et al. Association of ocular dominance and anisometropic myopia. Invest Ophthalmol Vis Sci. 2004;45:2856–2860.
- Keuken A, Subramanian A, Barbur J. Normal upper age‐limits for photopic and mesopic visual acuity and functional contrast sensitivity. Acta Ophthalmol. 2017;95.
- Patterson EJ, Bargary G, Barbur JL. Understanding disability glare: light scatter and retinal illuminance as predictors of sensitivity to contrast. JOSA A. 2015;32:576–585.
- O’Neill‐Biba M, Sivaprasad S, Rodriguez‐Carmona M, et al. Loss of chromatic sensitivity in AMD and diabetes: a comparative study. Ophthalmic Physiol Opt. 2010;30:705–716.
- Garcıa-Pérez MA. Forced-choice staircases with fixed step sizes: asymptotic and small-sample properties. Vision Res. 1998;38:1861–1881.
- Levitt H. Transformed up‐down methods in psychoacoustics. J Acoust Soc Am. 1971;49:467–477.
- Van den Berg T, Franssen L, Coppens JE. Ocular media clarity and straylight. Encycl Eye. 2010;173–183.
- van den Berg TJTP, Franssen L, Kruijt B, et al. History of ocular straylight measurement: a review. Z Med Phys. 2013;23:6–20.
- Owsley C. Aging and vision. Vision Res. 2011;51:1610–1622.
- Dalimier E, Dainty C, Barbur JL. Effects of higher-order aberrations on contrast acuity as a function of light level. J Mod Opt. 2008;55:791–803.
- Oshika T, Okamoto C, Samejima T, et al. Contrast sensitivity function and ocular higher-order wavefront aberrations in normal human eyes. Ophthalmology. 2006;113:1807–1812.
- Sloane ME, Owsley C, Alvarez SL. Aging, senile miosis and spatial contrast sensitivity at low luminance. Vision Res. 1988;28:1235–1246.
- Flamant F, Stiles WS. The directional and spectral sensitivities of the retinal rods to adapting fields of different wave‐lengths. J Physiol. 1948;107:187–202.
- Gholami S, Reus NJ. Van den Berg TJTP. The significance of changes in pupil size during straylight measurement and with varying environmental illuminance. J Optom. 2018;11:167–173.
- Sloane ME, Owsley C, Jackson CA. Aging and luminance-adaptation effects on spatial contrast sensitivity. JOSA A. 1988;5:2181–2190.
- Stockman A, Sharpe LT. Into the twilight zone: the complexities of mesopic vision and luminous efficiency. Ophthalmic Physiol Opt. 2006;26:225–239.
- Montes-Mico R, Espana E, Menezo JL. Mesopic contrast sensitivity function after laser in situ keratomileusis. J Refract Surg. 2003;19:353–356.
- Barbur JL, Stockman A. Photopic, mesopic and scotopic vision and changes in visual performance. Encycl Eye. 2010;3:323–331.