
ABSTRACT
Clinical relevance
Efforts to provide accessible eye care must consider the extent to which travel-distance may be a barrier for some communities.
Background
This study aimed to determine the distribution of — and geographic access to — eye health services in Aotearoa New Zealand. We further sought to identify communities who might benefit from provision of eye health services that were more geographically accessible.
Methods
We obtained addresses of optometry and ophthalmology clinics from regulatory bodies and augmented this with online searches. Address locators were created using a Land Information dataset and geocoded using ArcGIS 10.6. A national population was derived using Statistics New Zealand’s Integrated Data Infrastructure. We generated population-weighted centroids of each of New Zealand’s 50,938 meshblocks and calculated the travel distance along the road network between each clinic and population (meshblock centroid). The proportion of the population living >50 km from each clinic type was calculated; as was the median, inter-quartile range and maximum distance across area-level deprivation quintiles in each district.
Results
A national population of 4.88 million was identified, as were addresses for 344 optometry, 46 public ophthalmology and 90 private ophthalmology clinics. Nationally and within each district, travel distance to optometry was shorter than to either type of ophthalmology clinic. The region of Northland — with a high proportion of the population Māori and in the highest quintile of area-level deprivation — had the furthest average distance to travel to optometry and public ophthalmology, while the West Coast region on the South Island had the farthest to travel to private ophthalmology. Several communities were identified where longer distances intersected with higher area-level deprivation.
Conclusion
Most New Zealanders live within 10 km of eye health services. However, to achieve equitable eye health, strategies are required that make affordable eye health services accessible to communities for whom large travel distances intersect with high deprivation.
Introduction
The population of Aotearoa New Zealand (hereafter referred to as New Zealand) was estimated to be 5.1 million in 2020.Citation1 Approximately three quarters of New Zealanders live on the North Island (76.5%), a quarter live on the South Island (23.5%) and fewer than 1,000 are spread across other smaller islands.Citation2 New Zealand’s population is sparsely distributed, with a relatively low mean population density of 19 people/kmCitation2 in 2020.Citation3 In the coming decades, the population is projected to get older,Citation4 more ethnically diverse,Citation5 and increasingly urbanised.Citation6
Health inequity is pervasive in New Zealand, with Māori and Pacific people – who represent almost a quarter of the populationCitation5 — experiencing worse health and lower access to health services compared to other New Zealanders.Citation7 Health inequalities are also observed based on area-level deprivationCitation8 and geographic access to health services.Citation9
Although there has been no population-based study on the prevalence of vision impairment or service coverage in New Zealand, differential access to eye health services has been documented. Māori, Pacific people and young adults were less able to access diabetic retinopathy care,Citation10 Māori and Pacific people reported accessing an eye examination in the previous five years at half the rate of New Zealand Europeans (14% compared to 31%)Citation11 and Māori present less for cataract services than New Zealand Europeans and tend to have more advanced cataract when they present.Citation12
Until mid-2022, public health services in New Zealand we delivered by 20 District Health Boards (DHBs) funded by the Ministry of Health. All DHBs deliver ophthalmology services, including outpatient and surgical services. Some ophthalmology clinics are not permanently staffed so that the services provided are intermittent. Appointments can only be obtained following referral from a primary care practitioner. Primary care services are generally provided by optometrists, who predominantly practice privately. The other major practitioner group are ophthalmologists providing services directly to patients through private practice. A recent analysis of the distribution of optometrists and ophthalmologists across DHBs concluded that ophthalmologists were more evenly distributed in proportion to the DHB population compared to optometrists, who were more likely to practice in densely populated areas such as Auckland.Citation13 This analysis did not assess inequality in the population within each DHB by factors such as travel distance or area-level deprivation.
In 2015, New Zealand was one of 193 countries that committed to achieve the United Nation’s 17 Sustainable Development Goals (SDGs) by 2030.Citation14 The overarching aim of the SDGs is to leave no one behind, including in terms of universal health coverage, where everyone has access to good quality health care that does not lead to financial hardship.Citation15 To achieve this aim, governments must address the inequalities that stem from discrimination, geographic location, and socio-economic status.Citation16 The aim of this study was to determine the distribution and geographic access to eye health services (optometry and ophthalmology) in New Zealand, and to identify communities that could benefit from more accessible eye health services.
Methods
This is a cross-sectional study using (a) the addresses of all optometry and ophthalmology eye clinics in New Zealand and (b) the total estimated population (as of 2018). Ethical approval for this study was secured from the University of Auckland Human Participants Ethics Committee (Ref: 021293) and the Health and Disability Ethics Committee (Ref:18/NTA/79/AM01). The study is reported according to the relevant items in the STROBE Reporting Guideline.Citation17
Supply of eye health services/clinics
Eye clinic addresses
Names of registered optometrists and vocationally registered ophthalmologists were obtained from the relevant regulatory organisations – Optometrists and Dispensing Opticians Board (www.odob.health.nz) and the Medical Council of New Zealand (www.mcnz.org.nz). Practice addresses were also available for optometrists through the New Zealand Association of Optometrists website (www.nzao.co.nz). To ensure we had captured all clinic locations, we cross-checked names of practitioners against practice addresses. In addition, we visited the websites of the major optometry businesses in New Zealand, obtained the addresses of all practices listed therein and cross-checked these addresses against the list provided by the New Zealand Association of Optometrists to identify clinics that may employ optometrists who are not members of the Association (e.g., OPSM, Visique, Specsavers, Bailey Nelson, Mortimer Hirst, Paterson Burn and Matthews Group). DHB websites and private ophthalmology practice websites were also cross-checked to ensure that all practitioners were matched to their clinic locations. This analysis does not include locations where emergency care may be provided with subsequent referral to eye clinics (e.g., after-hours medical centre, emergency department).
Geocoding of the clinic addresses
Address locators were created using a New Zealand Street Address dataset provided by Land Information New Zealand, last updated on the 4th of November 2018 and accessed from https://data.linz.govt.nz. All addresses were then automatically geocoded using the Geocoding extension within ArcGIS 10.6. Where addresses could not be automatically matched using the locators (e.g., due to incorrect formatting), manual checking against Google Maps was performed to obtain correct address information. The revised addresses were then manually matched using the locators.
Population demand for eye clinics
A comprehensive population-estimate was derived using an activity-based approachCitation18,Citation19 using multiple datasets available within Statistics New Zealand’s Integrated Data Infrastructure (IDI). At the core of the IDI is a ‘spine’ that aims to capture all individuals who have ever been residents of New Zealand. The spine is created from three datasets: Inland Revenue, Births and Visas.
Individuals were selected if in 2017 they:
(were within the IDI Spine and were active in at least one of: tax, education, or injury claims data sources) or (were active in the births or visa dataset in the last five years) or (were within and active in the health datasets); and
had lived in New Zealand for more than 6 months; and
were alive on 31 December 2017; and
were aged between 0 and 115 years old; and
had usual residential meshblock information.
The population was summarised by the newest meshblock which was the smallest official geographic area in New Zealand in 2018. Locations for the national population were represented as population-weighted centroids of meshblocks, derived by spatially joining the Land Information New Zealand Street Address point feature class to the meshblock boundary polygon feature class, then generating a centroid for each meshblock using the ‘mean centre’ tool in ArcGIS, with meshblock as the grouping variable.
Travel distance between clinics and populations
The travel distance along the road network between each clinic and population location was calculated using the origin – destination cost matrix function of the ArcGIS 10.6 Network Analyst Extension. The matrix retains information regarding 2018-meshblocks, the clinics and the network distance between meshblock centroids and clinics.
We calculated the median, inter-quartile range (IQR) and maximum travel distance to the closest clinic of each provider for the population across each DHB and by each area-level index of multiple deprivationCitation20 quintile in New Zealand.
We identified the meshblocks located >50 km from each of the three clinic types. The distance of >50 km was chosen assuming that people would be willing to travel this distance for an eye examination. We calculated the proportion of the population living in these meshblocks, and the distribution of meshblocks across area-level index of multiple deprivation quintiles and DHB.
Finally, we sought to identify if there were locations where area-level deprivation intersected with longer distances to travel to eye health services. To explore this, within each DHB we visualised the median, inter-quartile range and maximum travel distance to the closest optometry clinic and the closest public ophthalmology clinic across area-level deprivation quintiles.
Results
We identified and geocoded a total of 344 optometry clinics, and 46 public and 90 private ophthalmology clinics. The geographical distribution of these clinics is shown in supplementary figure 1. A total of 4,879,049 people were identified in the IDI as the population. 65.7% of that group lived in major/large urban centres, 18.3% in small/medium urban centres and 15.9% in rural areas. Based on this population and 50,938 meshblocks, the origin-destination pairs for each of the eye clinics used in this analysis are presented in and the distance along the road network from each population-weighted meshblock centroid to the closest clinic in each category is shown in .
Figure 1. The shortest road network distance from population-weighted meshblock centroids to the closest. A: optometry, B: public ophthalmology, C: private ophthalmology clinic in Aotearoa New Zealand.
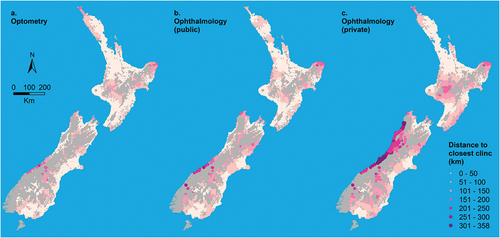
Table 1. Travel distance to optometry and ophthalmology clinics in New Zealand.
Three quarters of the New Zealand population lived within 10 km of optometry services (median 3.0 km; IQR1.6–9.5) while over half lived within 10 km of public (median 8.8 km; IQR4.1–27.5) and private (median 6.4 km; IQR2.9–26.5) ophthalmology clinics. Median distance to all types of clinics were shortest for people living in major/large urban centres and farthest for rural dwellers. People in small/medium urban centres had similar distances to optometry clinics as those living in large/major urban centres, but farther to reach both ophthalmology clinics ().
Nationally, 2.8% of the population (in 6.0% of meshblocks) were >50 km away from an optometry clinic, compared to 7.1% of the population (in 11.8% of meshblocks) for public ophthalmology and 10.3% of the population (in 16.5% of meshblocks) for private ophthalmology. For all three clinic types, access was better in the North Island compared to the South Island, and the disparity by Island was greater for ophthalmology than optometry ().
On average, people living in DHBs in and around the most populous cities of Auckland (Auckland Metro DHB) and Wellington (Capital and Coast, Hutt Valley DHBs) had the shortest distances to travel to each of the clinics. Indeed, everyone living in Capital and Coast and almost everyone in Hutt Valley lived within 20 km of an optometrist (). People living in Capital and Coast were, on average, closest to optometry clinics (median travel distance 2.5 km; IQR1.3–4.0). In contrast, people living in Northland had, on average, the furthest distance to travel to optometry (29.6 km; IQR5.5–54.6) and public ophthalmology (31.6 km; IQR7.9–62.4), while people in the West Coast had furthest to travel to private ophthalmology (232 km; IQR 211–238)(supplementary Table S1).
Figure 2. Road network distance (km) from population-weighted centroid of 2018 meshblocks to closest optometry clinic by District Health Board (DHB) and Area Level Index of Multiple Deprivation quintile (Q1 least deprived/q5 most deprived).
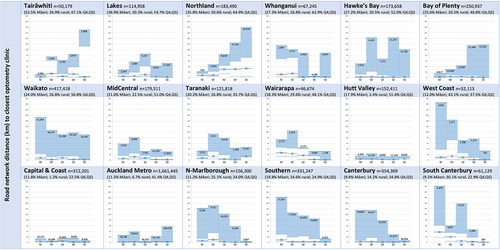
Large variation was evident when travel distance to optometry and public ophthalmology was considered by area-level deprivation within each DHB (). Across almost all DHBs and deprivation quintiles, the median distance to the closest optometrist was <20 km. The three DHBs that were exceptions were Northland, where the three most deprived quintiles had a median distance >20 km, and Wairarapa and South Canterbury, where the median distance of the least deprived quintiles was >20 km. Public ophthalmology clinics also tended to be within 20 km of most of the population — seven DHBs had at least one quintile with a median travel distance to a clinic >20 km, though this never exceeded 40 km and there was no clear pattern in more or less deprived quintiles ().
Figure 3. Road network distance (km) from population-weighted centroid of 2018 meshblocks to closest public ophthalmology clinic by District Health Board (DHB) and Area Level Index of Multiple Deprivation quintile (Q1 least deprived/q5 most deprived).
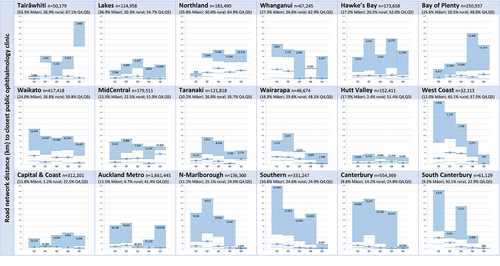
A gradient in distance to optometry can be seen in half of the DHBs, with travel distance tending to increase in a stepwise manner with increasing or decreasing area-level deprivation. Where a gradient was present for the DHBs with a higher Māori population (top row of ), travel distance tended to increase with increasing deprivation. In contrast, where a gradient was present in DHBs with a lower Māori population (bottom row of ), travel distance tended to increase with decreasing deprivation. When the intersection of area-level deprivation and travel distance is considered, it is possible to identify communities that could benefit from strategies to make services more accessible — communities living in more deprived areas of Tairāwhiti and Northland are priorities, and Whanganui, Hawke’s Bay, Bay of Plenty and Waikato also have communities living in areas with high deprivation and >50 km from optometry. Distances to public ophthalmology clinics for these communities tended to be slightly farther than to optometry, though in Northland and Waikato distances for people in the farthest quartile for the most deprived quintiles were shorter than to optometry (supplementary Figure S2).
Discussion
Our study calculated travel distance from population-weighted meshblock centroids, which were linked to aggregated meshblock-level population constructed in the IDI, to eye health services in New Zealand. Eye health services are geographically accessible to most New Zealanders — three — quarters lived within 10 km of an optometry clinic and half lived within 10 km of an ophthalmology clinic. Our results confirm that travel distance to optometry services is less than to either public or private ophthalmology services at the national level, as well as across the North and South Islands, all levels of rurality and within all DHBs. This is unsurprising, given the higher number of optometric clinics and the primary nature of the services provided by optometrists. However, we identified communities in several regions that experience an intersection of longer travel distances, and higher levels of deprivation. Addressing the situation of such communities should be a priority to improve access to eye health services.
Our finding that people in rural areas were further away from eye health services is consistent with previous research concerning access to primary health care providers in New ZealandCitation21 as well as access to eye health care providers elsewhere.Citation22 Evidence from the United States suggests that the increased distance experienced by rural dwellers may be a barrier to care regardless of one’s socio-economic status.Citation23 In Australia, people living in rural and remote locations were less likely to regularly access eye health services.Citation24 New Zealand is much smaller than either the United States or Australia so that our maximum travel-distances tend to be shorter, but rural communities face challenging terrain and reduced access to public transport which represent significant barriers to their accessing eye care and other health services.Citation25
In 2018, New Zealand had 743 practicing optometristsCitation26 and 135 ophthalmologists,Citation13 equating to practitioner to population ratios of 15.2 per 100,000 for optometrists and 2.8 per 100,000 for ophthalmologists, which is low relative to other high-income countries.Citation27,Citation28 As for other health workers, eye health practitioners in New Zealand tend to be concentrated in urban areas due to a variety of personal, professional, organisational, economic and cultural factors.Citation29 Optometrists tend to operate in close proximity to people in small/medium in addition to major/large urban centres, covering 84.0% of the population. In contrast, ophthalmology services are much less accessible for some communities, such as the West Coast of the South Island, where services are available only at certain times of the year.
We recognise that living within a short distance of an eye health service does not guarantee it is accessible — travel distance is only one of a myriad of factors that influence access to health care.Citation30 Improving cultural safety of health services is a priority in New Zealand, with services historically failing Māori in particular.Citation31 Our results suggest that travel distance is unlikely to be a major barrier to accessing eye health services for the majority of New Zealanders. However, we did identify some communities where greater travel distances existed for people living in areas of higher deprivation, and these communities tended to be in DHBs with a higher Māori population (). Even within a particular district Māori can have further to travel — a recent analysis of travel distance for patients undergoing cataract surgery in Waikato district found that travel distance for Māori was 27% further compared to New Zealand Europeans, and they had more advanced cataract and worse vision on presentation.Citation32 Providers interested in improving equity in eye health could engage with communities where longer distances intersect with high area-level deprivation to identify strategies to provide more accessible services, which will likely require overcoming additional barriers such as cultural safety.Citation31
Given the relatively small population sizes in communities where longer travel distance intersects with area-level deprivation, models of ‘outreach’ could be considered rather than establishing permanent services.Citation33,Citation34 Unfortunately, New Zealand is without schemes to enable outreach services, such as the Visiting Optometrists Scheme, the Eye Surgical Support Program and the Rural Health Outreach Fund in Australia whereby government funding addresses the financial disincentives to provide services to rural and remote communities. In addition, Australia also has policies that subsidise the cost of an eye examination and the provision of spectacles,Citation35,Citation36 neither of which operate in New Zealand. The health system reforms announced in 2021Citation37 provide the opportunity for financing of eye health services to be revisited to ensure all New Zealanders can access the care they need.
Another group that could be prioritised for ensuring accessible eye health services is people living with diabetes, who the Ministry of Health recommends should undergo retinal screening every 2–3 years.Citation38 Whether travel-distance is a barrier to patients attending retinal screening has not been explored in New Zealand, but in the United States, people living in counties without eye care providers were less likely to have accessed retinal screening, regardless of their health insurance status.Citation39 Some DHBs in New Zealand have attempted to address geographic barriers to retinal screening by providing mobile services using telehealth,Citation40 a common strategy in other countries,Citation34 which may be worth considering in more regions of New Zealand.
Our findings need to be interpreted in the context of several limitations. First, data were unavailable on the number of clinicians working at each eye clinic. As a result, all clinics were treated equally which will under- or over-represent supply where there is more or less than one full-time equivalent clinician at a clinic respectively. We recognise some addresses are visited infrequently so our results may over-estimate access, particularly in more rural areas. Second, the available road network dataset does not contain information on one-way or vehicle restriction roads, or speed limits. This meant we were unable to consider travel direction constraints and access barriers in the network analysis, nor could we calculate travel time alongside travel distance. Finally, eye care practitioners may have relationships with community organisations to deliver services closer to where people live which we were unable to identify. Eye health services in New Zealand would benefit from a better understanding of these relationships so that they can be evaluated and potentially put in place elsewhere.
Conclusion
Travel distance is unlikely to be a barrier to accessing eye health services for the majority of New Zealanders. However, there are communities living relatively far that also experience high area-level deprivation, and these are predominantly in areas with a relatively high Māori population. Strategies to make eye health services more accessible for these communities must form part of efforts to achieve universal health coverage for eye health.
Authors’ contributions
JR conceived of this study; JR, JZ, AL, JB developed methodology; JB, JR extracted eye clinic data; JZ extracted and analysed IDI data, geocoded eye clinic addresses, conducted accessibility analysis and constructed maps; AL and JR undertook statistical analysis; all authors interpreted results; JR, JZ, OW drafted the paper; all authors revised the methodology and the draft paper and provided feedback; all authors signed off the paper for submission.
Disclaimer
Access to the data used in this study was provided by Stats NZ under conditions designed to give effect to the security and confidentiality provisions of the Statistics Act 1975. The results presented in this study are the work of the authors, not Stats NZ or individual data suppliers.
The population data are not official statistics. They have been created for research purposes from the Integrated Data Infrastructure (IDI) which is carefully managed by Stats NZ. For more information about the [IDI and/or LBD] please visit https://www.stats.govt.nz/integrated-data/.
The population data are based in part on tax data supplied by Inland Revenue to Stats NZ under the Tax Administration Act 1994 for statistical purposes. Any discussion of data limitations or weaknesses is in the context of using the IDI for statistical purposes, and is not related to the data’s ability to support Inland Revenue’s core operational requirements.
Ethics
Ethics approval for this study was granted by the University of Auckland Human Participants Ethics Committee (Ref: 021293) and the Health and Disability Ethics Committee (Ref:18/NTA/79/AM01).
List of abbreviations
IDI Integrated data infrastructureSDGs Sustainable Development Goals
Travel distance to eye clinics in Aotearoa
Download PDF (303.9 KB)Disclosure statement
No potential conflict of interest was reported by the author(s).
Data availability statement
The population data that support the findings of this study are constructed from the Integrated Data Infrastructure (IDI) of Statistics New Zealand, but restrictions apply to the availability of these data. Only aggregated population data at the meshblock level with rounding and suppression rules applied were checked and released by the IDI team for the current study, and so individual level data are not publicly available. Data of eye clinics are available from the authors upon request.
Supplemental data
Supplemental data for this article can be accessed online at https://doi.org/10.1080/08164622.2022.2102410.
Additional information
Funding
References
- Statistics New Zealand - Tatauranga Aotearoa. Estimated population of NZ. 2021.
- Statistics New Zealand - Tatauranga Aotearoa. 2018 census place summaries. 2021.
- Food and Agriculture Organization and World Bank population estimates. Population density (people per sq. km of land area) - New Zealand. 2020.
- Statistics New Zealand - Tatauranga Aotearoa. National population projections: 2020(base)-2073. 2021.
- Statistics New Zealand - Tatauranga Aotearoa. Ethnic populations projected to grow across New Zealand. 2021.
- Brabyn L. Declining towns and rapidly growing cities in New Zealand: developing an empirically-based model that can inform policy. Policy Q 2017;13: 37–46.
- Ministry of Health - Manatū Hauora. Annual data explorer 2018/2019: NZ health survey. 2019.
- Exeter DJ, Shackleton N, Browne M, et al. Different domains of deprivation and their relationship with obesity in New Zealand 4‐year‐old children. Pediatr Obes 2019;14: e12520.
- Beere P, Brabyn L. Providing the evidence: geographic accessibility of maternity units in New Zealand. N Z Geogr 2006;62: 135–143.
- Ramke J, Jordan V, Vincent AL, et al. Diabetic eye disease and screening attendance by ethnicity in New Zealand: a systematic review. Clin Exp Ophthalmol 2019;47:937–947.
- Ahn MJ, Frederikson L, Borman B, et al. Eye health in New Zealand: a study of public knowledge, attitudes, and practices related to eye health and disease. Health Educ 2011;111:147–155.
- Chilibeck C, Mathan JJ, Ng SG, et al. Cataract surgery in New Zealand: access to surgery, surgical intervention rates and visual acuity. N Z Med J 2020;133: 40–46.
- Chapman NA, Anstice NS, Jacobs RJ. Geographic distribution of eye‐care practitioners in Aotearoa/New Zealand: implications for future eye health workforce. Clin Exp Optometry 2020;103: 531–541.
- United Nations General Assembly. Transforming our world: the 2030 agenda for sustainable development. In: Resolution adopted by the general assembly on 25 September 2015. New York: United Nations General Assembly, Seventieth session, agenda items 15 and 116, United Nations; 2015.
- World Health Organization. What is universal coverage? 2016.
- United Nations Development Program. What does it mean to leave no one behind? A UNDP discussion paper and framework for implementation: July 2018. New York (NY): United Nations Development Program; 2021.
- Von Elm E, Altman DG, Egger M, et al. The Strengthening the Reporting of Observational Studies in Epidemiology (STROBE) statement: guidelines for reporting observational studies. Prev Med 2007; 45: 247–251.
- Gibb S, Bycroft C, Matheson-Dunning N. Identifying the New Zealand resident population in the Integrated Data Infrastructure (IDI). Wellington: Statistics New Zealand/Tatauranga Aotearoa; 2016.
- Zhao J, Gibb S, Jackson R, et al. Constructing whole of population cohorts for health and social research using the New Zealand integrated data infrastructure. Aust N Z J Public Health 2018; 42: 382–388.
- Exeter DJ, Zhao J, Crengle S, et al. The New Zealand Indices of Multiple Deprivation (IMD): a new suite of indicators for social and health research in Aotearoa, New Zealand. PLoS One 2017;12: e0181260.
- Hiscock R, Pearce J, Blakely T, et al. Is neighborhood access to health care provision associated with individual‐level utilization and satisfaction? Health Serv Res 2008;43:2183–2200.
- Lee CS, Su GL, Baughman DM, et al. Disparities in delivery of ophthalmic care; an exploration of public Medicare data. PLoS One 2017; 12: e0182598.
- Rothman AL, Stoler JB, Vu DM, et al. A geodemographic service coverage analysis of travel time to glaucoma specialists in Florida. J Glaucoma 2020; 29: 1147–1151.
- Foreman J, Xie J, Keel S, et al. Utilization of eye health‐care services in Australia: the National Eye Health Survey. Clin Exp Ophthalmol 2018; 46: 213–221.
- Lilley R, de Graaf B, Kool B, et al. Geographical and population disparities in timely access to prehospital and advanced level emergency care in New Zealand: a cross-sectional study. BMJ Open 2019; 9: e026026.
- Optometrists and Dispensing Opticians Board. Optometrists and Dispensing Opticians Board (ODOB) annual report 2017/18. Wellington: ODOB; 2018.
- Resnikoff S, Lansingh VC, Washburn L, et al. Estimated number of ophthalmologists worldwide (International Council of Ophthalmology update): will we meet the needs? Br J Ophthalmol 2020; 104: 588–592.
- Naidoo K, Govender-Poonsamy P, Morjaria P, et al. Global mapping of optometry workforce. Ophthalmic Physiol Optics In press.
- Dussault G, Franceschini MC. Not enough there, too many here: understanding geographical imbalances in the distribution of the health workforce. Hum Resour Health 2006; 4:1–16.
- Levesque J-F, Harris MF, Russell G. Patient-Centred access to health care: conceptualising access at the interface of health systems and populations. Int J Equity Health 2013;12: 1–9.
- Curtis E, Jones R, Tipene-Leach D, et al. Why cultural safety rather than cultural competency is required to achieve health equity: a literature review and recommended definition. Int J Equity Health 2019;18:1–17.
- Wilkinson B, McKelvie J. Evaluating barriers to access for cataract surgery in Waikato: analysis of calculated driving distance and visual acuity. N Z Med J 2021;134:105–112.
- Hamm LM, Yashadhana A, Burn H, et al. Interventions to promote access to eyecare for non-dominant ethnic groups in high-income countries: a scoping review. BMJ Glob Health 2021; 6:e006188.
- Burn H, Hamm L, Black J, et al. Eye care delivery models to improve access to eye care for Indigenous peoples in high-income countries: a scoping review. BMJ Glob Health 2021; 6: e004484.
- Commonwealth of Australia Department of Health. Eye health schemes (aids and appliances). Canberra: Commonwealth of Australia Department of Health; 2016.
- Optometry Australia. Subsidised spectacle schemes.
- Department of the Prime Minister and Cabinet. The new health system. Wellington: Department of the Prime Minister and Cabinet; 2021.
- Ministry of Health. Diabetic retinal screening, grading, monitoring and referral guidance. Wellington: Ministry of Health; 2016.
- Chou C-F, Zhang X, Crews JE, et al. Impact of geographic density of eye care professionals on eye care among adults with diabetes. Ophthalmic Epidemiol 2012;19:340–349.
- Reda E, Dunn P, Straker C, et al. Screening for diabetic retinopathy using the mobile retinal camera: the Waikato experience. N Z Med J 2003; 116: U562.