
ABSTRACT
Artificial intelligence systems are becoming increasingly available as diagnostic aids for optometric practice. These perform well but are often ‘black-box’ systems offering little or no insight into how a decision was reached. While there is potential for artificial intelligence to improve patient outcomes, clinicians without training in computer science may find it difficult to ascertain whether these technologies are suitable for their practice, or how they should be used. This review provides an overview of how artificial intelligence systems work in optometry, their strengths, weaknesses, and regulatory considerations. A checklist is provided for appraising a system, covering regulatory approvals, ascertaining what the system can and cannot do, how it can be used in practice, whether it is suitable for the clinical population, and whether the outputs can be explained. Artificial intelligence has the potential to improve accuracy and efficiency in many areas of optometry if used correctly, and should be embraced by clinicians as an assistive tool.
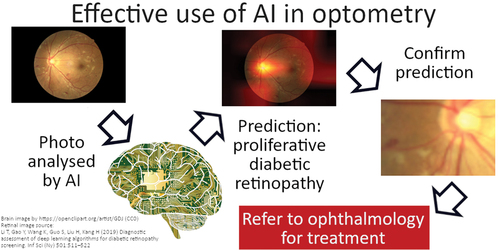
GRAPHICAL ABSTRACT
What is artificial intelligence?
Artificial intelligence (AI) is a term used to describe a variety of software systems that enable machines to make decisions that appear ‘intelligent’ to the human observer. Citation1 This may involve rule-based systems designed by humans or be based on an algorithm that the machine itself has developed through a process known as machine learning. AI may be utilised to improve workflows or usability of devices, such as automatic focus systems on cameras,Citation2,Citation3 or to make more complex decisions, such as the detection and classification of diseases.Citation4–6 As the scope of optometric practice and the utilisation of imaging technologies expand, AI will, in turn, become more influential in clinical decision-making, and therefore it is important that clinicians develop a better understanding of the processes underpinning AI and the inherent advantages and limitations of this technology.
This review will extend the work of Charng et al.,Citation7 to explain the similarities and differences between the ways humans and machines approach clinical problems, explore the strengths and weaknesses of AI, and understand how AI can be used to assist practitioners in making high quality clinical decisions. By understanding the limitations of AI systems, or the biases that these systems may have, clinicians can modify their own diagnostic decision making to take advantage of the benefits of AI-derived information and avoid the pitfalls of over-reliance on these systems.
AI is already being used in eyecare in various ways. Key examples include in image acquisition and noise reduction in ocular coherence tomography (OCT)Citation8,Citation9 and OCT angiography.Citation10 AI is also used to aid in technical tasks such as OCT retinal layer segmentationCitation11,Citation12 and image co-registration.Citation13 These AI systems have become so accurate and useful that their adoption in clinical practice has occurred both inconspicuously and ubiquitously. More recently, AI systems have been developed to detect the optic disc and macula in fundus images,Citation14–16 and further developed to provide clinical decision support or even to make diagnoses autonomously.Citation5,Citation17–19
Whilst this decision-making form of AI is viewed by some as a threat to the profession, others recognise that these tools have substantial potential to improve care delivery for screening, diagnostic confidence, and practitioner efficiencyCitation20,Citation21 This review will provide a basic understanding of how AI works in the context of clinical diagnostic assistance. To illustrate this, consider an AI system which classifies fundus photos as to whether or not they contain referrable diabetic retinopathy; this example will be referred to throughout the paper.
Basic description of AI algorithms
When viewed from a clinical perspective, AI systems can be categorised as ‘white-box’, ‘grey-box’, or ‘black-box’ based on how easily the algorithm can be interpreted.Citation22 A white-box system is based on clear rules that can be understood by experts in the field. For example, the decision tree depicted in is used to grade diabetic retinopathy from retinal photographs. Such algorithms are regarded as white-box systems as the logic behind each decision is clearly defined. While these are used by clinicians, they can also be used by AI systems provided the data required to inform each decision can be extracted; the algorithm would need to include a method for detecting the presence of microaneurysms for example, or for the operator to provide this information explicitly.
Figure 1. A decision tree for diabetic retinopathy grading.
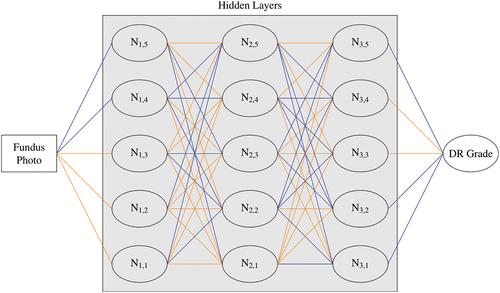
In contrast, the neural network for diabetic retinopathy grading depicted in is far more difficult to interrogate, with data passing through multiple computational nodes with different importance or ‘weightings’ attributed to each. The algorithm examines the photo as a large collection of red, green and blue pixel values, identifying ‘features’ in the data in order to arrive at a disease classification. A feature is any pattern in the data, from those clearly associated with the pathophysiology such as a group of red pixels representing haemorrhages, to obscure compositions such as the difference in green value between two distant pixel locations. Understanding exactly how these features are used to determine disease severity is impossible, hence the attribution of such models as black-box systems.
Figure 2. Example convolutional neural network for diabetic retinopathy grading. Data flows from left to right. Orange and blue lines show connections with higher or lower weighting, respectively, indicating a higher or lower impact on the calculations for the following node. N = node.
Grey-box systems are a hybrid of these designs, whereby only part of the system logic can be understood.Citation23 An example system may use a decision tree to determine the presence and location of haemorrhages in a retinal photograph, then use a neural network to classify each haemorrhage as diabetic, hypertensive or indicative of some other retinopathy.
Explainability is a term used in AI theory to qualify the extent to which the decision-making process of the model can be comprehended by humans.Citation24 By definition, white-box systems are fully explainable and black-box systems are not, though processes have been developed to approximate the inner workings of the system, as detailed below. The majority of AI systems used in optometry involve image processing, such as detecting diabetic retinopathy,Citation5,Citation17,Citation19 papilloedemaCitation18 or glaucomaCitation5 risk factors from fundus photographs, with the most accurate results generally obtained with black-box systems because they are not constrained by a need to limit detection to image features which would be apparent to a human operator.Citation22
However, the opaque nature of black-box systems has created some barriers to the adoption of this technology in healthcare, presumably because clinicians are suspicious of decision-making outcomes that they cannot verify using human logic.Citation25 While tools have been developed to improve the explainability of these systems, some basic knowledge of AI is needed to understand these tools. Neural networks, a type of AI algorithm used extensively in eyecare will be the focus of this review, however the concepts discussed are relevant to many AI technologies.
Neural networks
Neural networks consist of layers of computational units quite like the layers of neurons in the human visual cortex. A neural network is a mathematical model whereby one or more outputs, usually classifications or predictions, are calculated based on input data. These calculations are performed by passing these data through an arrangement of intermediate or ‘hidden’ layers of nodes which, like neurons in the brain, combine input signals to create an output signal. This process is explained in detail below. An example arrangement is shown in , where data are passed through three hidden layers (vertically aligned), each consisting of five nodes.
More complex neural networks, such as those in commercial or research use, have tens or even hundreds of layers with hundreds or thousands of nodes per layer, with the exact architecture determined by the programmer depending on the specifics of the task. Such complexity makes it impossible to understand the influence of each node in arriving at a final decision.
A network with only one hidden layer is called a shallow neural network or a perceptron, while those with more than one layer are known as deep neural networks. The use of deep networks is known as deep learning. Perceptrons are good for solving linearly separable problems, such as dividing two distinct clusters on a two-dimensional graph, but cannot solve more elaborate problems such as detecting retinopathy in an image.Citation26 Generally, more complex networks can solve more difficult problems but have higher memory and processing requirements. They are also harder to train.
The term ‘hidden layer’ derives from their opaque nature. Unlike a decision tree, the user is not privy to the data as it passes through these layers, or how these data are processed; data are entered into the network and one or more outputs are obtained. Hiding these intermediate data is an unfortunate necessity of the algorithm design because the interim data held in these intermediate steps are not interpretable. The role of these layers is to extract features and patterns from the input data, allowing predictions to be made based on these extractions. For example, AI which finds cats and dogs in photos may extract the shape of the eyes and ears and use these to differentiate the two animal classes.
Feature extraction occurs as data pass through nodes in the hidden layers. Each node is connected to at least one input from the previous layer, and at least one output in the following layer. Each connection has an associated parameter, known as a ‘weight’, which determines how these data influence the output value of the next node.
For illustrative purposes, imagine a neural network that determines the risk of diabetic retinopathy based on clinical risk factors, such as glycated haemoglobin levels and duration of diabetes. A node may have two input values: 9.8 representing glycated haemoglobin level, and 14.8 representing years since diagnosis of diabetes. If glycated haemoglobin level is given a weighting of 2.0 and years since diagnosis 0.5, the weighted sum would be 19.6 + 7.4 = 27 which would be passed on to the next layer. Such a model would place higher importance on glycated haemoglobin levels despite the smaller value. This is more complex in practice, with the resultant sum undergoing further processing via an ‘activation function’ which amplifies or diminishes this value based on thresholds or other mathematical processes, allowing the algorithm to learn.Citation27
More layers or nodes do not necessarily mean better performance–different designs will be better at detecting some features to the detriment of others. For example, He et al.Citation28 found that for classifying images in the CIFAR-10 dataset,Citation29 a training image bank of 60,000 images of everyday objects (e.g. animals and vehicles), increasing the number of layers of a ResNetCitation28 neural network while keeping the number of nodes per layer, training epochs and other hyperparameters unchanged, improved performance up to 110 layers, but was considerably worse when using 1202 layers. The number of layers and nodes per layer to use is based on the type and size of the input data, complexity of the problem, size of the training data, and other factors. Developing the appropriate architecture is a complex topic outside of the scope of this article, but this has been addressed in detail elsewhere.Citation30,Citation31
There are variations in the way each node processes data as they flow through the network, and how data flow from layer to layer. In image processing, additional filtering such as image convolutions are often employed,Citation32 whereby image data are analysed taking into account the surrounding pixels. Additional connections between non-adjacent hidden layers may also be added to improve accuracy and reduce overall complexity.Citation28 There are many other variations, and high-performance systems combine multiple techniques to obtain the best results.
Training and testing
Creating artificial intelligence involves more than just deciding on the network architecture. While the right design is important to enable features and patterns to be extracted, the algorithm needs to ‘learn’ how to do this. Much like humans, AI learns through exposure. This involves sample data and a process to modify the model to maximise accuracy. Both the data and training process shape how well AI will perform with real-life situations.
Data
To train AI, large sets of sample data are required which have been pre-labelled (annotated) by one or more human experts, such as fundus photos from patients with diabetes, which have been graded as referrable or not. These expert labels are known as the ‘ground truth’. Datasets need to be large–often hundreds of thousands of images–and be diverse (age, sex, ethnicity, disease severity, co-morbidities) to include as many different presentations as possible. Ideally these data are obtained from multiple camera systems with varying resolutions and image quality to more closely reflect data used in clinical practice. Complex problems tend to require larger datasets.Citation33
A diverse, large dataset gives the best opportunity to expose the AI to different clinical presentations. This is imperative to performing well with real-world data–a concept enshrined in the term ‘generalisability’. If a population is not represented in the training data, the AI may not perform well with that population when deployed in the clinic. For example, if a system is trained entirely on images with a particular colour profile or in a homogenous ethnic group, then the features that are extracted may not perform well on another camera system or a patient with different ethnicity.
Moreover, the dataset must comprise a broad range of presentations of referrable and non-referrable disease. For example, if there were very few examples of severe non-proliferative diabetic retinopathy and a preponderance of proliferative disease with vitreous haemorrhage, then the AI system will train to extract features more representative of the proliferative disease and may under-detect cases of severe non-proliferative diabetic retinopathy.
Training process
Once suitable sample data have been obtained, the AI needs to be exposed to each sample to find common patterns and features. Initially, all model connection weights are given random values. Then, one at a time or in batches, samples are passed into the AI. If the output does not match the ground truth, then the training algorithm modifies the weights using techniques like the backpropagation method,Citation34 where only the weights which had the highest impact on the prediction are changed. This continues until all samples have been passed through the system, referred to as an ‘epoch’. Training can involve hundreds or even thousands of epochs to obtain optimum performance. The network is said to converge when these modifications no longer improve the model performance, and training ceases.
Training AI in this way carries a risk of overfitting, where performance is good for the sample data set but is poor on novel data. Model overfitting is a common cause of poor real-world performance of some AI systems. To overcome this, the data may be split into three subsets: training, test, and validation sets.Citation35,Citation36 Training data are used to train the system with connection weight modification occurring as described above. After each epoch, performance is assessed using the test dataset, which has not been assessed by the AI and is not used to modify weights. If the performance is significantly better with training data compared to test data, this can indicate overfitting. Once the model has converged, a final assessment against the validation set is performed to estimate performance with data that the model has not been exposed to previously.
There are many additional factors to be considered to optimally train a network. For example, the number of epochs, how much to change each connection weights at each step, and the algorithm used to modify weights can all affect performance. These, and any other parameters defined before training begins, are collectively known as hyperparameters. Tuning these values is sufficiently difficult that hyperparameter optimisation, AI developed specifically to tune hyperparameters, is now being used as part of the design process.Citation37 Hyperparameter tuners are part of the training algorithm and do not continue to tune the model after training is complete.
Performance metrics
Accuracy is defined as the portion of predictions which match the ground truth when tested against the validation set. When an AI has a reported accuracy of, say, 80%, this by itself does not describe how well the system performs. This 80% encompasses the overall accuracy, but some predictions may be more accurate than others. A better way to assess this is with sensitivity (true positive rate: the probability of a ‘yes’ response being correct) and specificity (true negative rate: the probability of a ‘no’ response being correct).
To illustrate, consider two different systems developed to detect referable diabetic retinopathy. Metrics for these systems are presented in , showing accuracy for ‘yes’ (referrable) and ‘no’ (not referrable) separately. System X is accurate 100% of the time for non-referrable images (specificity), but only 60% of the time for referrable (sensitivity). System Y is 80% accurate for both ‘yes’ (sensitivity) and ‘no’ (specificity). Both systems have an overall accuracy of 80% (the average of sensitivity and specificity). System Y’s higher sensitivity may be desirable in a screening program, whereas System X may be preferred as an assistive diagnostic tool.
Table 1. Confusion matrices for two theoretical AI systems. Sensitivity is the fraction of actual yes responses correctly predicted as yes (X:60%, Y:80%). Specificity is the fraction of actual no responses correctly predicted as no (X:100%, Y:80%).
Whilst it may be difficult to achieve 100% for both sensitivity and specificity, parameters can be tweaked to seek different mixes of these metrics. When AI provides an output, this is not a binary yes/no response. Instead, a confidence level between 0 and 1 is produced, known as an output score. For example, an output score of 0.6 indicates a 60% confidence that referrable retinopathy is present in the image. This is considered a ‘yes’ response if it is greater than a predefined threshold, whose value will affect sensitivity and specificity. While it may seem logical to interpret any score over 0.5 as yes and smaller values as no, this threshold could be changed to, say, 0.3 to increase sensitivity, or 0.7 to increase specificity.
Improving sensitivity will generally worsen specificity, and vice versa. There are various ways to determine an appropriate threshold, with receiver operating characteristic curves being one common technique as shown in . These graphs show (1 – specificity) on the x-axis, and sensitivity on the y-axis. The line represents how these statistics change for different threshold values, starting with a threshold of 1.0 in the bottom left corner through to 0.0 in the top right. Analysing how the threshold affects these statistics allows an optimal value to be chosen.
Figure 3. Grad-CAM heatmaps showing areas of importance when detecting referable diabetic retinopathy, using two published neural network architectures. A: InceptionResNetV2.Citation38 B: InceptionV3.Citation39 Image from the DDR dataset.Citation40 Scale is the impact of this pixel on the final output relative to other pixels in the image. C: receiver operating characteristics curves for the two neural networks: blue is network A, orange is network B.
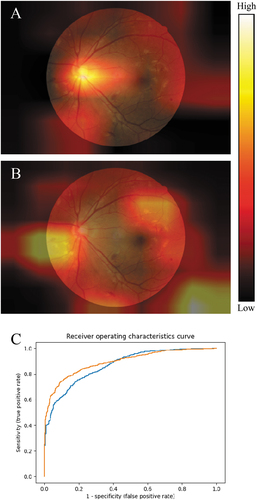
Furthermore, by calculating the area under the curve, different AI systems can be compared, with higher area values generally considered superior. In this example, the area under the curve is 0.869 for network A (blue) and 0.894 for network B (orange), indicating that network B performs better overall. Note that network B has a higher true positive rate than network A for higher thresholds and worse for lower thresholds. This means network A may be preferable in screening programs, where it is better to catch as many people with disease as possible, even though on further testing a number are found not to have the disease. It is important to note that the sensitivity and specificity thresholds of commercial AI systems are not able to be changed by the clinician.
Explainability
Given the complex and opaque nature of AI systems, it can be difficult to understand how a decision was made, leading to a situation where the clinician is faced with a diagnostic dilemma of accepting or rejecting the AI recommendation with little comparative data. This can be problematic when decisions have the potential to affect patient care.
Techniques have been developed that improve the explainability of AI systems by highlighting image regions which are most influential in the prediction of the AI. The most common approach is the generation of a colour-coded or intensity-graded ‘heatmap’, where the ‘hottest’ regions in the image are those that contributed most to the AI system output.Citation20 Whilst not providing all model parameters or detailing the inner workings, heatmaps provide a method to visually explain the areas of the image that contributed most to the decision made by the AI system.
Various techniques exist to generate these heatmaps. Occlusion-based explanationsCitation41 run the same image through the AI multiple times, occluding or obscuring a different section of the image each time. By analysing how these occlusions affect the prediction, important regions of the image can be identified. The Grad-CAM techniqueCitation42 produces similar results using an efficient but complex process: by capturing error information from the last hidden layer containing image convolutions and tracing these values back to image pixels, regions with the biggest contribution to the final output can be highlighted.
It is important to note that AI systems may find salience in areas that may not be deemed salient by human clinical experts. It is useful for the clinician to consider disparities between regions they deem salient and those deemed important by the AI, as this may help to understand cases where the clinician disagrees with the output. Just because human experts may not recognise an area to be salient does not necessarily relegate this to a flaw in the system; it may be that the system is detecting features that human observers do not.
An example of this is the existence of AI systems that can determine the sex of the participant from a fundus photo.Citation43–45 Prior to these studies no anatomical retinal differences between the sexes were known. Differences in temporal artery morphology and red saturation of the retina, amongst other characteristics, are now understood.Citation43,Citation44
While explainability methods such as heatmaps are fundamental to understanding and trusting AI outputs, they are not available in all systems. A lack of incorporation of explainability, such as heatmaps, can erode trust in the system and limits opportunities for the clinician to understand those areas of the image that are most contributory to the classification.
Different AI systems may provide vastly different heatmaps despite producing similar outputs, suggesting that different features or regions are influencing the decisions made by the systems. For example, shows Grad-CAM heatmaps for two AI systems trained to detect referable diabetic retinopathy. The image depicts proliferative retinopathy with neovascularisation at the inferonasal aspect of the optic disc and multiple haemorrhages elsewhere. Both systems detect referrable retinopathy with 80 ± 2% accuracy, and both grade the image as referable with 73% confidence. Despite these similarities, the heatmaps suggest the two systems placed higher importance on different regions. While a single heatmap is relevant only to a single image analysis, repeated heatmap patterns can reveal insights into response patterns of an AI system. For example, if the top portion of the image is never highlighted it may suggest the algorithm is ignoring this area.
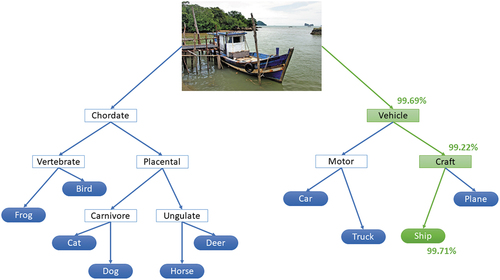
For image processing, heatmaps are the dominant method that is used for explainability. Other techniques are being developed but are not widely used as they require changes to the AI algorithm itself, potentially affecting performance. One example is neural-backed decision trees which use neural networks to separate inputs into categories represented in a decision tree,Citation46 as shown in . While remaining a black-box system, this method shows how objects are categorised using a multi-level approach. There are no limits to how many levels can be implemented. This could highlight where an AI shows high confidence in a broader category but low confidence when classifying a specific object, allowing results to be interpreted accordingly.
Figure 4. Neural-backed decision tree produced by the nbdt software available at (https://github.Com/alvinwan/neural-backed-decision-trees). This example categorises an image into one of ten categories used in the CIFAR-10 dataset.Citation47 The green path shows the branches calculated by the algorithm, with the confidence of each decision shown as a percentage. Image ‘Fishing boat Langkawi’ by Bernard Spragg is marked with CC0 1.0.
Caveats
Artificial intelligence is a powerful tool for clinical practice, provided that the limitations of the technology are acknowledged and understood. Arguably the most important factor is fitness for purpose. When using a system designed to detect diabetic retinopathy, the user cannot expect it to detect glaucoma, macular degeneration, or any other pathology. Such a system is blind to other conditions, with ocular emergencies such as retinal detachment being completely ignored. The system may also misclassify diseases with similar presentations; hypertensive retinopathy may be considered diabetic retinopathy if the AI was not specifically trained to detect this condition. This is especially important when such systems are used in screening programs or by clinicians not trained in the identification of these pathologies.
A known issue for healthcare in general is implicit bias,Citation48,Citation49 limiting patient-clinician relationships and resulting in poorer quality of care for some patients. As datasets used to train AI systems are often curated by expert clinicians, these biases may be introduced into these data and ‘learned’ by the AI.Citation50 For example, a clinician may subconsciously grade diabetic retinopathy in a heavily pigmented fundus as less severe than the same presentation in a lightly pigmented fundus. If these data are used in a training dataset, the AI will be ‘taught’ to misclassify heavily pigmented fundus images in the same manner. Similarly, if the clinician tends to overlook subtle lesions, then AI will do the same.
If there is insufficient clinical information to correctly classify an image, the dataset will contain erroneous data and impede the training process. Consequently, the ground truth may not always be true. Errors can be reduced by having ground truth labels created by multiple experts, more experienced experts, and by defining an adjudication procedure if there are differences in opinion.Citation51,Citation52
Ground truth errors aside, AI users need to consider the generalisability of the system to ensure applicability to the target population. For example, cup/disc ratio is a known risk factor for glaucoma,Citation53 and it has been reported that the Australian Aboriginal population have larger cup/disc ratios than Caucasians.Citation54,Citation55 A system trained with data from Caucasians may perform poorly for Aboriginal populations if cup/disc ratio, rather than optic nerve rim volume or some other parameter, is determined by the AI to be an associated feature. Where training data demographics are not available, such a system would need to be validated for the target population.
Assuming these concerns have been addressed, it must be noted that AI can only make predictions based on data that it is provided. For example, numerous factors can influence the glaucoma risk of a patient: optic disc parameters,Citation53,Citation56 intraocular pressure,Citation53 corneal thickness, visual fields,Citation53 retinal nerve fibre layer thickness,Citation57,Citation58 family history, comorbid obstructive sleep apnoea syndrome,Citation59,Citation60 and others. Clinicians will consider all of these data when making a diagnosis. AI may perform poorly in glaucoma detection if it is only provided a subset of these data. As a case in point, an AI system is unlikely to detect pre-perimetric glaucoma if it was trained with visual field data from advanced glaucoma with classic arcuate defects.
These limitations are likely to be noted in systems that have been subjected to peer review; however, commercial systems may use proprietary software which has not been subject to scrutiny from the scientific community, and training data may not be available. Such systems should be independently validated to verify system performance. Regulatory bodies oversee these systems when used as medical devices, which may reduce these concerns but does not completely resolve them. As an example, Tufail et al.Citation61 demonstrated how some USA Food and Drug Administration-approved systems for diabetic retinopathy screening performed worse than expected in some populations, with one flagging all disc-centred images as diseased.
Regulations
In many countries including Australia, software may require regulatory oversight when used in healthcare. The Australian Therapeutic Goods Administration defines software as a medical device if its intended use is:
Diagnosis, prevention, monitoring, prediction, prognosis or treatment of a disease, injury or disability
Compensation for an injury or disability
Investigation of the anatomy or of a physiological process
To control conception.Citation62
Software used for screening is also covered by this definition. Like other therapeutics, software as medical devices must be included in the Australian Register of Therapeutic Goods before they can be supplied in Australia. This is also true in many other countries. Devices are classified based on risk to individuals or public health, from Class I (lowest risk) to Class III (highest risk). Higher classifications attract more regulatory oversight and higher clinical standards.
Regulating software as medical devices is an evolving field with different countries applying their own regulatory requirements. Challenges include adaptive algorithms that continue to learn based on the real-world data to which they are exposed. These systems differ from their inspected state as soon as they are used, risking the introduction of errors or biases. Such systems require a total product lifecycle regulation methodCitation19 for managing quality, safety, and performance.
Artificial intelligence in optometry
Use in practice
AI-based systems have already been developed and approved for numerous medical fields, including in eyecare,Citation19 and this trend is set to continue. These systems should be viewed as clinical tools and not a substitute for thorough examinations and clinical judgement. Non-AI assistive technologies are already present in clinical equipment, such as colour coding seen on modern OCT printouts. Misdiagnoses and unnecessary referrals from ‘red’ or ‘green disease’ are well documented,Citation6 stemming from misuse or misunderstanding of these indicators. AI systems carry the same risks of misuse but can be valuable if used correctly. Clinicians should:
acknowledge the AI prediction;
check the input for errors that could lead to invalid results such as misalignment or clipping; and
verify the finding with further testing as appropriate, including heatmap assessment if available
No AI system is perfect, and erroneous results will be produced from time to time. Awareness of the limitations of a given system, including sensitivity and specificity metrics, is vital to the effective use of AI in the clinic. Such information, including device indications and limitations, are required to be included in product information available from regulatory bodies such as the Therapeutic Goods Administration (https://www.tga.gov.au) or the Food and Drug Administration (https://www.fda.gov).
Things to look for
Given the complexity of AI systems and use of computer science and mathematical jargon in the AI literature, deciding if AI could and should be used in a clinic can be challenging. A guide to interpreting AI literature has been produced by Ting et al.,Citation33 however commercial systems are unlikely to make the code or training data available for scrutiny, and the underlying technology is likely to be modified from the academic literature. The following steps can help appraise an AI system for clinical use.
Does the system have regulatory approval in your location? This includes prototypes used in clinical trials. Systems without current regulatory approval should not be used in clinical practice. Approved devices are listed on the websites of regulatory bodies such as the Australian Register of Therapeutic Goods (https://www.tga.gov.au/resources/artg) and the Food and Drug Administration (https://www.fda.gov).
What is the system designed to do? There can be a difference between what a system is intended to be used for and what you could potentially do with it. For example, a device designed to measure pupil size while determining contact lens parameters should not be used to screen for anisocoria. While off-label use of medical devices is a clinical decision, AI is engineered for a specific task and is unlikely to perform well outside this scope. Regulatory bodies such as the Australian Register of Therapeutic Goods (https://www.tga.gov.au/resources/artg) and the Food and Drug Administration (https://www.fda.gov) list the intended use(s) of all registered medical devices, including software.
How will the device be used in the clinic? The sensitivity and specificity of the system may impact how useful the device is to the practice. AI with a high sensitivity and low specificity may be excellent for screening but create too many false positives unless clinicians are prepared to overrule the AI recommendation. These data may be available from regulatory bodies such as the Therapeutic Goods Administration (https://www.tga.gov.au) or the Food and Drug Administration (https://www.fda.gov). Where these data are not available, contact the manufacturer for further information.
Is the target population represented in the test data? This is especially important if the device is to be used with minority groups. Where representation cannot be shown, results should be viewed cautiously until performance can be determined with the target group. These data may be available from regulatory bodies or from the manufacturer. If data cannot be obtained, clinicians should look for validation studies in the literature.
Does the system explain the outputs? This requirement depends on the cost and risk of erroneous findings and will vary from practice to practice. AI used to detect referrable diabetic retinopathy benefits from heatmap outputs () as the validity of the decision can be assessed by the clinician to avoid unnecessary referrals (‘red disease’). Conversely, AI may be used by dispensing staff in pre-test to assess suitability for contact lenses, where suitable patients are given a pamphlet to read in the waiting room. Explanations are less important in this case as the optometrist will need to undertake a full assessment before fitting, hence the cost and risk of an incorrect result is low.
The future
AI technology is in its infancy, and the systems can be extremely complex and computationally demanding, sometimes limiting their creation to those with specific training and access to expensive computing equipment. However, advances in AI and cloud-based computing have led to code-free deep learning, a technique for creating AI without writing code via a computer accessed remotely.Citation43,Citation52,Citation63 The performance of these systems is comparable to state-of-the-art AI,Citation63 allowing clinicians without computer science training to participate in clinical AI research.Citation52 While this has clear advantages, there are some notable drawbacks. A computer scientist trained in AI will be aware of, and work to mitigate, the limitations and pitfalls described above. This may not be the case for a novice in the field. The increasing availability of large, open datasets for AI research means some concerns relating to training data may be avoided,Citation52 yet others like ethnic diversity in training, test and validation data sets still require careful consideration.
Clinician-driven AI will allow clinicians to explore AI systems with the knowledge of exactly how these may be used in the clinic. There is a risk, however, of such bespoke systems being used in the clinic, as a medical device, without obtaining regulatory approval or external validation. Clinicians need to be aware that code-free deep learning is for research purposes only and should not be used for routine clinical care decision making.
In response to concerns about the use of AI in healthcare, the Food and Drug Administration has developed an action plan for artificial intelligence and machine learning-based software as a medical device.Citation64 This action plan seeks to improve transparency, ensure high standards of machine learning practices, and address concerns of bias. Future AI systems will be subject to ongoing performance monitoring due to their dynamic nature. This should lead to systems which are trusted by both the clinician and patient.
Conclusion
Artificial intelligence is a powerful tool for eye healthcare providers. The utility of AI stems from its complexity and it is important to understand the limitations arising from this. As with any assistive technology, misuse can lead to misdiagnosis and mismanagement. However, when used as designed, the technology presents new opportunities for earlier diagnosis and effective management. A well-designed and appropriately used AI system may detect subtleties which have been overlooked, or flag an area to re-examine. It is up to the clinician, not the computer, to make the final judgement.
A broad understanding of how AI works is helpful in appraising an AI system or interpreting results, however in-depth knowledge is not required. Using AI effectively in clinical practice requires the system to have regulatory approval, to be designed for the intended use, have appropriate sensitivity and specificity for the needs of the clinician, and be usable with the target population. Methods for explaining outputs such as heatmaps may also be beneficial. Off-label use of AI systems is not recommended as performance is likely to be poor.
Optometrists should embrace AI systems in clinical practice as an assistive tool and not an alternative to a comprehensive examination. Effective use of AI in optometry has the potential to improve accuracy and efficiency of many areas of optometric practice, benefiting both the clinician and the patient.
Disclosure statement
P van Wijngaarden is a co-founder of Enlighten Imaging, an early- stage medical technology company devoted to retinal imaging and image analysis. The other authors report there are no competing interests to declare.
References
- Rajpurohit DS, Seal R. Legal definition of artificial intelligence. Supremo Amic 2019; 10: 87–95.
- Wang C, Huang Q, Cheng M et al. Deep learning for camera autofocus. IEEE Trans Comput Imaging 2021; 7: 258–271. doi:10.1109/TCI.2021.3059497.
- Herrmann C, Bowen RS, Wadhwa N et al. Learning to autofocus. In: Proceedings of the IEEE/CVF Conference on Computer Vision and Pattern Recognition. 2020. p. 2230–2239.
- Sadda SR, Nittala MG, Taweebanjongsin W et al. Quantitative assessment of the severity of diabetic retinopathy. Am J Ophthalmol 2020; 218: 342–352. doi:10.1016/j.ajo.2020.05.021.
- Ting DSW, Pasquale LR, Peng L et al. Artificial intelligence and deep learning in ophthalmology. Br J Ophthalmol 2019; 103: 167–175. doi:10.1136/bjophthalmol-2018-313173.
- Bayer A, Akman A. Artifacts and anatomic variations in optical coherence tomography. Turkish J Ophthalmol/Turk Oftalmol Derg 2020; 50: 99–106. doi:10.4274/tjo.galenos.2019.78000.
- Charng J, Alam K, Swartz G et al. Deep learning: applications in retinal and optic nerve diseases. Clin Exp Optom 2022: 1–10. doi:10.1080/08164622.2022.2111201.
- Zhou Y, Yu K, Wang M et al. Speckle noise reduction for OCT images based on image style transfer and conditional GAN. IEEE J Biomed Heal Informatics 2022; 26: 139–150. doi:10.1109/JBHI.2021.3074852.
- Wang M, Zhu W, Yu K et al. Semi-supervised capsule cGAN for speckle noise reduction in retinal OCT images. IEEE Trans Med Imaging 2021; 40: 1168–1183. doi:10.1109/TMI.2020.3048975.
- Grath OM, Sarfraz MW, Gupta A et al. Clinical utility of artificial intelligence algorithms to enhance wide-field optical coherence tomography angiography images. J Imaging 2021; 7: 32. doi:10.3390/jimaging7020032.
- Liu Y, Carass A, He Y et al. Layer boundary evolution method for macular OCT layer segmentation. Biomed Opt Express 2019; 10: 1064–1080. doi:10.1364/BOE.10.001064.
- Gao K, Kong W, Niu S et al. Automatic retinal layer segmentation in SD-OCT images with CSC guided by spatial characteristics. Multimed Tools Appl 2020; 79: 4417–4428. doi:10.1007/s11042-019-7395-9.
- Cavichini M, An C, Bartsch DU et al. Artificial intelligence for automated overlay of fundus camera and scanning laser ophthalmoscope images. Transl Vis Sci Technol 2020; 9: 56. doi:10.1167/tvst.9.2.56.
- Wang Y, Yu X, Wu C. Optic disc detection based on fully convolutional neural network and structured matrix decomposition. Multimed Tools Appl an Int J 2022; 81: 1–21. doi:10.1007/s11042-022-12235-1.
- Yu X, Wang Y, Wang S et al. Fully convolutional network and visual saliency-based automatic optic disc detection in retinal fundus images. J Healthc Eng 2021; 2021: 3561134. doi:10.1155/2021/3561134.
- Huang Y, Zhong Z, Yuan J et al. Efficient and robust optic disc detection and fovea localization using region proposal network and cascaded network. Biomed Signal Process Control 2020; 60: 60. doi:10.1016/j.bspc.2020.101939.
- Raman R, Srinivasan S, Virmani S et al. Fundus photograph-based deep learning algorithms in detecting diabetic retinopathy. Eye (Lond) 2019; 33: 97–109. doi:10.1038/s41433-018-0269-y.
- Milea D, Najjar RP, Jiang Z et al. Artificial intelligence to detect papilledema from ocular fundus photographs. N Engl J Med 2020; 382: 1687–1695. Epub ahead of print 2020. doi:10.1056/nejmoa1917130.
- Benjamens S, Dhunnoo P, Meskó B. The state of artificial intelligence-based FDA-approved medical devices and algorithms: an online database. NPJ Digit Med 2020; 3: 118. doi:10.1038/s41746-020-00324-0.
- Ghassemi M, Oakden-Rayner L, Beam AL. The false hope of current approaches to explainable artificial intelligence in health care. Lancet Digit Heal 2021; 3: e745–750. doi:10.1016/S2589-7500(21)00208-9.
- Scheetz J, Rothschild P, McGuinness M et al. A survey of clinicians on the use of artificial intelligence in ophthalmology, dermatology, radiology and radiation oncology. Sci Rep 2021; 11: 5193. doi:10.1038/s41598-021-84698-5.
- Loyola-González O. Black-box vs. white-box: understanding their advantages and weaknesses from a practical point of view. IEEE Access 2019; 7: 154096–154113. doi:10.1109/ACCESS.2019.2949286.
- Wadden JJ. What kind of artificial intelligence should we want for use in healthcare decision-making applications? Can J Bioeth 2021 Jun 1; 4: 94–100. Epub ahead of print. doi:10.7202/1077636ar.
- Islam M, Ahmed M, Barua S et al. A systematic review of explainable artificial intelligence in terms of different application domains and tasks. Appl Sci 2022; 12: 1353. doi:10.3390/app12031353.
- Wang F, Kaushal R, Khullar D. Should health care demand interpretable artificial intelligence or accept ‘black box’ medicine? Ann Intern Med 2020; 172: 59–60. doi:10.7326/M19-2548.
- Lippmann R. An introduction to computing with neural nets. IEEE ASSP Mag 1987; 4: 4–22. doi:10.1109/MASSP.1987.1165576.
- Yang L, Song Q, Fan Z et al. Rethinking the activation function in lightweight network. Multimed Tools Appl an Int J 2022; 82: 1–17. doi:10.1007/s11042-022-13217-z.
- He K, Zhang X, Ren S et al. Deep residual learning for image recognition. In: 2016 IEEE Conference on Computer Vision and Pattern Recognition (CVPR). 2016. p. 770–778.
- Krizhevsky A, Hinton G. Learning multiple layers of features from tiny images. Toronto (ON), Canada: University of Toronto; 2009.
- Alexander D. Neural networks : history and applications. New York (NY/USA): Nova Science Publishers, Inc; 2020.
- Li G, Wang J, Shen H-W et al. CNNPruner: pruning convolutional neural networks with visual analytics. IEEE Trans Vis Comput Graph 2021; 27: 1364–1373. doi:10.1109/TVCG.2020.3030461.
- Fukushima K. Neocognitron: a self-organizing neural network model for a mechanism of pattern recognition unaffected by shift in position. Biol Cybern 1980; 36: 193–202. doi:10.1007/BF00344251.
- Ting D, Lee A, Wong TY. Artificial intelligence research in ophthalmology: guidance on understanding, appraising, and reading an article. Ophthalmology 2019 Sep 1; 126: 1475–1479. Epub ahead of print. doi:10.1016/j.ophtha.2019.09.014.
- LeCun Y, Boser B, Denker JS et al. Backpropagation applied to handwritten zip code recognition. Neural Comput 1989; 1: 541–551. doi:10.1162/neco.1989.1.4.541.
- Demšar J, Zupan B, Palagi PM. Hands-on training about overfitting. PLoS Comput Biol 2021; 17: e1008671. doi:10.1371/journal.pcbi.1008671.
- Nikolaienko T, Gurbych O, Druchok M. Complex machine learning model needs complex testing: examining predictability of molecular binding affinity by a graph neural network. J Comput Chem 2022; 43: 728–739. doi:10.1002/jcc.26831.
- Farag HH, Said LAA, Rizk MRM et al. Hyperparameters optimization for ResNet and Xception in the purpose of diagnosing COVID-19. J Intell Fuzzy Syst 2021; 41: 3555–3571. doi:10.3233/JIFS-210925.
- Szegedy C, Ioffe S, Vanhoucke V et al. Inception-v4, Inception-ResNet and the impact of residual connections on learning. In: Proceedings of the Thirty-First AAAI Conference on Artificial Intelligence. AAAI Press; 2017. p. 4278–4284.
- Szegedy C, Vanhoucke V, Ioffe S et al. Rethinking the inception architecture for computer vision. In: 2016 IEEE Conference on Computer Vision and Pattern Recognition (CVPR), Computer Vision and Pattern Recognition (CVPR), 2016 IEEE Conference on 2016. p. 2818–2826.
- Li T, Gao Y, Wang K et al. Diagnostic assessment of deep learning algorithms for diabetic retinopathy screening. Inf Sci (Ny) 2019; 501: 511–522. doi:10.1016/j.ins.2019.06.011.
- Zeiler MD, Fergus R. Visualizing and understanding convolutional networks. In: Fleet D, Pajdla T, and Schiele B et al., editors. Cham: Springer International Publishing; 2014. p. 818–833.
- Selvaraju RR, Cogswell M, Das A et al. Grad-CAM: visual explanations from deep networks via gradient-based localization. Int J Comput Vis 2020; 128: 336–359. doi:10.1007/s11263-019-01228-7.
- Korot E, Pontikos N, Liu X et al. Predicting sex from retinal fundus photographs using automated deep learning. Sci Rep 2021; 11: 10286. doi:10.1038/s41598-021-89743-x.
- Yamashita T, Terasaki H, Tanaka M et al. Factors in color fundus photographs that can be used by humans to determine sex of individuals. Transl Vis Sci Technol 2020 Jan 1; 9: 4. Epub ahead of print. doi:10.1167/tvst.9.2.4.
- Poplin R, Varadarajan AV, Blumer K et al. Prediction of cardiovascular risk factors from retinal fundus photographs via deep learning. Nat Biomed Eng 2018; 2: 158–164. doi:10.1038/s41551-018-0195-0.
- Wan A, Dunlap L, Ho D et al. NBDT: neural-backed decision tree. In: International Conference on Learning Representations. 2021. https://openreview.net/forum?id=mCLVeEpplNE.
- Krizhevsky A, Hinton G. Learning multiple layers of features from tiny images.
- Webster CS, Taylor S, Thomas C et al. Social bias, discrimination and inequity in healthcare: mechanisms, implications and recommendations. BJA Educ 2022; 22: 131–137. doi:10.1016/j.bjae.2021.11.011.
- Wilson BN, Murase JE, Sliwka D et al. Bridging racial differences in the clinical encounter: how implicit bias and stereotype threat contribute to health care disparities in the dermatology clinic. Int J Women’s Dermatology 2021; 7: 139–144. doi:10.1016/j.ijwd.2020.12.013.
- Kleinberg J, Ludwig J, Mullainathan S et al. Discrimination in the age of algorithms. J Leg Anal 2018; 10: 1–62. doi:10.1093/jla/laz001.
- Bradshaw TJ, Boellaard R, Dutta J et al. Nuclear medicine and artificial intelligence: best practices for algorithm development. J Nucl Med 2022; 63: 500 LP–510. doi:10.2967/jnumed.121.262567.
- Korot E, Gonçalves MB, Khan SM et al. Clinician-driven artificial intelligence in ophthalmology: resources enabling democratization. Curr Opin Ophthalmol 2021; 32: 445–451. doi:10.1097/ICU.0000000000000785.
- Gordon MO, Beiser JA, Brandt JD et al. The ocular hypertension treatment study: baseline factors that predict the onset of primary open-angle glaucoma. Arch Ophthalmol (Chicago, Ill 1960) 2002; 120: 714–720. doi:10.1001/archopht.120.6.714.
- Gerry P, Johnson K. Cup-to-disc ratios of aboriginal and non-aboriginal youths. Clin Exp Optom 2006; 89: 306–309. doi:10.1111/j.1444-0938.2006.00047.x.
- Landers JA, Henderson TR, Craig JE. Optic nerve head parameters of an indigenous population living within Central Australia. Clin Experiment Ophthalmol 2006; 34: 852–856. doi:10.1111/j.1442-9071.2006.01344.x.
- Chan HHL, Ong DN, Kong YXG et al. Glaucomatous optic neuropathy evaluation (GONE) project: the effect of monoscopic versus stereoscopic viewing conditions on optic nerve evaluation. Am J Ophthalmol 2014; 157: 936–944. doi:10.1016/j.ajo.2014.01.024.
- Vihanninjoki K, Burk ROW, Teesalu P et al. Optic disc biomorphometry with the Heidelberg retina tomograph at different reference levels. Acta Ophthalmol Scand 2002; 80: 47–53. doi:10.1034/j.1600-0420.2002.800110.x.
- Deshpande G, Gupta R, Bawankule P et al. Structural evaluation of preperimetric and perimetric glaucoma. Indian J Ophthalmol 2019; 67: 1843–1849. doi:10.4103/ijo.IJO_1955_18.
- Blumen Ohana E, Blumen MB, Bluwol E et al. Primary open angle glaucoma and snoring: prevalence of OSAS. Eur Ann Otorhinolaryngol Head Neck Dis 2010; 127: 159–164. doi:10.1016/j.anorl.2010.07.003.
- Khandgave TP, Puthran N, Ingole AB et al. The assessment of sleep apnoea as a risk factor in glaucoma. J Clin Diagnostic Res 2013; 7: 1391–1393. doi:10.7860/JCDR/2013/5383.3147.
- Tufail A, Rudisill C, Egan C et al. Automated diabetic retinopathy image assessment software: diagnostic accuracy and cost-effectiveness compared with human graders. Ophthalmology 2017; 124: 343–351. doi:10.1016/j.ophtha.2016.11.014.
- Therapeutic Goods Administration. How the TGA regulates software-based medical devices. 2021. https://www.tga.gov.au/sites/default/files/how-tga-regulates-software-based-medical-devices.pdf.
- Korot E, Guan Z, Ferraz D et al. Code-free deep learning for multi-modality medical image classification. Nat Mach Intell 2021; 3: 288–298. doi:10.1038/s42256-021-00305-2.
- Harvey HB, Gowda V. How the FDA regulates AI. Acad Radiol 2020; 27: 58–61. doi:10.1016/j.acra.2019.09.017.