
 ?Mathematical formulae have been encoded as MathML and are displayed in this HTML version using MathJax in order to improve their display. Uncheck the box to turn MathJax off. This feature requires Javascript. Click on a formula to zoom.
ABSTRACT
A Floatex density separator was used to reduce the silica and alumina contents of a low-grade iron ore plant reject sample from the Pilbara region in Western Australia to produce a high-quality iron ore concentrate suitable for use in sinter and pellet blends. From a −2.0 mm head sample containing 49.42 wt% Fe, 12.77 wt% SiO2 and 4.90 wt% Al2O3, a product of 56.66 wt% Fe (63.29 wt% Fe calcined) with 4.91 wt% SiO2 and 2.55 wt% Al2O3 was obtained with a mass recovery of 70%, an iron recovery of 80% and rejection of 72% silica and 58% alumina.
Introduction
Major changes in the nature of Australia’s iron ore product have taken place over the past two decades in parallel with the massive expansion of the iron ore industry. Iron ore types being exploited in Australia have now moved from the traditional premium-grade, hematite-rich Brockman ores to lower grade hematite-goethite and martite-goethite ores from deposits in the Marra Mamba formation, pisolitic ores from the channel iron deposits (CIDs), including the Yandicoogina ores and the mesas in the Robe Valley, and ores from detrital iron deposits (DIDs).
The lower-grade (<55 wt% Fe) iron ores typically have goethite as the dominant Fe-bearing mineral with varying amounts of gangue minerals such as quartz, complex aluminum silicates (e.g. kaolinite; Al2Si2O5(OH)4), aluminum oxides (e.g. gibbsite; Al(OH)3) and carbonates (e.g. siderite; FeCO3). With these low-grade, goethite-rich iron ores, a considerable quantity of iron ore fines rich in alumina and silica are generated during mining, handling, and processing operations due to the relatively low hardness of goethite compared with hematite. Current operating procedures of wet low-grade iron ore beneficiation plants result in a high loss of fines into rejects, posing environmental problems and concerns about efficient resource utilization through reducing, reusing, and recycling iron units. Furthermore, goethite also can be a significant carrier of impurities such as aluminum, silicon, and phosphorus (Clout and Manuel Citation2022; Klein and Hurlbut Citation1985; Pownceby et al. Citation2019). The utilization of these low-grade deposits has significant implications for the quality and performance of iron ore used in sintering and subsequent iron- and steelmaking processes.
The mineral processing industry has commonly utilized hydraulic separators for recovering various minerals throughout history. These separators are frequently referred to as hindered-bed, fluidized-bed or teeter-bed separators (Epstein Citation2005). The development of advanced design features and control measures for material feeding and product discharge has led to different designs for teeter-bed separators such as the Floatex density separator (Murthy and Basavaraj Citation2012; Nunna, Hapugoda, and Raynlyn Citation2015), the Allflux® separator (Clout Citation2013; Horn and Wellsted Citation2011) and the Reflux™ classifier (Amariei et al. Citation2014; Galvin et al. Citation2002, Citation2005; Hunter et al. Citation2016). Das and Sarkar (Citation2018) have described the operational principles of these units. Their technological advantages, operational simplicity, smaller footprint, and reduced labor requirements have led to the integration of these teeter-bed separators into flow sheets to classify and concentrate iron ore fines.
The Floatex density separator (FDS) is a teeter-bed separator in which an up-current classification technique can be used to upgrade low-grade iron ore fines and reject clay and silicate minerals. Hearn (Citation2002) discussed the application of teeter-bed technology for treating hematite fines in the −1 mm size range at the LKAB iron ore mine in Sweden. A FDS produced two products, a coarse underflow and an overflow of hematite fines that was sent to spirals after being deslimed. Umadevi et al. (Citation2021) have shown that a single FDS was more efficient than multiple spirals in removing silica and alumina from cyclone underflow products, while Sarkar et al. (Citation2008), Das et al. (Citation2009) and Raghukumar, Tripathy, and Mohanan (Citation2012) have used a FDS to remove silica and alumina from Indian iron ore fines.
In the present study, low-grade goethite iron ore fines from an iron ore project reject stream in the Pilbara region in Western Australia were processed with a FDS to demonstrate that high-quality iron ore material, suitable for use in sinter and pellet blends, can be produced from Australian low-grade fines. Results are presented from a piloting study to treat −2.0 mm size plant rejects/tailings to achieve the maximum possible iron grade and recovery.
Methodology
A low-grade iron ore plant reject sample from the Pilbara region in Western Australia was characterized mineralogically and chemically size-by-size and was processed in a single-stage FDS to maximize the rejection of alumina and silica content with minimal loss of iron content.
Feed material characterization
The head sample used in this work was a fine-grained, low-grade, iron ore tailing sample from the Pilbara region in Western Australia sourced using an online periodic time-controlled diverter sampler fixed in the tailings stream. A sub-sample was screened at 1.0 mm (to avoid plugging of the FDS underflow) and the −1.0 mm fraction was beneficiated with a FDS. Samples of the −2.0 mm head sample, screened fractions, and FDS products were dried and homogenized, using laboratory standard rotary splitters (16 and/or 12 bin) and Retsch 8-bottle rotary splitters to produce a representative sub-sample for chemical, mineralogical, and size-by-size analysis using X-ray Fluorescence (XRF) spectroscopy, optical mineralogy, and for electron beam-based analysis methods.
FDS lab-equipment description
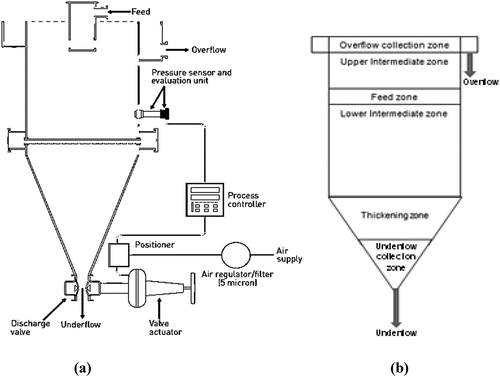
The experimental campaign was carried out using an FDS laboratory model (Model No. LPF-0230, supplied by Outotec for Floatex Separations Ltd), which had a 230 mm × 230 mm square cross-section, a 530 mm high tank with a 200 mm high inverted conical dewatering section at the lower end. The leading feed distributor, centrally located at the top of the tank, distributed material inside the tank at about 230 mm from the top. The feed slurry was introduced through this well.
The equipment can be divided into six main zones: overflow collection, upper-intermediate, feed, lower intermediate, thickening, and underflow collection zones. A schematic of the FDS and a diagram showing the zones of importance are presented in . The lower intermediate zone between the feed inlet and teeter water addition plays a key role in separating minerals. Heavier particles settle against a rising water current in this zone forming a bed that acts as an artificial heavy medium resulting in more resistance to the settling particles. Teeter water was introduced to the lower intermediate zone chamber to fluidize the bed through evenly spaced water distribution pipes, thus forming several small reaction chambers in the lower-intermediate zone. The combined effect of the teetering bed and the simplified rising water current distribution system of the FDS makes it possible to increase the separation efficiency while minimizing the possible misplacement of heavier minerals in the overflow stream (Murthy and Basavaraj Citation2012). Furthermore, the FDS was equipped with a pressure sensor mounted in the lower-intermediate zone above the teeter water port distribution pipes that was integrated with a process controller in a feedback loop with the discharge control valve. This instrumentation allowed a constant height for the teeter bed and a steady discharge from the underflow to be maintained.
Figure 1. FDS unit used in this work. (a) Schematic diagram and (b) zones of importance.
Selection of FDS experimental conditions
The key operating variables for a FDS are feed pulp density, teeter water flow rate, feed rate, and bed pressure. Based on a brief survey of operating plant requirements, a targeted feed pulp density of around 35 wt% solids was selected and the homogeneous suspension inside the separation zone of the tank that tends to a uniform bed density also was targeted to be at around 30 to 35 wt% solids. At a higher feed pulp density, the detrimental entrapment of lighter and finer particles by larger, heavier particles is likely to occur and they will report in the underflow stream.
Several preliminary tests were undertaken to adjust the feed rate, bed pressure, and teeter water flow rates to keep the bed fluidized whilst checking the overflow’s iron losses. It was observed that the interface between the feed zone and the lower intermediate zone (at bed levels 50–100 mm below the feed well distributor) played a critical controlling role by reducing turbulence where the material was being separated to avoid ore mineral misplacement in the overflow. Hence, maintaining a bed level sufficiently below the feed well distributor, and controlling the feed rate proved to be critical for effective separation. As well, maintaining fluidization with the teeter water additions was also crucial in achieving steady operation, and for a bed pressure range of 0.050 to 0.065 bar, a teeter flow rate of 6.0 L/min kept the bed in a teetered (fluidized) state. Feed rates of 600 to 750 kg/h were necessary to obtain reduced turbulence at the interface of the feed and in the lower intermediate zones. Accordingly, the experimental conditions for the pilot trial of the low-grade iron ore fines were chosen to be a teeter water flow rate of 6.0 L/min with a bed pressure of 0.055 bar and a feed rate of 715 kg/h at 36.0 wt% solids. The fluidized bed was maintained at 100 mm below the feed well.
Results and discussion
Feed material characterization
Assay data for the −2.0 mm head sample given in show it contained 49.42 wt% Fe, 12.77 wt% SiO2, 4.90 wt% Al2O3 with a loss on ignition (LOI) of 10.55 wt%. It had a P80 of 881 µm. Other components such as P, S, K2O, Na2O and Zn were within typical iron ore specifications. The sample was screened at 1.0 mm and the chemical analysis results for the two fractions also are given in . The −1.0 mm fraction used for the FDS test contained 48.66 wt% Fe, 13.61 wt% SiO2, 5.09 wt% Al2O3 with a LOI of 9.96 wt% and a P80 of 525 µm. The measured dry solid density of 3.59 g/cc indicated that a significant amount of gangue minerals was present and they were identified by mineralogical analysis. The size-by-size analysis data in indicates that more than 60 wt% of the sample was less than 212 µm in size. illustrates the trend in the iron, silica, and alumina contents of the size fractions. In the coarser size fractions, the levels of iron, silica, and alumina remained more or less uniform while the ultrafine fractions were lean in iron content and rich in silica and alumina. Beneficiation results for processing the −1.0 mm screen sample using the FDS are presented below in terms of the FDS separation efficiency and grade-recovery response.
Figure 2. Size-by-size distribution of Fe, SiO2 and Al2O3 in the FDS feed sample.
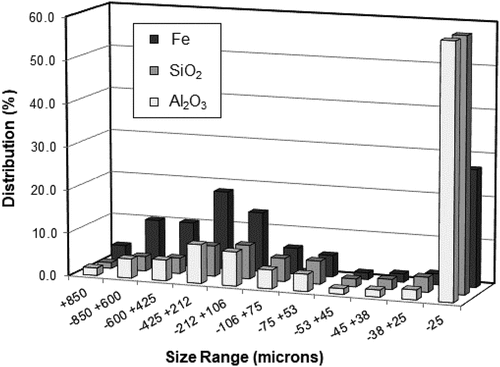
Table 1. Chemical analysis data (wt%) for the head sample and screen fractions.
Table 2. Size-by-size analyses of the FDS feed sample*.
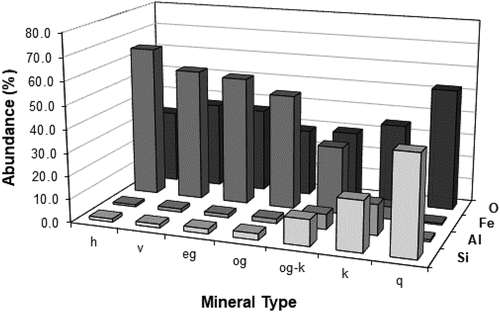
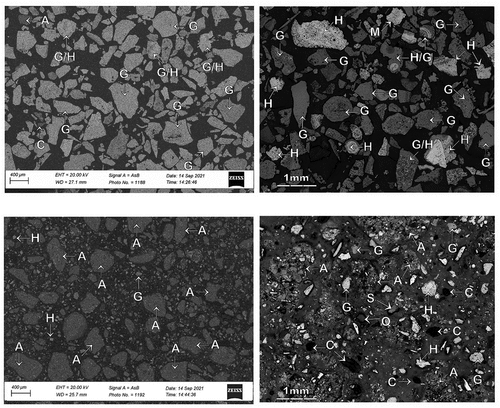
Optical microscopy and electron probe microanalyses (EPMA) were carried out on the −2.0 mm head sample to identify the minerals present and to determine their elemental compositions. A representative backscattered electron (BSE) image (, left) and an optical photomicrograph (, right) of the characteristic ore textures are shown in . The ore sample was characterized by a range of minerals including; hard, dense, and soft-medium porous hydrohematite (H); goethite (G) comprising hard, dense vitreous goethite, porous, medium-hard earthy goethite, soft-medium, porous ocherous goethite and ocherous goethite with kaolinite infill; kaolinite (C), minor fully liberated quartz (Q) and a few shale particles. Coarse sized combined hydrohematite/goethite particles (labeled as H/G in ) and agglomerates of clay/hydrohematite/goethite (labeled as A in ) were also common. These fine clay/goethite/hydrohematite agglomerates could have been generated during ore preparation or during the process of setting the sample in resin for polishing and optical observation. illustrates the elemental distribution in the minerals as determined from the electron microprobe mapping and quantitative analysis studies. It is evident from the results that minerals such as ocherous goethite with kaolinite infill, kaolinite and fully liberated quartz and shale particles contain high levels of alumina and silica and they can be expected to be in the finest size fraction (−25 µm) consistent with the analytical data in . Furthermore, observation of sized fractions with an optical microscope showed the degree of liberation of iron-bearing and gangue minerals to increase with decreasing size. Hence, the finest size fraction, although rich in alumina and silica, also contained significant iron, but at a comparatively lower level than in the coarser fractions due to the high presence of significant free kaolinite and goethite with kaolinite infill material in the −25 µm material.
Figure 3. BSE image (left) and optical photomicrograph (right) of the −2.0 mm head sample showing occurrence of typical ore minerals. H: hard, dense and soft-medium, porous hydrohematite, G: goethite – either as hard, dense vitreous goethite, porous, medium-hard earthy goethite, or soft-medium, porous ocherous goethite, A: clay/fine hydrohemetaite/goethite agglomerates, C: clay (kaolinite), S: shale, Q: quartz, H/G: combined hydrohematite/goethite.
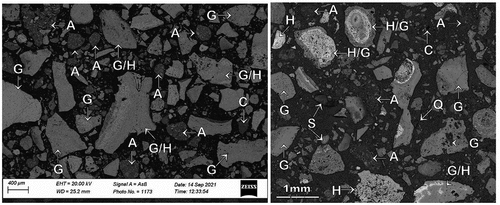
Figure 4. Elemental distributions by mineral type as determined by EPMA for the −2.0 mm head sample. h: hard, dense and soft-medium, porous hydrohematite, v: hard, dense vitreous goethite, eg: porous, medium-hard earthy goethite, og: soft-medium, porous ocherous goethite, og-k: ocherous goethite with kaolinite infill, k: kaolinite, q: quartz.
Efficiency of the FDS separation
In the FDS test, unclassified material collected initially was rejected until steady-state conditions at the set parameters were achieved and then product samples were collected and analyzed individually. The analytical results are summarized in .
Table 3. Chemical analysis data of the screen and FDS products.
The performance of separating equipment can be evaluated using imperfection (I) values (Wills and Napier-Munn Citation2006) which are calculated using the formula,
where dxc is the cut size at which x is the wt% recovered to the underflow. The lower the I value, the higher is the classification efficiency. In the pilot test, the values obtained were d75c = 74.3 µm, d50c = 60.1 µm and d25c = 52.4 µm giving an I value of 0.20. From this low experimental imperfection value it is evident that the FDS performance with respect to classification is efficient and near to the ideal efficient conditions for the case tested.
Characterization of FDS products
A qualitative mineralogical assessment of the FDS underflow and overflow products was carried using optical and SEM backscattered electron imaging. The chemistry of each phase was confirmed by EDS (energy dispersive spectrum) analysis using the SEM.
FDS underflow characterization
displays the SEM backscattered electron image (5a) and optical image (5b) for the FDS underflow material. The majority of the mineral phases observed in the sample were goethite (G) and hydrohematite (H) and combined goethite/hydrohematite (G/H) particles. Clay, shale, liberated quartz, or clay/goethite/hydrohematite agglomerates were virtually absent in the FDS underflow sample. It can be concluded that the FDS processing successfully separated clay, shale, and clay/goethite/hydrohematite agglomerates which were present in the feed sample.
Figure 5. Representative SEM backscattered electron (BSE) image (left) and optical photomicrograph (right) showing the typical occurrence of ore and gangue minerals of; (a,b) FDS underflow material and, (c,d) FDS overflow material. H: hard, dense and soft-medium, porous hydrohematite, goethite G: hard, dense vitreous goethite, porous, medium-hard earthy goethite, soft-medium, porous ocherous goethite, A: clay/fine hydrohematite/goethite agglomerates, C: clay (kaolinite), S: shale, Q: quartz, H/G: combined hydrohematite/goethite.
FDS overflow characterization
also displays the SEM backscattered electron image (5c) and optical image (5d) for the FDS overflow material. The majority of the mineral phases observed in the sample were combined goethite/hydrohematite (G/H) agglomerate particles, fine goethite (G), fine hydrohematite (H) and clay (C), shale (S), and liberated quartz (Q). This indicates that the FDS successfully separated clay, shale, and clay/goethite/hydrohematite agglomerates into the FDS overflow material.
FDS product grade and recovery
The experimental results presented in show that a FDS product (underflow) with a grade of 56.68 wt% Fe (a calcined grade of 63.26 wt% Fe) was achieved by rejecting deleterious gangue minerals while recovering around 60% of the feed weight with an iron recovery of 69% and rejection of 72% of the silica and 58% of the alumina (in the overflow). The calculated underflow pulp density was around 60 wt% solids, indicating that any fluctuations in feed rates, bed levels, and bed pressure had little effect on the underflow pulp density.
Implications for processing of low-grade iron ore fines from plant rejects
Given the increasing demands for sustainable beneficiation of iron ores, the need for more simplified, cost-effective technologies is becoming increasingly essential to recover iron units from plant rejected streams and tailings to minimize iron losses. In this work, the performance of the FDS for treating complex lower grade iron ores showed promising results achieving a good iron recovery and rejection of substantial quantities of deleterious minerals in a single-stage operation. The FDS fulfilled the performance requirements with separation efficiencies close to the ideal classification.
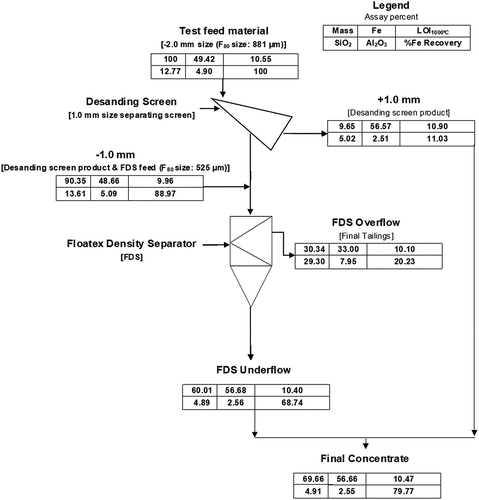
A simplified flowsheet for producing high-grade iron from processing a goethite rich low-grade iron ore plant rejects, and results for the pilot test, are given in . In the pilot test, the −2.0 mm head sample was first screened at −1.0 mm to prevent plugging of the underflow in the laboratory FDS. In practice, this would not be necessary and a combination of the +1.0 mm screen fraction and the FDS underflow would make up the total concentrate. Thus, overall in a single-stage FDS operation a total concentrate with a grade of 56.66 wt% Fe (63.29 wt% Fe calcined), 4.91 wt% SiO2, 2.55 wt% Al2O3 and a LOI of 10.47 wt% was achieved with an iron recovery of 80% in 70% of the feed weight. This corresponds to rejection of 72% of the silica and 58% of the alumina in the −2.0 mm head sample.
Figure 6. Simplified flowsheet and results for FDS processing of low-grade iron ore fines from plant rejects.
The size-by-size analysis for the FDS feed in indicates that an efficient cut at 25 µm would produce a high silica and alumina containing product. However, calculations using the data in indicate that an efficient cut at 25 µm on the −2.0 mm head sample would only remove 44% of the silica and 44% of the alumina and so would not be as efficient as the processing with the FDS.
A major challenge of the mining industry is the generation of large quantities of tailings and their management. Therefore, from an environmental point of view, processing circuits that separate waste and valuable minerals within the process and as an end-of-pipe technology should be considered. The application of a FDS in a circuit processing iron ore fines could contribute to this goal. Even though there are considerable advantages, the application of FDS to iron ores has yet to be implemented commercially in Australia, although Clout (Citation2013) has applied an Allflux up-current classifier in the desand configuration to process hydrocyclone underflow for subsequent feeding to spirals in an Australian operation.
Conclusions
Assessment of a FDS in the treatment of low-grade iron ore fines was made with particular reference to the rejection of silica and alumina bearing gangue. The FDS was easy to operate and control with fluctuations in feed rates and bed pressures absorbed by the unit while delivering consistent product in terms of size, grade, and pulp density. The FDS operated efficiently as a single stage separating system and a sharp partition curve was obtained yielding a low imperfection value of 0.20.
The FDS effectively classified near dense material and upgraded the complex lean-grade iron ore fines used as feed material. A total concentrate with an iron recovery of 80 wt% and a grade of 56.66 wt% Fe (63.29 wt% Fe calcined) was achieved.
Mineralogical observations with both optical and SEM microscopy confirmed that the majority of impurities such as clay, shale, and liberated quartz were separated from the feed material with a high percentage of impurities reporting in the FDS overflow while dense good quality minerals such as hydrohematite, goethite, and combined geothite/hydrohematite were in the FDS underflow material.
Acknowledgements
The financial support and encouragement of CSIRO Mineral Resources in setting up the beneficiation capability is gratefully acknowledged. The authors also wish to thank the Carbon Steel Materials Group staff at QCAT for their support during testing. Our colleague and friend Venkat Nunna passed away during the preparation of this paper. We at CSIRO acknowledge his significant efforts in adding to the knowledge base of low-grade iron ore beneficiation.
Disclosure statement
No potential conflict of interest was reported by the authors.
Additional information
Funding
References
- Amariei, D., D. Michaud, G. Paquet, and M. Lindsay. 2014. “The Use of a REFLUX Classifier for Iron Ores: Assessment of Fine Particles Recovery at Pilot Scale.” Minerals Engineering 62:66–73. doi:10.1016/j.mineng.2013.11.011.
- Clout, J. M. F. 2013. “Beneficiation of fine iron ores using the Desand Process.“ Proceedings Iron Ore 2013, Perth, August 12-14. Carlton: Australasian Institute of Mining and Metallurgy, 337–348.
- Clout, J. M. F., and J. R. Manuel. 2022. “Mineralogical, Chemical, and Physical Metallurgical Characteristics of Iron Ore.” In Iron Ore: Mineralogy, Processing and Environmental Sustainability, edited by L. Lu, 2nd ed, 59–107. Cambridge, MA: Woodhead Publishing (Elsevier). doi:10.1016/B978-0-12-820226-5.00012-4.
- Das, A., and B. Sarkar. 2018. “Advanced Gravity Concentration of Fine Particles: A Review.” Mineral Processing and Extractive Metallurgy Review.” 39 (6):359–94. doi:10.1080/08827508.2018.1433176.
- Das, A., B. Sarkar, P. Biswas, and S. Roy. 2009. “Performance Prediction of FLOATEX Density Separator in Processing Iron Ore Fines - A Relative Velocity Approach.” Mineral Processing and Extractive Metallurgy (Transactions of the Institutions of Mining and Metallurgy, Section C) 118 (2):78–84. doi:10.1179/174328509X383926.
- Epstein, N. 2005. “Teetering.” Powder Technology 151 (1–3):2–14. doi:10.1016/j.powtec.2004.11.026.
- Galvin, K. P., A. Cullen, J. Zhou, and E. Doroodchi. 2005. “Performance of the Reflux Classifier for Gravity Separation at Full Scale.” Minerals Engineering 18 (1):19–24. doi:10.1016/j.mineng.2004.05.023.
- Galvin, K. P., E. Doroodchi, A. M. Callen, N. Lambert, and S. J. Pratten. 2002. “Pilot Plant Trial of the Reflux Classifier.” Minerals Engineering 15 (1–2):19–25. doi:10.1016/S0892-6875(01)00193-5.
- Hearn, S. 2002. “The Use of Hindered Settlers to Improve Iron Ore Gravity Concentration Circuits.” In Mineral Processing Plant Design, Practice, and Control, edited by A. L. Mular, D. N. Halbe and D. J. Barratt, Vol. 1, 929–43. Littleton, CO: Society for Mining, Metallurgy and Exploration
- Horn, A., and M. Wellsted. 2011. “Innovative Beneficiation of Iron Ore Fines with ALLFLUX® Two-Stage Fluidised Bed Classifiers and GAUSTEC® Wet High Intensity Magnetic Separators.” Proceedings Iron Ore 2011, Perth, July 11-13. Carlton: Australasian Institute of Mining and Metallurgy, 437–443.
- Hunter, D. M., J. Zhou, S. M. Iveson, and K. P. Galvin. 2016. “Gravity Separation of Ultra-Fine Iron Ore in the REFLUX™ Classifier.” Mineral Processing and Extractive Metallurgy (Transactions of the Institutions of Mining and Metallurgy, Section C) 125 (3):126–31. doi:10.1080/03719553.2016.1155687.
- Klein, C., and C. S. Hurlbut. 1985. Manual of Mineralogy. New York: John Wiley and Sons.
- Murthy, N., and K. Basavaraj. 2012. “Assessing the Performance of a FLOATEX Density Separator for the Recovery of Iron from Low-Grade Australian Iron Ore Fines - A Case Study.” Proceedings XXVI International Mineral Processing Congress: IMPC 2012, International Mineral Processing Council, 3612–21. New Delhi.
- Nunna, V., S. Hapugoda, and T. Raynlyn. 2015. “Process amenability studies on goethite-abundant iron ore fines.“ Proceedings Iron Ore 2015, Perth, July 13-15, Carlton: Australasian Institute of Mining and Metallurgy, 165–174.
- Pownceby, M. I., S. Hapugoda, J. Manuel, N. A. S. Webster, and C. M. MacRae. 2019. “Characterisation of Phosphorus and Other Impurities in Goethite-Rich Iron Ores - Possible P Incorporation Mechanisms.” Minerals Engineering 143:106022. doi:10.1016/j.mineng.2019.106022.
- Raghukumar, C., S. K. Tripathy, and S. Mohanan. 2012. “Beneficiation of Indian High Alumina Iron Ore Fines — A Case Study.” International Journal of Mining Engineering and Mineral Processing 1 (2):94–100. doi:10.5923/j.mining.20120102.11.
- Sarkar, B., A. Das, S. Roy, and S. K. Rai. 2008. “In Depth Analysis of Alumina Removal from Iron Ore Fines Using Teetered Bed Gravity Separator.” Mineral Processing and Extractive Metallurgy (Transactions of the Institutions of Mining and Metallurgy, Section C) 117 (1):48–55. doi:10.1179/174328508X251851.
- Umadevi, T., A. Kumar, A. Umashanker, R. Sah, and K. Marutiram. 2021. “Performance Evaluation of a Laboratory FLOATEX Density Separator and its Comparison with a Spiral Concentrator.” Mineral Processing and Extractive Metallurgy 130 (2):118–25. doi:10.1080/25726641.2019.1591793.
- Wills, B. A., and T. J. Napier-Munn. 2006. Wills’ Mineral Processing Technology. 7th ed. Burlington, MA: Butterworth-Heinemann (Elsevier).