Abstract
This study uses an artificial intelligent model, a radial basis function neural network (RBF), to support radiography diagnosis of dental caries. One hundred and sixty radiography images of proximal faces of extracted human teeth were analyzed by 25 examiners, which diagnosed the presence or absence of dental caries. The same teeth were then subjected to optical microscope analysis, which allowed the verification of their actual conditions. Such information was classified as gold standards, and was employed to training a neural network to diagnose caries by means of radiography images. In order to verify the network's ability to diagnose new cases, data were organized in two subgroups: a training subgroup and a test subgroup. Receiver operating characteristics (ROC) curves allowed the comparison between diagnosis efficacy with or without the use of a neural network, showing that the adopted artificial intelligent model significantly improved diagnosis qualities.
The prevalence of dental caries has experienced a strong reduction over the last few decades, as well as alterations in the disease's aspect. Those changes are mainly due to the emphasis on the application of preventive measures, especially by the use of fluoride. As a consequence, dental caries are nowadays difficult to identify, which demands improvements of the diagnosis methods (Ie and Verdonschot, Citation1994; Pine and ten Bosch, Citation1996; ten Cate, Citation2001).
A number of diagnosis methods have been developed in order to support clinical exams. Conventional radiography or digital exams are the most frequently employed, and the contribution of bitewing radiography is widely recognized for caries diagnosis (Pine and ten Bosch, Citation1996). Among other methods mentioned in literature, are laser fluorescence (Angmar-Mansson and ten Bosch, Citation1993), fiber optic transillumination (FOTI) (Mialhe, Pereira, Pardi, and de Castro Meneghim, Citation2003), the electrical resistance test (Huysmans, Verdonschot, and Rondel, Citation1995), ultrasound images (Angmar-Mansson and ten Bosch, Citation1993), computerized tomography (Abreu, Tyndal, Ludlow, and Nortjé, Citation2002) and magnetic microresonance (Lloyd et al., Citation2000).
All the previously mentioned studies compare two or more of the different methods for diagnosing caries, and as a result, each of them leads to better results for a specific region of the tooth. In most of the cases, the association of two or more methods is necessary (Lussi, Citation1993) for an appropriate analysis.
Diagnosis techniques may be evaluated by means of Receiver operating characteristics (ROC) curves, which facilitate comparisons between different studies of various diagnosis methods. Fawcett (Citation2004) presents an excellent overview concerning ROC curves theory and applications.
Over the last few decades, mainly due to computational resources, mathematical models have disseminated in the health area, in particular methodologies based on neural networks, consisting of noninvasive complementary support for diagnosis. Brickley and Shepherd (Citation1997) make a detailed review about neural networks, emphasizing its possible applications in dentistry, as an aid to the interpretation of radiographies, in the assessment of cytological rubbings, for use in anesthesia monitoring systems among other innumerable possibilities. Brickley and Shepherd (Citation1997) affirm that, in addition to their importance to clinical dentistry, computer systems would also be useful in monitoring patients in a community and also aiding to train dentistry students. Some areas of dentistry in which an artificial intelligence system has already been used include the following: the area of diagnosis, with the application of a neural network to identify people at high risk of oral cancer (Banis, Turner, and Greener, Citation1994), in surgery; aiding in decision-making about the treatment of third molars (Brickley and Shepherd, Citation1997; Speight, Elliot, Downer, and Zakrewska, Citation1995; Brickley and Shepherd, Citation1996); and in periodontics (Brickley Shepherd, and Armstrong, Citation1998).
In the present study, a RBF neural network was trained to support radiography diagnosis of dental caries. Comparisons between the network and clinical analysis performed by examiners were made by means of the ROC curves.
ODONTOLOGICAL PROGRAM
For the radiography evaluation of dental caries, it used phantoms consisting of human natural teeth distributed in order to simulate the posterior part of a dental arch. An amount of two surfaces of 80 teeth presenting small proximal caries and no caries (sound teeth) were selected (40 premolar and 40 molar). The integrity of the occlusal face was also considered in the selection, and teeth with restorations or occlusal caries were excluded from the sample. The teeth were stored in a 0.1% timol solution after the extraction. Twenty canine teeth were employed in order to keep proximal contact. Each phantom was composed of five teeth: from canine to second molar. A total of 20 phantoms were obtained, from which 10 simulated the superior arch and the other 10 simulated the inferior arch. The teeth were fixed with industrial silicone, with no overlapping of the proximal faces, which could affect the quality of the evaluation. The superior and inferior phantoms were articulated and fixed laterally to standardize the teeth position and to facilitate the obtaining of the bitewing radiographs. Two bitewing radiographs were taken from each set: one of the premolar region and another one of the molar region.
The radiographs were obtained with the help of a Heliodent 60B X-ray unit (Sirona, Bensheim, Germany) with total equivalent filtration 2 mm of aluminum (0.5 mm of inherent filtration and aluminum filter of 1.5 mm of thickness), operating 0.5 s, 70 kVp, and 10 mA. Insight periapical films were used (Kodak Eastman Co., Rochester, NY). The focus-film distance was fixed in 40 cm with the help of a standard device that provided a perpendicular incidence of the central beam of radiation. This device had a reservoir for a layer of 2 cm of distilled water, placed between the X-ray source and objects, in order to simulate the attenuation of X-radiation for soft tissues. The films were processed manually by the temperature/time method (20°C/5 min). The solutions were Kodak GBX. This work was approved by the ethical committee in research at the Piracicaba Dental School – UNICAMP.
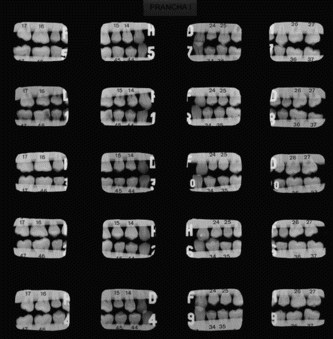
The phantom radiographs were mounted randomly in plates and evaluated by 25 examiners from different areas (radiology, operative dentistry, periodontology, pediatrics, and the general clinic), resulting in 4000 classifications: 25 examiners × 80 teeth × 2 surfaces per tooth. All of the examiners had at least 20 years of professional experience. Figure illustrates a typical plate of bitewing radiographs used by the examiners for caries diagnosis evaluations.
The radiographs were evaluated individually in a view box, which allows the use of 2 × increase lens. The examiners received the necessary orientation and would have to evaluate the images of the proximal faces of all the premolar and molar teeth, by choosing one of the following scores: (1) definitively sound face, (2) probably sound face, (3) questionable face, (4) probably carious face, and (5) definitively carious face.
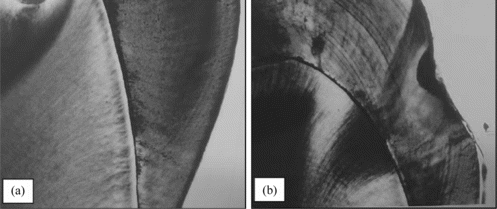
After the radiography exam, the teeth were stored in methacrylate 5% and sectioned in longitudinal cuts whose thickness varied between 70 and 100 µm in the proximal direction. These cuts were then subjected to microscopic analysis. The cuts were made with a hard tissue-cutting apparatus (South Bay Technology, San Clemente, USA) fitted with a diamond disk and under continuous cooling. Then the samples were mounted in slides using synthetic resin with xylol base (Entellan new, Merck, Darmstadt, Germany) for observation under an optical microscope (Carl Zeiss, New York, USA) and examined at a magnifications of 10 and 25 times by an experienced histologist. The actual tooth condition, named gold standard, was considered for the histological exam. Figure illustrates typical grayscale microscopic images of two sectioned teeth (actual analyzed microscopic images were in color) and Table presents a summary of gold standards for the 160 analyzed surfaces.
TABLE 1 Summary of Gold Standards for the Analyzed Surfaces: Number of Sound Proximal Surfaces, Surfaces with Enamel Caries, Caries in the Enamel-Dentine Junction, and Dentinal Caries
FIGURE 2 A typical microscopic evaluation of sectioned teeth (10 ×): (a) sound proximal surface; (b) carious proximal surface.
The distribution of the examiners' answers is shown in Table . Note that the answers in Table may be correct or incorrect, since it is the gold standard obtained by the histological exam, which correctly identifies the presence or absence of caries. The results of microscopic assessment presented in Table show that 86 proximal faces presented caries lesions and 74 were considered to be healthy.
TABLE 2 Examiners' Answers Distribution
THE RBF NEURAL NETWORK
From the set of 160 proximal faces, 49 (corresponding to 1225 of examiners' classifications) were randomly selected for training a neural network and 111 (corresponding to 2775 of examiners' classifications) were reserved for testing the trained network.
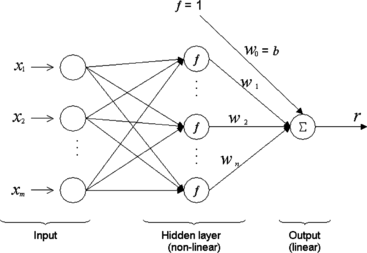
The used RBF network has three layers: the input layer, one hidden layer that applies a nonlinear transformation in the input vector, and a linear output layer. This kind of network classifies standards by transforming them to a high dimension space of nonlinear form and then separating them into classes of linear form. The justification for this method is found in the Cover's Theorem about classification: when a nonlinear transformation to a high dimension space is made, it increases the probability to make a linear separation.
Figure illustrates the used neural network, where x is a m-dimensional (m = 25) input vector, consisting of a set of 25 examiners' classifications from (1) to (5) for an analyzed tooth face; f represents the hidden layer of radial functions of neurons; and r is the output neuron, which contains a real number between 0 (zero) and 1 (one), used to evaluate the information: carious or sound face teeth. For the input of each neuron, the distance between the neuron center and the input vector is calculated. The RBF network output is formed by the summation of hidden layer outputs weighted by W n plus the bias W 0 = b = 2.0815 as shown in Figure . The chosen radial basis functions is the Gaussian bell function and the number of neurons at hidden layer n was established by trial and error, using as criterion the network performance to provide correct diagnoses, leading to n = 25.
DIAGNOSIS ANALYSIS BASED ON ROC CURVES
Caries diagnosis of the teeth faces may be classified into four categories, concerning their real conditions and the evaluated condition, as follows:
-
“True Positives”: carious teeth faces evaluated as carious;
-
“True Negatives”: not carious teeth faces evaluated as not carious;
-
“False Negative”: carious teeth faces evaluated as not carious;
-
“False Positive”: not carious teeth faces evaluated as carious.
Based on these diagnosis classifications, it is possible to define the parameters “sensitivity” and “specificity” as follows:
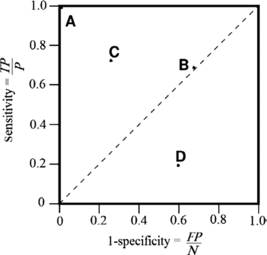
In Figure , point A represents the perfect diagnosis classification: 100% of probability of TP and 0% of FP. On the other hand, B point or any point placed on the diagonal line indicates a random performance in the classification (50% of TP and 50% of FP). Points C and D indicate that the diagnosis was supported by some information attached to the dentist competence, although in D point, it was not correctly used.
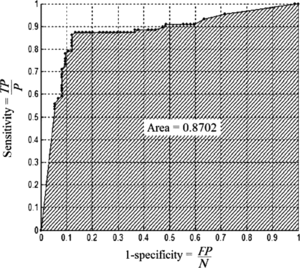
In general, a neural network used to support diagnosis produces a binary output. In the present work, this binary output is carious or not carious face teeth and this result is obtained by analyzing the output neuron. If a continuous threshold varying from 0 to 1 is defined in order to produce the binary classification for each threshold level, one has a point in the ROC curve. The same idea may be applied for the discrete diagnosis classifications of each dentist. In these cases the classification is an integer score from 1 to 5 and it is possible to define threshold levels varying from 1 to 5.
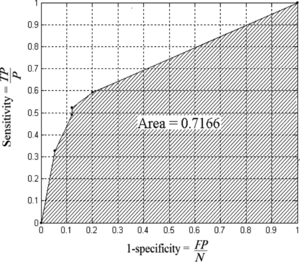
Figure shows the ROC curve obtained for the best examiner. The ROC curve areas vary from 0 to 1 and are frequently used in order to compare quality of diagnosis. The perfect diagnosis classification leads to an ROC curve area of 1 (one) and a completely wrong diagnosis classification has an ROC curve area of 0 (zero).
A neural network ROC curve was constructed for the classifications relative to the set of the 4000 classifications and it is presented in Figure , having an area of 0.8702.
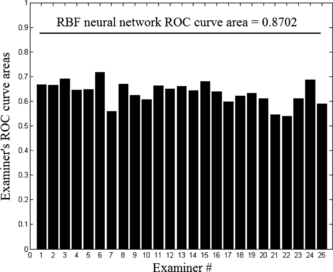
A set of 25 ROC curves (one ROC curve for each examiner) were carried out and their areas are presented in Figure , which also shows a reference horizontal line with the RBF ROC curve area. The mean of examiners' ROC curve areas was 0.6323, with a standard deviation of 0.045.
CONCLUSIONS
According to the difficulty in identifying alterations due to caries lesions, the application of more precise diagnosis methods is really advisable, both in the clinical and epidemiological spheres.
The interpretation of the results of the different diagnostic tests, as well as the treatment given to these results should also be optimized as an attempt to reduce the rate of false-positive and false-negative results, which lead to diagnostic errors, and consequently, wrong decisions about treatment. In the case of dental caries, a false-negative result leads to nontreatment of caries lesions, which are existent but not detected, while the false-positive answers are considered even more harmful, because they result in unnecessary interventions in healthy teeth.
In the present work, the mean area under the ROC curve resulted in 0.6323 for the classifications without the use of the network, and in 0.8702 for the classifications supported by the neural network, which provides a difference of 0.2379 percent points. It means that the amount of correct diagnosis increased by 37.62% when aided by the neural network. Even when considering the best examiner, whose ROC curve area was of 0.7166, the performance of the neural network is still considerably superior (+18%). These numbers correspond to a significant improvement in diagnostic ability when the neural network is used. Comparisons with other similar studies in literature are difficult to make, mainly because this is quite a recent methodology. At the moment, the use of neural networks is rather limited to the medical area, and very few studies have been developed in the dentistry sphere. In particular, up to this moment, no study was found in the literature concerning the clinical diagnosis of dental caries modelled by this method of forecasting events.
In the present study, another potential application of the neural network in dentistry was identified, and one concludes that the use of a suitable neural network may significantly improve the performance of diagnosing dental caries. It is important to notice that no mathematical model used up until now in the sense of optimizing dental caries diagnosis has shown itself to be sufficiently precise or complete, due to the biological complexity of this disease.
Clinical application of the presented work may be implemented using an internet web application. To this end, the group of 25 examiners has only to make similar classifications (from 1 to 5) concerning radiographies posted on the internet and after all 25 classifications, the already trained neural network is able to give a diagnosis.
DECLARATION OF INTEREST
We, Flávio de Souza Barbosa, Karina Lopes Devito, and Waldir Neme Felippe Filho, declare that we have no proprietary, financial, professional, or other personal interest of any nature or kind in any product, service and/or company that could be constructed as influencing the position presented in, or the review of, the manuscript entitled: Using a Neural Network for Supporting Radiographic Diagnosis of Dental Caries.
REFERENCES
- Abreu , M. , D. A. Tyndal , J. B. Ludlow , and C. J. Nortjé . 2002 . Influence of the number of basis images and projection array on caries detecton using tuned aerture computed tomography (TACT) . Dentomaxillofac Radiol 31 : 24 – 31 .
- Angmar-Mansson , B. and ten Bosch , J. J. 1993 . Advances in methods for diagnosing coronal caries – A review . Adv. Dent. Res. 7 : 70 – 79 .
- Banis , R. , D. W. Turner , E. H. Greener . 1994 . Comparison of statistical and neural network analysis of periodontal data . Northwest Dent. Res. 4 : 2 – 3 .
- Brickley , M. R. and J. P. Shepherd . 1996 . Performance of a neural network trained to make thirdmolar treatment-planning decisions . Med. Dec. Mak. 16 : 153 – 160 .
- Brickley , M. R. and J. P. Shepherd . 1997 . Comparisons of the abilities of a neural network and three consultant oral surgeons to make decisions about third molar removal . Br. Dent. J. 182 : 59 – 63 .
- Brickley , M. R. , J. P. Shepherd , and R. A. Armstrong . 1998 . Neural networks: a new technique for development of decision support systems in dentistry . J. Dent. 26 : 305 – 309 .
- Fawcett , T. 2004 . ROC Graphs: Notes and Practical Considerations for Researchers . The Netherlands : Kluwer Academic Publishers . (http://home.comcast.net/~tom.fawcett/public_html/papers/ ROC101.pdf)
- Huysmans , M. C. , E. H. Verdonschot , and P. Rondel . 1995 . Electrical conductance and electrode area on sound smooth enamel in extracted teeth . Caries Res. 29 : 88 – 93 .
- Ie , Y. L. and E. H. Verdonschot . 1994 . Performance of diagnostic systems in occlusal caries detection compared . Community Dent Oral Epidemiol 22 : 187 – 191 .
- Lloyd , C. H. , S. N. Scrimgeour , J. A. Chudek , G. Hunter , and R. L. MacKay . 2000 . Application of magnetic resonance microimaging to the study of dental caries . Caries Res. 34 : 53 – 58 .
- Lussi , A. 1993 . Comparison of different methods for the diagnosis of fissure caries without cavitation . Caries Res. 27 : 409 – 416 .
- Mialhe , F. L. , A. C. Pereira , V. Pardi , and M. de Castro Meneghim . 2003 . Comparison of three methods for detection of carious lesions in proximal surfaces versus direct visual examination after tooth separation . J. Clin. Pediatr. Dent. 28 : 59 – 62 .
- Pine , C. M. and J. J. ten Bosch . 1996 . Dynamics of and diagnostic methods for detecting small carious lesions . Caries Res. 30 : 381 – 388 .
- Speight , M. , J. Elliot , M. Downer , and J. Zakrewska . 1995 . The use of artificial intelligence to identify people at risk of oral cancer and pre-cancer . Br. Dent. J. 179 : 383 – 387 .
- ten Cate , J. M. 2001 . What dental diseases are we facing in the new millennium: Some aspects of the research agenda . Caries Res. 35 ( suppl. 1 ): 2 – 5 .
