
Abstract
In the past, the utilization of limb prostheses has improved the daily life of both amputees and patients with movement disorders. However, prior to achieving this improvement, a leg amputee must undertake a series of training sessions while wearing a limb prosthesis whereby the training results determine whether a patient will be able to use the limb prosthesis correctly in her/his daily life. Limb prostheses vendors therefore desire to offer the leg amputee a complete and well-organized training procedure, but they often fail to do so owing to factors related to limited human resource support and the financial constraints of the amputee. This work proposes a prosthesis training system that amputees can borrow or buy from the limb prostheses vendors to enable independent training at home. In this prosthesis training system, 3D positioning information is obtained via infrared LEDs. Four features are extracted and fed into a classifier to determine the actual conditions for the leg-amputee during training. Experimental results exhibited the effectiveness and practicality of the proposed prosthesis training system.
INTRODUCTION
Leg amputees who wear lower-limb prostheses suffer from attenuated tactile knowledge of their extension, owing to the natural sensory loss resulting from amputation. Many clinical studies report that amputees exhibit an asymmetrical gait pattern (Winter and Sienko Citation1988; Skinner and Effeney Citation1985; Bateni and Olney Citation2002). For example, unilateral transtibial amputees generally have higher hip extension, knee flexion, and ankle dorsiflexion on the amputated side compared to the unaffected side. Leg amputees tend to become accustomed to the asymmetrical gait pattern if a series of training sessions are not undertaken shortly after they begin wearing the limb prosthesis. Apart from general discomfort, amputees might also suffer because of repercussions from spinal deformities or muscle injury. Owing to a lack of exercise, muscular flaccidity might occur whereby the stumps will become swollen, resulting in the patient’s inability to swing his or her thighs backward or straighten the shank and knee joint properly. In light of this common problem, it is critical that an expert be present to assist the amputee during the training procedure to ensure that the amputee’s gait is correct, and to confirm that all benefits from the training experience are achieved.
It was reported in Orendurff et al. (Citation2006) that a microprocessor-controlled prosthetic knee can use on-board electronic sensors to collect real-time data while controlling stance and swing phase movements. The human-machine interface for the prosthesis socket has to be properly designed to achieve satisfactory load transmission, stability, and efficient control for mobility (Mak, Zhang, and Boone Citation2001). The powered ankle–foot prosthesis is capable of providing humanlike ankle work and power during stance and has a decreased metabolic transport cost compared to conventional passive-elastic prostheses (Au, Weber, and Herr Citation2009). Prosthetic legs outfitted with Bluetooth technology were designed in Umbehr (Citation2008) to allow two limbs to coordinate with each other as a means of effectively controlling leg movement. Despite a multitude of technical advances in lower-limb prostheses observed in the literature, there are no existing approaches that are able to warn the amputee of the asymmetrical gait. Bluetooth prosthesis (Umbehr Citation2008) can automatically control leg movement for the amputee, but the amputee might still experience discomfort and uncoordinated movement while walking. A well-designed gait training procedure for rehabilitation is, thus, in demand. In the recent positioning technology literature, Want and colleagues (Citation1992) use diffuse infrared to develop an active badge positioning system. Users wear badges that transmit infrared signals to provide information about their location to a centralized location service via a network of sensors. However, infrared signals have limitations related to straight-line movement, short transmission distance, and interruptions due to environmental disturbances.
It has been observed that some sequelae can arise in traditional gait training because of insufficiency in gait experts’ training or the relatively high training fee. Moreover, the evaluation of gait training effectiveness relies heavily on the accumulated experiences of gait trainers and does not require specific evaluation criteria to be followed. Accordingly, training records use many general statements that present difficulties when tracking the therapy process. To tackle these problems, several important factors are considered in this work, including setting up a quantitative index for assessing leg amputees’ training effectiveness, providing real-time guidance for independent training at home, establishing a mechanism for supervising and tracking the training procedure of leg amputees, offering easy installation, operation, and maintenance to leg amputees, and considering issues of affordability for mid- and low-income families.
A body area sensor network (BASN) is employed in this work. A BASN consists of multiple interconnected nodes on, near, or within a human body, which together provide sensing, processing, and communication capabilities. Through intelligent computing techniques, a BASN can be enabled to monitor environments, systems, and complex interactions for a range of applications, such as healthcare, fitness, and entertainment. An infrared LED system is adopted to locate the moving track of a patient wearing a limb prosthesis. Infrared detectors are used in a wide variety of applications, such as tire positioning, antitheft devices, and in a computer mouse. Seko et al. (Citation2004) used a large spherical aberration of lens methodology to capture the 3D position of an object via a LED light source built in an array panel by a video camera, but each array panel required at least six LEDs to position the object in 3D space. Funahashi, Fujiwara, and Koshimizu (Citation2009) utilized two systems, firefly capturing camera (FCC) and passive eye camera (PEC), required for 3D motion analysis, to construct the vision-based model of human behavior in the production process. However, this method required three charge-coupled device (CCD) cameras and one firefly capturing camera (FFC), which not only results in a high cost but also presents difficulties related to setup. Further, this method cannot be applied to aid in the training of leg amputees because it does not have a feedback message mechanism, and, thus, the patient cannot adjust the movement of his/her footsteps via this system.
Song, Choi, and Lee (Citation2008) have presented passive infrared motion sensors (PIR) to detect moving objects. Passive infrared motion sensors can detect the variation of infrared rays of moving people or objects. Although patients don’t need to wear any marks or sensors, this methodology is limited by the design of passive infrared motion sensors themselves. These sensors can detect only whole figures and some large objects and cannot focus on foot or slight body movement. In addition, the sensors are immovable and are therefore unable to detect the target when it moves out of the range of the sensors.
In terms of portability, Goulermas et al. (Citation2008) employed statistics to derive the required information and the required number of sensors to make the recording hardware portable. Their work allowed the footsteps-recording equipment to be portable in daily life and largely increased the quantity of usable information. The general regression neural networks (GRNN) with auxiliary similarity information (GASI) algorithm was used to obtain the measurement of the hip-knee-ankle angle to improve the algorithm and reduce the quantity of imported information. However, this research used 50 infrared LEDs as markers, and eight training sessions were required for users to learn how to use the equipment correctly. This system is not only costly, but the algorithm for recoding the process of movement is also complicated. The most important drawback is that this system is not able to demonstrate the walking status of users in real time.
Huang et al. (Citation2010) utilized radio-frequency identification (RFID) readers and tags to acquire the 3D positioning information of the amputee’s limbs in order to establish a BASN network for the prosthesis training system and to assist in diagnosing the amputee’s walking problem. Although the experimental results showed high recognition rate of gait patterns, the system requires about six hundreds of RFID tags. Besides, RF signals used in the system could be affected by the quality of an RF-tag and the surrounding environment. Instead, we installed the infrared LED and the receivers in the prosthesis to obtain a 3D positioning message in this study. The cost of tags was cut down from several hundred US dollars to less than one US dollar because only six LED tags were needed in this work. Two of out six infrared LED tags are installed on the normal leg to improve the detection accuracy of gait patterns. An embedded chip is used as a core to establish a body area network in the prosthesis training system. A gait pattern classifier is adopted to compare the current gait pattern of the amputee with a sample gait pattern recorded in the database. Proper feedback messages are then issued to the leg amputees in order to provide complete and effective gait training.
This article is organized as follows. The next section presents the proposed prosthesis training system. The experimental results follow, and the final section outlines conclusions drawn from this work.
ARCHITECTURE OF INTELLIGENT PROSTHESIS TRAINING SYSTEM
The structure of the proposed prosthesis training system is shown in . Six LED tags are installed on the limb prosthesis as shown in . The system continually receives data from LED tags attached to the railing on both sides of the leg-amputee during the gait training procedure. As illustrated in , the LED tag positioning module first positions the gait of the amputee based on real-time positioning information that the LED tags. The feature extraction module then records the angle variation of the thigh and knee of the leg amputee with respect to time and the trainee’s position. The classification module is responsible for determining the gait patterns based on the current gait record of the amputee, which is forwarded by the feature extraction module. Information attained from the classification results assists in diagnosing the likelihood of whether the amputee will have an accident during gait training. The feedback module determines whether the system should issue a real-time guidance message to the amputee to correct her/his gait based on the gait pattern classification result. It is important to note that the system will forward the amputee’s gait record to the experts if the gait pattern mismatches all the samples in the database, in order to obtain appropriate guidance messages for the new gait patterns. Detailed descriptions of the aforementioned four modules are given in the following section.
FIGURE 1 Architecture of the proposed prosthesis training system.
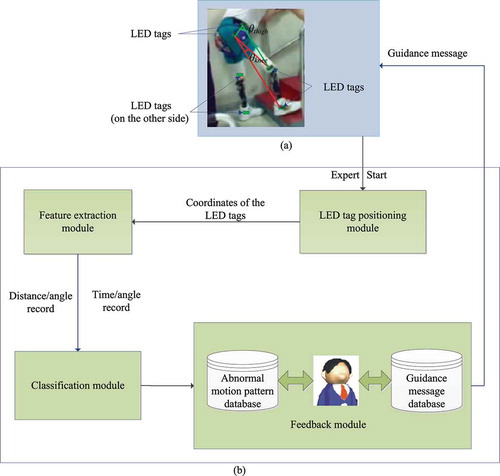
LED Tag Positioning Module
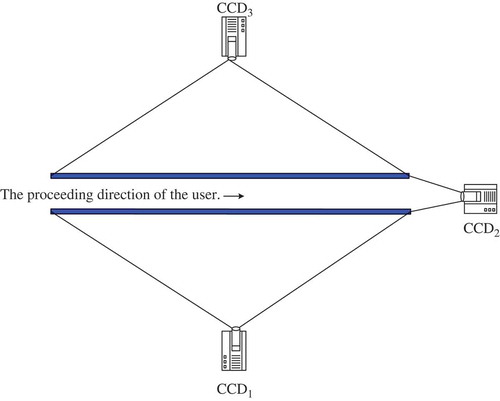
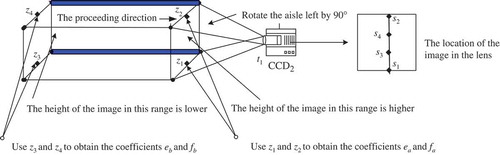
The proposed infrared (IR) gait trajectory detection approach utilized IR indoor location technology. The adjusted IR launched by the IR tag passes through the optical sensor to locate the specific position. It is well known that IR cannot penetrate obstacles and that the distance of transmission is relatively short. Therefore, we used a CCD camera, CCD1, as shown in , to record the trajectory of the user’s horizontal displacement, and a second CCD camera, CCD2, to record the trajectory of the user’s anterior–posterior displacement. Based on these two types of displacement tracks, a mapping function was used to ensure that the trajectory location in the lens corresponded with the user’s real location.
FIGURE 2 Diagram of the IR detectors.
The Location of Horizontal Displacement and Adjustment of Coefficients
As shown in , when the coverage of image in the lens is smaller than that of the real aisle, the images should be taken in wide angle. Accordingly, the proportion of the images in the lens differs from the lens’ curvature. The image becomes larger, closer to the central point and smaller, further from the central point. Before locating the user, we should adjust the proportion of the image in the lens to increase the accuracy in location positioning.
FIGURE 3 The difference of the image in the lens and the real aisle.
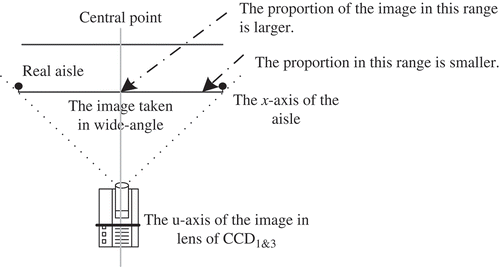
We first derive the relationship of the coordinates x on the aisle and the coordinates u in the lens by using a polynomial function. Because CCD1 might cause problems due to the curvature errors, the adjusted formula adopts a cubic equation to align central points of the aisle with those of lens. Notably, the coordinates x and u are both in the one-dimensional space, and the value x is proportional to the value u. Besides, the polynomial function is an odd function that is symmetric to the origin. Therefore, the constant and the squared term in the cubic equation can be neglected. The relationship between x and u can then be expressed as
The equation to calculate the two coefficients, a and b, is as follows:
Adjustment of Coefficients Due to Variation of the Width of Image
As shown in , the proceeding direction of the users is toward the CCD2. The width of the images in the lens varies because of the distance between the user and the lens. We thus have to adjust the width of the image in the lens to increase the accuracy of the location positioning.
FIGURE 4 Variation of the width of image in CCD2.
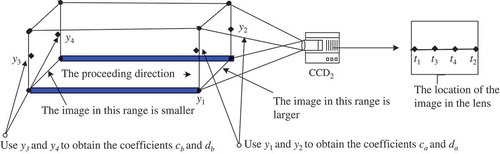
Similar to the approach taken, the relationship of the coordinate y on the aisle and the coordinate t in the lens can be established with a polynomial function. Notably, CCD2 will not easily cause nonlinearity errors because of the difference of the lens curvature. Therefore, a linear equation can be adopted to process the experimental data as follows:
Adjustment of Coefficients Due to Variation of the Height of Image
As shown in , the proceeding direction of the user is toward the CCD2. The height of the image in the lens varies due to the distance between the user and the lens. We thus have to adjust the height of the image in the lens to increase the accuracy of the location positioning.
FIGURE 5 Variation of the height of image in CCD2.
Similar to these approaches, the relationship of the coordinate z on the aisle and the coordinate s in the lens can be established. A linear equation is adopted to process the experimental data because it is not easy to cause nonlinearity errors in CCD2 because of the difference of the lens curvature. The linear equation can be expressed as follows,
The Mappings of Coordinates
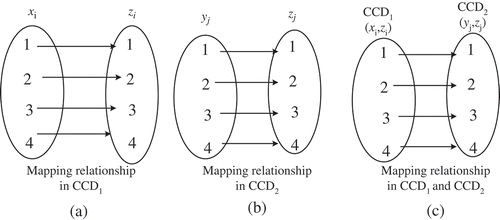
As shown in , we attach four LED tags on the limb prosthesis and number them 1 through 4. We use the location of each tag in the CCD1, which is also the location that corresponds in the real aisle, to find out the relationship between coordinates x and z, which are the coordinate locations in the CCD1, as shown in . We then use the location of each tag in the CCD2 to derive the relationship between the coordinates y and z, which are the coordinate locations in the CCD2, as shown in . A list of points (,
) in the CDD1 is then sorted with the coordinate z in ascending order. Next, we sort one more list of (
,
) in the CDD2 with the coordinate z in ascending order again. Accordingly, the mappings of the coordinates for the four tags on the prosthesis can be established as shown in .
FIGURE 6 Mappings of coordinates for four tags in the lens.
Feature Extraction Module
illustrates the relative position variation of the LED tags as the trainee moves forward during the leg-amputee’s gait training procedure. The angle variation of the leg amputee’s thigh and knee with respect to time and the trainee’s position is recorded for further processing by the training gait pattern classification module and by the evaluation metric computation module. The angle variation of the leg amputee’s thigh and knee can be derived by
FIGURE 7 Illustration of relative position variation of LED tags as the trainee moves forward.
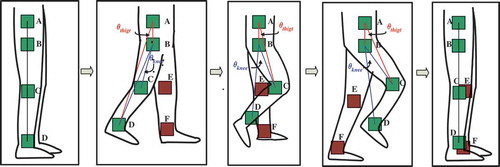
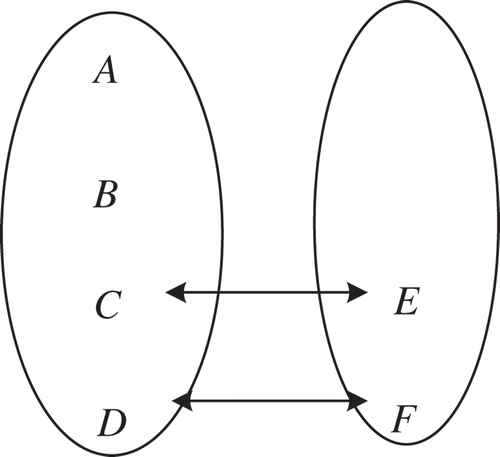
As shown in , the two lower LED tags, labeled C and D on the limb prosthesis, and another two, labeled E and F on the normal leg, form two line segments and
. We also record the lengths of
and
, and the included angles between the two vectors to assist in detecting abnormal gait patterns.
FIGURE 8 Illustration of the mappings of LED tags on two legs.
The vectors of and
can be expressed as follows:
Note that the range of values of is
. However, the two vectors should be nearly parallel in normal walking, and the value of
will be close to one. Thus, we can judge a patient’s prosthesis training situation by checking the lengths and angles of the two vectors.
Classification Module
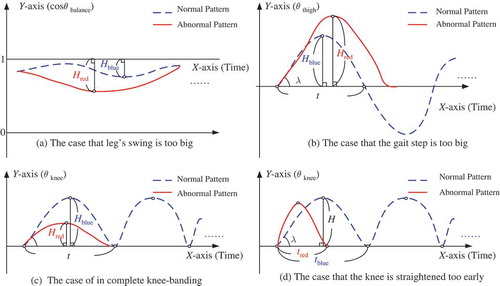
This module aims to classify the training tracks into different types of gait patterns. The red curves in give four examples of the abnormal gait records for ,
, and
. Notably,
and
can be used to derive the initial angle
, the length of perpendicular H, and the time consumption per step
. Take as an example, in which a larger initial angle
and smaller length of perpendicular H than normal is observed. Meanwhile, although the value of
is smaller, it implies that the amplitude of the leg’s swing is too wide. This situation occurs when the trainee walks too fast. During prosthesis training, the module receives a new gait record, which is subsequently recorded in the table, Record T, whereby we can then obtain three parameters to train the classification module. Decision tree and fuzzy lattice reasoning are the classification algorithms used in this study. These two algorithms were chosen because they are powerful and popular tools for classification and prediction, and because they utilize a rule induction approach, which allows for represented rules to be readily expressed and understood.
FIGURE 9 Examples for abnormal gait pattern classification.
Decision Tree
Decision tree (Huang et al. Citation2010; Hughes Citation1968; Breiman et al. Citation1984; Safavian and Landgrebe Citation1991) is a predictive mode, a mapping of observations about an item to draw conclusions about the item’s target value. Each interior node corresponds to a variable; an arc to a child represents a possible value of that variable. A leaf represents the predicted value of a target variable, given the values of the variables represented by the path from the root. There are several advantages gained from using a decision tree. For instance, it is simple to understand and interpret, it is able to handle nominal and categorical data, and it performs well with large datasets in a short time. In this work, we use a C4.5 decision tree to predict the abnormal gait patterns because it performs well in prediction applications, as reported in Zhu et al. (Citation2009).
A decision tree is a hierarchy of yes/no questions in which the specific questions asked depend on the answers given to the previous questions, with the branches spreading out from the original question until an appropriate response is given. Decision trees can be used to encapsulate the knowledge of an expert about a specific system. Various methods exist for the development of decision trees from datasets, with the goal of each method being to produce a structure that gives the highest degree of accuracy for the smallest tree design (Llora and Garrell Citation2001; Papagelis and Kalles Citation2001).
Decision tree learning is one of the most widely used and practical methods for inductive inference. It is a method for approximating discrete-valued functions that is robust to noisy data and capable of learning disjunctive expressions. One of the most widely used decision tree learning algorithms, C4.5, is employed in our study.
In the process of constructing the decision tree, the root node is first selected by evaluating each attribute using a statistical test to determine how well it alone classifies the training examples. The best attribute is selected and used to test the root node of the tree. A descendant of the root node is created for each possible value of this selected attribute, and the training examples are sorted to the appropriate descendant node. The entire process is then repeated using the training examples associated with each descendant node to select the best attribute to test at that point in the tree.
There are two frequently used metrics for attributes selection. One is the information gain, Gain(S, A) of an attribute A, relative to a collection of examples S,
The second metric commonly used for attributes selection is Gain Ratio,
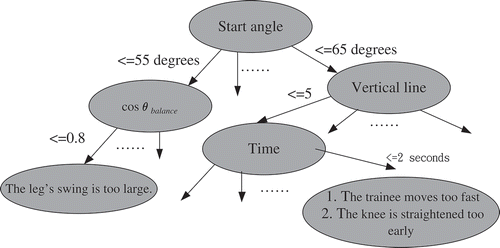
demonstrates an example of a decision tree constructed with three parameters, including the initial angle, the length of the perpendicular, and time consumption per step. The example shown in might occur as the trainee walks too fast or the movement of the prosthesis is exaggerated.
FIGURE 10 An example of building decision tree in this work.
Fuzzy Lattice Reasoning
Fuzzy lattice reasoning (FLR) was first introduced by Kaburlasos, Athanasiadis, and Mitkas (Citation2007) to monitor a physical problem of ambient ozone estimation. FLR can be divided into two process stages: training and testing. During the process of training, the classifier generates some hyperboxes based on testing information. One hyperbox corresponds with one rule to represent the point that locates the area; so the training effort is to train the data in the training database repeatedly to include new rules to calculate the fuzzy degree with every new rule and to present the rules and to decide whether to exist or combine with the current rules. To classify an unknown point, the system will calculate the inclusion degree with each rule and the unknown point to decide its classification.
Training Stage
The FLR classifier is a kind of leader-follower classifier, which learns fast in a single pass via the training data. Besides basic inputs, the only thing that can be adjusted in FLR is the size of the threshold, . Therefore, the main learning procedure is completed at this stage. The goal at this step is to establish the rules for the database and to introduce the rules to the directions where they should be guided and increase or modify the existing rules via adding a new training dataset. The training stage can be divided into two sections that are rule induction and generalization.
Rule induction:
This stage proceeds three tasks, including establishing rules for the database, inputting the rules, and deciding the rule via competition.
We first set up a rule for database RB that could be empty initially, which implies L = 0 in the following expression.
Next, we establish rules based on the training data and test if we can input them into our rules for database RB.
Step 1: Input antecedent rule
Step 2: Calculate the fuzzy degree k as follows:
Step 3: Compare and compete these degrees as follows,
Step 4: Compute
for
Step 5: If
The above five steps are repeated until we run out of training samples. The establishment of rules in RB is complete.
Generalization
After setting up the rules in RB, we’ll set the classification labels of the prosthetic conditions.
Step 1: Input antecedent rule
Step 2: Calculate their fuzzy degree
Step 3: Compare and compete these degrees among the rules in RB.
The winner of the rule is the one that most matches the prosthetic condition.
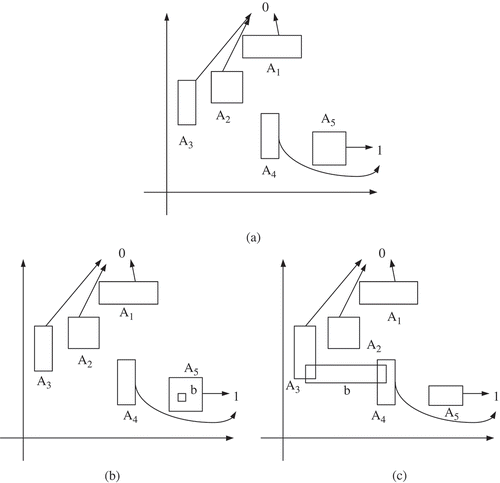
Testing Stage
After the testing stage, we can establish the RB and the training model. Then, we’ll arrive at classification stage. Let us take an example to demonstrate how the classifier operates. As shown in , assume that there are two prosthetic statuses, 0 and 1, and the set rules include and
. It can be observed from that
and
, we can determine easily that b falls into status 1. However, b does not completely belong to any rules, as shown in . We then have to compute the fuzzy degree of inclusion
and
to decide which prosthetic status b should belong to. If
, we obtain
and
. Thus, we can determine that b falls into status 1.
FIGURE 11 Explanations of FLR reasoning model in geometry.
Feedback Module
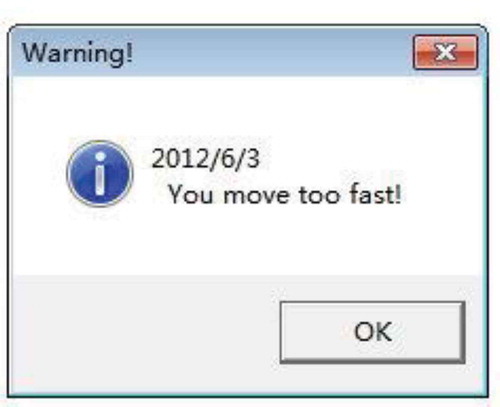
This module provides the trainees appropriate feedback messages by means of a rule-based expert system that includes both the trajectory pattern database and the feedback message database. Sample gait patterns are collected in the trajectory pattern database during gait training, and then the gait record of the amputee is compared with the sample gait patterns in the trajectory pattern database. Feedback messages can then be generated from the feedback message database throughout the trainee’s gait training session. For example, when the system detects that the trainee’s gait step is too large, the system will deliver a message, “Please slow down your movement”; this is a common message associated with beginners because they tend to be nervous. A message such as “Please don’t straighten your knees too early. You might get hurt!” will be sent if a well-trained user walks too fast. shows a screen shot of an example feedback message provided by the feedback module. If a new gait sample cannot be identified by the feedback module, it will be added to the feedback message database by an expert. Moreover, the expert can add appropriate feedback messages according to the trainees’ portfolio database.
FIGURE 12 A screen shot of a feedback message provided by the system.
EXPERIMENTAL RESULTS
Throughout the experiments conducted in this study, 27 types of gait patterns were identified by experienced experts who specialize in prosthesis training. During real gait training sessions, 912 gait training patterns were collected from the leg amputees, and these were then classified by an expert. The classification accuracy ratio was computed by using the leave one out cross validation (LOOCV) technique (Earl, Johnsonbaugh, and Jost Citation1996) to examine the effectiveness of the proposed training system. The LOOCV method removes a single sample in each trial, runs the model using the rest, and then tests the classifier using the removed single sample.
TABLE 1 Classification Results
The classification results are given in . It can be seen that, in average, the accuracy ratio of the proposed training system is 89.052%, the testing root mean square error (RMSE) is 0.084, and the value of kappa is 0.8677. It can be observed from that FLR achieves slightly better performance than decision tree. We also examine the measuring accuracy of three classification algorithms from RMSE. The smaller the value of RMSE, the larger the dependability of measurement is. From the statistics data, we can discover that errors of the two classification algorithms used in this study are very small. It implies that they have high accuracy in this experiment. Finally, we will consider the reliability of this measurement in kappa value. The two kappa values in the experiments are 0.8257 and 0.9097 and show good reliability for these measurements. Based on the provided analysis, we can infer that the proposed prosthesis training system not only detects the movements of leg amputees, but also classifies most of the gait patterns correctly.
The computation time comparison for the two classifiers is given in It can be seen that that the computation time required for FLR at both training and testing stages is slightly higher than that of decision trees. However, it can be acceptable for the amputees because the computation time is less than one second. These experimental results thus exhibit the effectiveness and practicality of the proposed prosthesis training system.
TABLE 2 Computation Time Comparison of Two Classifiers
CONCLUSIONS
A prosthesis training system to provide automatic and real-time guidance was proposed in this study. A so-called dissimilarity degree is defined in this work to diagnose abnormal gait patterns that the trainee might encounter. Instant and adaptive feedback messages that are useful for correcting walking postures are given by the prosthesis training system during the self-training process. An evaluation metric is presented in this work to assist in providing suitable messages to the trainees that are specific to their stage of training. A series of experiments were conducted in order to evaluate the performance of the proposed system. The experimental results revealed the effectiveness and practicality of proposed prosthesis training system.
Economic factors usually determine whether a leg amputee will undergo and complete sufficient gait training. The cost of the proposed system is affordable to trainees owing to the wide deployment and low cost of LEDs. In addition, new gait samples can be added to the database with the assistance of experts if a mismatch occurs between the training pattern and the samples recorded in the database. Therefore, the prosthesis training system proposed can greatly benefit the amputees because they can borrow or buy it from limb prosthesis vendors and train independently at home. Future work will focus on developing more advanced algorithms in order to improve the classification accuracy outlined in this study.
FUNDING
The authors would like to thank the National Science Council of the Republic of China, Taiwan for financially supporting this research under Contract No. NSC 102-2511-S-259-010-MY3.
REFERENCES
- Au, S. K., J. Weber, and H. Herr. 2009. Powered ankle–foot prosthesis improves walking metabolic economy. IEEE Transactions on Robotics 25 (1 ):51 –66.
- Bateni, H., and S. Olney. 2002. Kinematic and kinetic variations of below-knee amputee gait. Journal of Prosthetics and Orthotics 14 (1 ):2 –13.
- Breiman, L., J. H. Friedman, R. A. Olshen, and C. J. Stone. 1984. Classification and regression trees. New York, NY: Chapman and Hall/CRC.
- Earl, G., R. Johnsonbaugh, and S. Jost. 1996. Pattern recognition and image analysis. Upper Saddle River, NJ: Prentice Hall.
- Funahashi, T., T. Fujiwara, and H. Koshimizu. 2009. Vision-based modeling of human behavior in production process. Paper presented at HSI ‘09. 2nd Conference on Human System Interactions, 697 –700. Italy, May.
- Goulermas, J.-Y., A.-H. Findlow, C.-J. Nester, P. Liatsis, X.-J. Zeng, L.-P.-J. Kenney, P. Tresadern, S.-B. Thies, and D. Howard. 2008. An instance-based algorithm with auxiliary similarity information for the estimation of gait kinematics from wearable sensors. IEEE Transactions on Neural Networks 19 (9 ):1574 –1582.
- Huang, C. J., C. F. Lin, P. Y. Tsai, Y. W. Wang, C. Y. Li, H. M. Chen, and J. J. Liao. 2010. Body sensor network based prosthesis training system for leg-amputees. Paper presented at the 2010 IEEE International Conference on Industrial Engineering and Engineering Management, 1957 –1961. Macao, December.
- Hughes, G. 1968. On the mean accuracy of statistical pattern recognizers. IEEE Transactions on Information Theory 14 (1 ):55 –63.
- Kaburlasos,V.-G., I.-N. Athanasiadis, and P.-A. Mitkas. 2007. Fuzzy lattice reasoning (FLR) classifier and its application for ambient ozone estimation. International Journal of Approximate Reasoning 45 (1 ):152 –188.
- Llora, X., and J. M. Garrell. 2001. Evolution of decision trees. Paper presented at the Conference on Artificial Intelligence, 115 –122. Spain, October.
- Mak, A. F. T., M. Zhang, and D. A. Boone. 2001. State-of-the-art research in lower-limb prosthetic biomechanics—Socket interface. Journal of Rehabilitation Research and Development (38 ):161 –167.
- Orendurff, M. S., A. D. Segal, G. K. Klute, M. L. McDowell, J. A. Pecoraro, and J. M. Czerniecki. 2006. Gait efficiency using the c-leg. Journal of Rehabilitation Research and Development 43 (2 ):239 –246.
- Papagelis, A., and D. Kalles. 2001. Breeding decision trees using evolutionary techniques. Paper presented at the International Conference On Machine Learning, Williams College, Williamstown, MA, USA, June, 393–400.
- Quinlan, R. J. 1993. C4.5: Programs for machine learning. San Mateo, CA: Morgan Kaufmann.
- Safavian, S. P., and D. Landgrebe. 1991. A survey of decision tree classifier methodology. IEEE Transactions on Systems, Man, and Cybernetics 21 (3 ):660 –674.
- Seko,Y., H. Miyake, Y. Yamaguchi, and H. Hotta. 2004. Optical 3D sensing by a single camera with a lens of large spherical aberration. Paper presented at the Proceedings of the 2004 Intelligent Sensors, Sensor Networks and Information Processing Conference, 179 –182. Australia, December 14–17.
- Skinner, H. B., and D. J. Effeney. 1985. Gait analysis in amputees. American Journal of Physical Medicine and Rehabilitation 64:82 –89.
- Song, B., H. Choi, and H.-S. Lee. 2008. Surveillance tracking system using passive infrared motion sensors in wireless sensor network. Paper presented at the Proceedings of the International Conference on Information Networking, 1 –5. South Korea, December.
- Umbehr, J. 2008. Bluetooth: The next advancement for prosthetics. Internet Journal of Emerging Medical Technologies.
- Want, R., A. Hopper, V. Falcão, and J. Gibbons. 1992. The active badge location system. ACM Transactions on Information Systems 10 (1 ): 91 –102.
- Winter, D. A., and S. E. Sienko. 1988. Biomechanics of below-knee amputee gait. Journal of Biomechanics 21 (5 ):361 –367.
- Zhu, X., J. Wang, H. Yan, and S. Wu. 2009. Research and application of the improved algorithm C4.5 on decision tree. International Conference on Test and Measurement 2:184 –187.