
Abstract
Social network sites (SNS), as web-based services, allow users to make open or semiopen profiles within the systems they are part of, to see lists of other people in the group, and to see the relationships of people within different groups. As the development of Internet applications has matured, developing and evaluating business models on social network sites has become a critical issue because these sites can be an innovative source for online marketing. Most studies in Taiwan on the behavior or marketing on SNS focus on either advertising or marketing, without picturing the overall scenario. Thus, this study investigates SNS as a research subject, and explores users’ online and purchase behaviors in the cybercommunity. For this, the study uses the Apriori algorithm as an association rules approach, and cluster analysis for data mining, to categorize four kinds of online user behavior and generate purchase behavior patterns and rules. The results suggest that online users’ SNS and purchase behavior knowledge are critical for the development of online business models.
INTRODUCTION
Social network sites (SNS), as web-based services, allow users to make open or semi-open profiles within the systems they are part of, to see lists of other people in the group. The terminologies and structures of such communication networks differ among sites (Boyd and Ellison Citation2007; Litt Citation2013). Social networks refer to composites of large numbers of individuals in groups, as well as the interactions and relationships that exist among the groups and individuals (Iacobucci and Hopkins Citation1992; Khong, Onyemeh, and Alain Chong Citation2013). Marketers rely on social networks to spread marketing messages in both business-to-business (B2B; Mouzas Citation2006) and business-to-consumer (B2C; Brown and Reingen Citation1987) markets. Individuals in social networks act as business communication channels (Ryu and Han Citation2009; Lynch, Schwerha, and Johanson Citation2013) to disseminate and exchange information (Brown and Reingen Citation1987; Yu, Venkatraman, and Singh Citation2003). Social networks influence consumer behavior in various aspects, such as information-search strategies, decision-making processes, and consumption decisions (Flynn, Goldsmith, and Eastman Citation1996; Payr Citation2001; Huang and Kuo Citation2012). Therefore, social networks are an extremely important channel for virtual community marketing. Online society is a new community with a high degree of commonness and relevance. But relationships among people require certain keys and time to hold together, and in the online world, links that are only very weak among individuals can build a group (Tan and Thoen Citation2000). A business can choose to maintain an old relationship or choose to create a new relationship, a new group with its customers. However, in addition to sales promotions, enterprises should follow a broader business model development on SNS.
Recently, the emerging channel of social network marketing (SNM), such as Facebook, Twitter, Epinions, and Line, has attracted the attention of marketing practitioners and researchers. These sites not only permit users to express comments and opinions on products, people, organizations, and many other entities, but also enable users to build various social relationships. With these social relationships, opinions will have greater impact on users than those expressed on other channels (such as shopping websites) because people believe or more easily accept the opinions of those with whom they have social relationships (Xu et al. Citation2012; Kim Citation2013). In addition, the influence of opinions on SNM can be disseminated more widely and quickly than on other channels. Thus, some user opinions captured on SNM can greatly influence other users’ buying decisions or their views on certain companies.
Thus, many business entities have recently come to recognize this phenomenon, and some companies have begun to identify certain users of SNM for conducting online marketing and reputation management (Tsvetovatyy et al. Citation1997; Miller and Dickson Citation2001; Scharl, Dickinger, and Murphy Citation2005) in e-commerce and e-business. For companies to better utilize SNM for cost-effective, targeted marketing and reputation management, they must address two important questions: How to relate to the huge number of SNS users, given their limited budgets? Which users’ opinions will most influence others’ actions? If the most influential group of target users could be identified, companies could use minimal resources to improve product sales and enhance their reputations (Xu et al. Citation2012; Ma and Wang Citation2013; Redmond and Cunningham Citation2013; Okori and Obua Citation2013; Yan, Wu, and Tu Citation2013). According to a survey in Business Next Magazine (Lo Citation2012) 25% of the top 100 Taiwanese websites% are community-type sites (blogs, microblogs, networking sites, Internet forums, instant messaging, and Internet games, etc.) and account for the largest category. Wretch was the top site, with Facebook being second. The microblog “Plurk” first gained a good performance, winning the 23rd place. This indicates that there is space for the development of online activity patterns and online communities for further online marketing (Lo Citation2012).
In contrast to traditional direct marketing, SNM recognizes that links between consumers exist. With the gigantic databases of customer information available today, companies now are able to target their customers by taking into account their interrelatedness. Traditional marketing research does not reveal these social connections between consumers and thus cannot take advantage of links between customers. These interdependencies are measured through implicit links (e.g., matching on demographic attributes, geographic links, etc.), or through explicit links (e.g., communications between actors, family ties, etc.) (Hill, Provost, and Volinsky Citation2006). Although SNM offers clear advantages over the direct marketing business model, the use of social network information and knowledge in predicting consumer behavior is still a very recent issue (e.g., Hill, Provost, and Volinsky Citation2006; Manchanda, Xie, and Youn Citation2008; Benoit and Poel Citation2012).
In addition, among the new techniques developed for business intelligence, data mining is the process of discovering significant knowledge, such as patterns, associations, changes, anomalies and significant structures from the large amounts of data stored in databases, data warehouses, or other information repositories (Hui and Jha Citation2000; Keim et al. Citation2004; Cheng and Sun Citation2012; Liao, Chen, and Yang Citation2013). In the literature, there are many data mining models such as classification, estimation, predictive modeling, clustering/segmentation, affinity grouping or association rules, description and visualization, as well as sequential modeling. Similarly, there are also many application methods, including association rules, sequential patterns, grouping analysis, classification analysis, and probability heuristic analysis (Berson, Smith, and Thearling Citation1999; Mehta and Bhattacharyya Citation2004; Musaev Citation2004; Liao Citation2005; Liao, Chu, and Hsiao Citation2012; Winder et al. Citation2013). Knowledge of SNS users extracted through data mining can be investigated for business model and SNM knowledge derived from research and then provided to SNS businesses, thereby serving as a valuable reference for the building of their profit model.
This study investigates various Taiwanese user experiences on SNS. Their degrees of confidence were often demonstrated by word-of-mouth disseminations about the social network site. Further, this research looks at how the reputations of SNS proprietors and their affiliates were disseminated through relationship marketing for formulated SNM in its business model concerns. Based on these considerations, the purposes of this research can be simplified as follows: (1) to segment SNS users by their online community information utilization behaviors; (2) to explore different behaviors of SNS users, discovering their participation motivation as related to retention; (3) to explore different behaviors of SNS users, finding the relationships among the means of gaining information, the intention to purchase products, and the choice of purchasing channel; (4) to explore possible tools and methods for marketing approaches by the different SNS behavior segmentation; (5) to devise an effective service mechanism for developing an integrated SNM model.
The rest of this article is organized as follows. “Research Design” introduces the proposed system framework, system architecture, database development, and questionnaire design. “Data Mining” introduces the data mining approach, including the association rules and cluster analysis. “Data Mining Results” presents the data mining process and the analyzed results. “Managerial Implications” describes research findings and discusses the implications of and for management. Finally, a brief conclusion is presented.
RESEARCH DESIGN
Research Framework
The research framework in this study is shown in , where it delineates the outline of a questionnaire tracing the behaviors of SNS users when using the site’s interactive tools to share information. The questionnaire promoted the collection of data, which was later compiled into a comprehensive database for analyzing the utilization behaviors of SNS users. The researchers began by conducting an actual field study on the behaviors of SNS communities, from which preliminary and secondary data were collected. Specific database requirements were considered. The returned questionnaires collected data that embodied the architecture of the databases, and the constructed databases were used to categorize users by their behaviors as shown by the collected data. Apriori algorithm association rules were employed for analyses to investigate the analogy and disparity characterized by the inherent behaviors of SNS users. Based on this, proposed marketing strategies for the SNS community were developed.
FIGURE 1 Research framework.
System Architecture
The system architecture of this research is shown in , which comprises three distinct databases: Tool Utilization Behavior Database, Information Participation Database, and Consumer Preference Database. These three databases translated into the two features in the data market. These two features represented the Information Source and Purchased Items and the SNS Community Utility Operative Attitude. The data market was processed by data mining procedures to partition users, and association rules analysis yielded three knowledge components: defining the utility aspect of “Tool Value Knowledge Component”; defining the information impact aspect of “Effective Information Medium Knowledge Component”; and defining by the SNS community aspect of “SNS Community Attitude Knowledge Component.” These knowledge data components embodied the marketing map that facilitated the strategic concepts in the proposal for the operation of an appropriate social network community marketing campaign.
FIGURE 2 System architecture.
Database Design
The concept of relational databases was first developed in the 1970s by Codd to represent interrelated data in the form of a table (Codd Citation1970). It applied the concept of entity in business environments, where the data attributes between entities and their relationships were explored to interpret events that happened and messages that ensued. The term entity is used to describe an important object, event, or concept existing within a corporation for its ontological objectivity. Data attributes are used to describe entities’ characteristics. is the concept database for this research, which comprises the concept entity database (Entity-Relationship model, E-R model) that was derived from the integration of categorized attributes. The interrelationships among these attributes were explored by the formulated questionnaire that gave rise to seven entities, three existing relationships, and 67 attributes. In this study, the relational database contains 15 entities, 4 relationships, and 100 attributes. shows the conceptual databases and their E-R model.
FIGURE 3 Conceptual database (E-R Model).
Questionnaire Design and Data Mining Tool—SPSS Modeler
The databases for this research were constructed from results of a survey conducted under randomized sampling. The questionnaires used online distributions that reached relevant social network communities to explore various online behaviors of SNS users. There were six structural components in the questionnaire encompassing basic information of SNS users: participating motive for the SNS community, participating behavior in the SNS community, SNS promotion, online shopping preferences, SNS brand-support fan page, and group tracking. In addition, other issues investigated included sites for online shopping channels, purchased items, information-gathering behavior, and the degrees of acceptance for online channels.
In this research, the Statistical Package for the Social Sciences (SPSS) Modeler was employed as the data mining tool for analysis. The difference between SPSS Modeler and other software is that its data processing is through the use of nodes, which are then connected to form a stream frame. In addition, data visualization can be presented to users after the mining process has been completed. The nodes can be divided into six categories: the source node, record options node, field options node, graphs node, modeling node, and output node.
SPSS Modeler provides a different classification of clustering in the modeling node; the data analysis process and the main set of nodes are linked together, to complete the analysis of the data stream processing. Therefore, this study implements the Open Database Connectivity (ODBC) bridge, into Modeler data, in order to establish the analysis process, and employs the SPSS Modeler to analyze data using K-means clustering, followed by application of the Apriori algorithm on each cluster to analyze association rules. These data mining models and processes are summarized in .
FIGURE 4 Data mining model using SPSS Modeler.
DATA MINING
Association Rules
Discovering association rules is an important data mining problem (Agrawal, Imilienski, and Swami Citation1993), and there has been considerable research on using association rules for data mining problems. The association rules algorithm is used mainly to determine the relationships between items or features that occur synchronously in databases. For instance, during a trip to the shopping center, if the people who buy item buy item
as well, there exists a relationship between item
and item
. Such information is useful for decision makers. Therefore, the main purpose for implementing the association rules algorithm is to find synchronous relationships by analyzing random data and to use these relationships as a reference for decision making. The association rules are defined as follows (Wang et al. Citation2004):
Make the item set, in which each item represents a specific literal.
stands for a set of transactions in a database in which each transaction
represents an item set such that
. That is, each item set
is a nonempty subitem set of
. The association rules are an implication of the form
, where
and
. The rule
holds in the transaction set
according to two measurement standards—support and confidence. Support (denoted as_
) represents the rate of transactions in
containing the item set
. Support is used to evaluate the statistical importance of
, and the higher its value, the more important the transaction set
is. Therefore, the rule
which has support
represents the rate of transactions in
containing
. Each rule
also has another measuring standard called confidence (denoted as
), representing the rate of transactions in
that contain both
and
. That is,
.
In this case, denotes that if a transaction includes
, the chance that this transaction also contains
is relatively high. The measure of confidence is then used to evaluate the level of confidence about the association rules
. Given a set of transactions,
, the problem of mining association rules is used to generate all transaction rules that have certain levels of user-specified minimum support (called
) and confidence (called
) (Kouris, Makris, and Tsakalidis Citation2005). According to Agrawal and Shafer (Citation1996), the problem of mining association rules can be divided into two steps. The first step is to detect a large item set whose support is greater than
, and the second step is to generate association rules, using the large item set. Such rules must satisfy the following two conditions:
To explore association rules, many researchers use the Apriori algorithm (Agrawal, Imilienski, and Swami Citation1993). In order to reduce the possible biases incurred when using these measurement standards, the simplest way to judge the standard is to use the lift judgment. Lift is defined as: (Wang et al. Citation2004).
Clustering Analysis
The process of partitioning a large set of patterns into disjoint and homogeneous clusters is fundamental in knowledge acquisition. It is called clustering in most studies and it has been applied in various fields, including data mining, statistical data analysis, compression, and vector quantization. The k-means is a very popular algorithm and is one of the best for implementing the clustering process. K-means clustering proceeds in the following order. First, the K numbers of observations are randomly selected from all N number of observations according to the number of clusters, and these become centers of the initial clusters. Second, for each of the remaining N–K observations, the nearest cluster is found in terms of the Euclidean distance with respect to xi = (xi1, xi2, …; xip, …, xiP). After each observation is assigned to the nearest cluster, the center of the cluster is recomputed. Finally, after the allocation of all observations, the Euclidean distance between each observation and the cluster’s center point is calculated to confirm whether they have been allocated to the nearest cluster. In addition, several studies have discussed implementation of the k-means algorithm for cluster analysis as a data mining approach (Ture et al. Citation2005).
DATA MINING AND RESULTS
Subject Background
This study ran from January 10, 2012 to March 31, 2013. After deducting repeated respondents, there were 938 returned questionnaires. After deducting disqualified respondents because of incomplete answers or over-optional selection, there were 910 valid questionnaires. The effective response rate was 97.01%.
Female respondents accounted for 50.55%, very slightly more than males (49.45%). Youths aged 20 to 25 were the largest group, accounting for 47.47%. Most people’s education level was university, which accounted for 60.44%, and above postgraduate were 25.6%. The major occupation was that of “Student,” which accounted for 49.45%. Those with average monthly income of below NT 5,000 were 39.89% in total. Unmarried people were the majority at 70.55%, whereas 21.98% had fixed partners. Of the married people, most (93.96%) did not have a child.
Most respondents (58.46%) had surfed the Internet for more than nine years. Those who had surfed the Internet for between seven and nine years were the second, and these groups accounted for 80% of the database information in total. Their daily online surfing time was longer than three to five hours; only 17.17% surfed for fewer than three hours. Desktop computers were the most commonly used Internet tools, chosen by 71.1% of the respondents. The main places where they accessed Internet sites were from their homes (90.55%), and schools/offices, at 51.21%. The Internet was being used for recreational activity by 54.84% of the respondents, whereas 47.58% depended on the online world for information.
Clustering Analysis
Importing sample data into Clementine, this study uses the questionnaire data about participation behaviors in online communities as the clusters’ variables. Based on Konzinets’s (Citation1999) theory on types of members in a virtual community, members of the database are divided into four clusters by the Two-Step cluster algorithm. The data from four clusters is shown in , in which cluster 1 has 168 pieces of data, cluster 2 has 192, cluster 3 has 286, and cluster 4 has 264.
TABLE 1 Two-Step Cluster Analysis Data Table
According to , this study, based on community interaction and information exchange, divides the data into four clusters, which are, respectively, termed friendship type, information type, tool type, and gossip type. Community interaction means interaction with friends in online communities. Information exchange indicates the types of information received and the degree of sharing in online communities. The names and definitions of the clusters are shown in and presented as follows:
Friendship type is active in both community interaction and information exchange.
Information type is inactive in community interaction but active in information interactive. That means these members are not active in maintaining social relationships. Their targets are not friends but information owners/information demanders.
Tool type is inactive in both community interaction and information exchange. These members seldom ask help from unfamiliar people, but they seek help from family and friends in the online community if they are in need of information.
Gossip type is active in community interaction but inactive in interactive exchange. These members seldom publish information but only receive information on the mainstream issues. However, they exchange intelligence and discussion with friends, through messages.
TABLE 2 Cluster Analysis Named Table
Association Rule Analysis: Mining Data Online for Community Behavior
Purposes of Online Surfing and the Most Popular Operating Tool
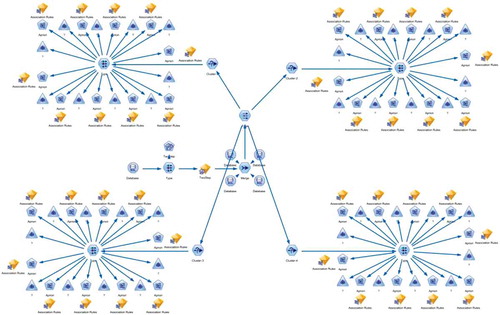
According to the purpose of online surfing, this section points out what network tools will be used for online retention and application. The most popular operating tool is the consequence, whereas, the purpose of the online surf is the antecedent; as a result, the association rule is induced. The association rules and spider diagrams are shown in , , , and .
TABLE 3 Friendship Type: Purpose of Online Surfing and Operating Tool(s) Used
TABLE 4 Information Type: Purpose for Online Surfing and Operating Tool Used
TABLE 5 Tool Type: Purpose of Online Surfing and Operating Tool Used
TABLE 6 Gossip Type: Purpose of Online Surfing and Operating Tool Used
Four clusters, within which the purpose for accessing the Internet and the corresponding tools are different, are found by cluster analysis. The friendship type makes the link to IM software for academic needs, entertainment, and social functions. The information type links with electronic bulletin boards for shopping, work/academic, and information needs. The tool type links with networking sites for academic needs and entertainment: it links with IM software for social functions, academic, and information needs; and it links with electronic bulletin boards for shopping. The gossip type links with the microblog for social functions, information, and academic needs; it makes the link with electronic bulletin boards for academic and information needs; and it links with IM software for shopping and academic needs.
The three clusters other than the information type link with IM software. The friendship type and the tool type use IM software for social functions. The information type link with electronic bulletin boards only to satisfy Internet needs. Except for the aspect of tool type, clusters two, three, and four will go to the Internet for shopping; the information type and the tool type link with electronic bulletin boards for shopping. The gossip type is the only cluster that links with IM software for shopping. Although network linkages of clusters are different, all of them go online for shopping.
Frequently Used Operating Tools and Retention Motivation
This section points out what network tools will be used to satisfy the needs of community participation and motivation. The frequently used operating tool is the consequence, and the retention motivation is the antecedent; as a result, the association rule is induced. The association rule and spider diagram are shown in to .
TABLE 7 Friendship Type: Frequently Used Operating Tools and Retention Motivation
TABLE 8 Information Type: Frequently Used Operation Tools and Retention Motivation
TABLE 9 Tool Type: Frequently Used Operating Tools and Retention Motivation
TABLE 10 Gossip Type: Frequently Used Operating Tools and Retention Motivation
This section verifies the cluster analysis in this study. The degrees of virtual community awareness and retention motivation are different. Relationship maintenance is the main purpose for which the friendship type uses IM software; however, the friendship type also connects with the electronic bulletin board for discussion of interests and for entertainment. Electronic bulletin boards are the network tools most frequently used by the information type for discussing interests and sharing information. Electronic bulletin boards are also the most frequently used network tool by the tool type, though the purposes of this type are for entertainment and information exchange. For the gossip type, IM software and electronic bulletin boards are the most frequently used network tools, because the main purpose for this type is interest discussion. In addition, the association antecedent is mixed with other tools, which means users have a habit of “cross-tooling,” using more than one network tool.
Retention Motivation and Sense of Virtual Community
The tool for virtual community awareness is the consequence, and the retention motivation is the antecedent; then, the association rule is induced. The association rules and spider diagrams are shown in to .
TABLE 11 Friendship Type: Retention Motivation and Sense of Virtual Community
TABLE 12 Information Type: Retention Motivation and Sense of Virtual Community
TABLE 13 Tool Type: Retention Motivation and Sense of Virtual Community
TABLE 14 Gossip Type: Retention Motivation and Sense of Virtual Community
This section verifies cluster analysis of this study. Although the degrees of virtual community awareness and retention motivation are different, all clusters endorse the community cohesion of networking sites. The main retention motivation is maintaining relationships; that is, no other tool is able to surpass or replace its social function. Relationship maintenance means members interact within an online community, which indicates that it is difficult for members of other communities to be accepted into it. There are different retention motivations for the friendship type and the gossip type, which link only with networking sites. Entertainment is one of the motivations for the friendship type to go on the Internet but not for the gossip type. That means the friendship type will enjoy other functions on the web, but the gossip type sees networking only as a contact tool. Therefore, only the gossip type shows retention motivation on IM software in the association rule.
In the association rule, only the tool type simultaneously uses networking sites and IM software as tools for the online community. Only the tool type and the information type use electronic bulletin boards as a tool for online community, but their purposes are not the same. This is because the information type derives a sense of belonging by information exchange whereas the tool type gets a sense of belonging by contact with others and information exchange. Accordingly, users in clusters have different attitudes (positive or negative) toward information exchange and community interaction.
Frequently Used Operating Tools and Virtual Community Awareness
This section considers retention situations and the relationship between network tools and community identification. The tool for the virtual community awareness is the consequence, and the most frequently used operating tool is the antecedent; and the induction of the association rule is derived. Another association rule is derived by exchanging the antecedent and the consequence for analyzing similarities and differences of attitude on SNS tools using about time and community awareness. The association rule and spider diagram are shown in .
TABLE 15 Frequently Used Operating Tools and Virtual Community Awareness
This section gathers tools that generate virtual community awareness and the frequently used operating tools to explore discussions of the association rule. The frequently used operating tool is consistent with its Internet purposes of retention motivation and virtual community awareness. No matter what purpose, motivation, and method are used, the tools are similar. Such tools will let users have virtual community awareness, which is presented in the association rule.
In addition to the electronic bulletin boards and IM software frequently presented in the association rule, three clusters obtain virtual community awareness from the microblogs, which are considered as the most frequently used network tools. This is important because microblogs seldom appear in other studies. Users who derived virtual community awareness from the microblogs will frequently connect with them, and even friends spread information obtained from the microblogs. This business strategy is not limited to the use of the microblogs, and other network tools presented in the association rule have such commercial potential.
The association rule reveals that the frequently used operating tools and the virtual community awareness are interrelated, which is especially clear in networking sites. This means that if users do not frequently use such tools, it is not easy to acquire virtual community awareness, and vice versa. Therefore, if an enterprise wants to run an online community effectively, the tool should be attractive to entice users and increase usage rate.
Reference and Behaviors of Purchasing
The relationship between the online activities of members in four clusters and the shopping behaviors are known. This section sets the preference for physical shopping channels and past online shopping as the consequence, and the source of shopping information is the antecedent. Then, inducing the association rule, the relationships between the source of shopping information and the shopping behaviors in physical/online channels are found. In addition, exchanging the consequence and the antecedent, this study finds the source of shopping information that members in four clusters use if they shop through these two shopping channels. The association rules and spider diagrams are shown in .
TABLE 16 Reference and Behaviors of Purchasing
The items of online shopping and the influence of information sources in the four clusters are similar. This means that there is almost no difference in the four clusters’ online shopping behaviors and information sources. The items shown in this study are goods usually bought online by the major online community users. Therefore, the information sources for these items are the most appropriate places for advertising.
From the association rules of behaviors on shopping and the information gained through physical and online channels, both the friendship type and the gossip type are interested in fashionable clothing or accessories. Their shopping intention is not fixed by channels. Even the information-gained channel is the same in both groups because the items that they buy from physical channels and from online channels are totally different. Therefore, this study shows that the shopping intention and shopping channel are not fixed by the information-gained channel.
The association rule of the influence of the information channel on shopping intention shows that users search for information about online shopping from many websites, not only from the online community. Because the main retention motivation of the online community is not to collect product information, users do not expect to obtain such information to meet shopping needs. The inference is shown as follows:
After obtaining merchandise information through the online community tools, which have community cohesion and give users a sense of belonging, users still choose physical shopping channels instead of the online channels. In this association rule, the weak influence of the online community tools’ information is shown.
After obtaining merchandise information through the online community tools, which have community cohesion and give users a sense of belonging, users might not buy the products immediately. They might ask for more information from other places (for example, advertising or other websites) for purchasing the products. So, they do not think that the information is gained from the online community tools.
The association rule of the shopping and information gained shows that Internet forums, electronic bulletin boards, and blog systems are more influential and valuable than the traditional online community tools. However, there is no association rule between shopping behaviors or source of information and popular networking sites or microblog. The following inference is shown:
The online community tools, which have community cohesion and give users a sense of belonging, focus on interpersonal communication, so their performance for commodity information delivery is inefficient.
The online community tools, which have community cohesion and give users a sense of belonging, have potential for the delivery information function on commodities, but there is room for improvement.
This study verifies the transmitting function and the influence of online community tools. For example, the blog system, electronic bulletin boards, or forums websites. However, the deciding power is in the users’ hands. What tools can do to improve transmitting is to create different marketing models in order to attract different groups.
MANAGERIAL IMPLICATIONS
Based on “Frequently Used Operating Tools and Virtual Community Awareness” in the previous section of the analysis, the marketing knowledge map of users’ behaviors in each cluster is drawn. For example, in , open circles show tools that are the frequently used operating tools, that let users stay on them, and that give users virtual community awareness. Solid circles represent the affected clusters, which are influenced by both retention period and the virtual community awareness, and arrows represent the direction of the impact. Based on the marketing map, this study proposes managerial implications as follows.
FIGURE 5 Marketing knowledge map: tool retention and the community identity.
Information Role of Members and Value of Application Tool
Because of the different information roles in each cluster, although users may have the same motivation or purpose, they choose different tools and application methods. For a certain cluster, only cross-functional tools used frequently offer users a sense of belonging in the communities, through in some situations a single tool does that application. shows the information of each cluster’s information role, favorite tools, and degree of community awareness. shows enterprises’ strategies for the community tools.
TABLE 17 Information Role of Members and Value of Application Tool
TABLE 18 Business Strategies on the Community Tools
SNS Community Identification of Tools
Virtual community awareness is created when users use some of the online community tools. This means that the online community cohesion is strengthened when users are more dependent on the tools. Thus, if enterprises want to promote products in the online communities, the tools in communities should be attractive and interactive in order to attract users’ attention and to communicate with them. For example, information in the online communities should be updated regularly to remain current and should be interactive to keep users’ attention.
Furthermore, users frequently use online community tools because of the association rule of virtual community awareness; users repeatedly use an online community tool and communicate with other members if they have virtual community awareness. If enterprises want to promote products in online communities, they should encourage users to have a sense of belonging to the communities. For example, privileges such as regular sales activities, merchandise discounts, public relations gifts, discussions, and experience sharing, honor the users and strengthen their sense of belonging. shows tools that create the virtual community awareness in each cluster and tools that are used by enterprises’ marketing in online communities.
TABLE 19 The Most Frequently Used Online Community Tools and Enterprises’ Operating Proposals
Information Influence and Media Use
From integrated analysis of , this study draws marketing knowledge maps of information sources and product items, such as and , to show the information channel that each cluster obtained. Hollow circles represent the way that each cluster attains the product information. Product items provided in this way are shown in the box. From the marketing map (), this study provides recommendations for marketing in online communities to enterprises in both physical and online channels.
FIGURE 6 Marketing knowledge maps of information sources and product items (for physical channels).
For enterprises in the physical channel, employing information only on available online channels is not sufficient for marketing operations in online communities. These firms should attract users to become members and encourage their feedback to support marketing in the online communities. Although users tend to buy products from the physical channels and collect related information on the Internet, enterprises should spread information actively to attract users.
FIGURE 7 Marketing knowledge maps of information sources and product items (for online channels).
For enterprises in the online channel, the online image is critical for users, and accurate product and channel information is vital for each cluster’s members. Therefore, enterprises should first present a full product introduction on the website, and then develop their own online community. In other words, enterprises should set business activities as the basis for accumulating trading experience in order to concretely build their own online community.
CONCLUSION
SNS communities are not only a single location, space or tool, but a network or society formed by links or relationships among online communities’ members. This study verifies that members from each cluster use not only online community tools but also cross-use tools. This means that a community is run not only by a single tool or in a single location but possibly through friends in other online communities. Cross-tool or cross-community use is the most valuable characteristic of online communities and why there are no barriers on the Internet.
The friendship type, the information type, the tool type, and the gossip type are four clusters that were divided by clustering analysis. These four clusters represent four behaviors and attitudes, which are friendship cohesion, external exchange, tools using, and information exchange. Because the research target is online communities’ users, the difficulty in products’ promotion of enterprises is unpredictable. These four clusters spread information accurately by dividing the work of creating, spreading, and operating information.
However, the sources of information might not be online communities, so if enterprises want to set online communities as the business model, there should be a detailed blueprint to build their brand image and strengthen customer loyalty. Direct sales results and online communities’ tools are not online community marketing. Therefore, the number of participants and times of login cannot be the standard to evaluate the efficiency of the online community marketing. Instead, the quantity and quality of discussion and the type and characteristics of information spread in the communities should be the criteria.
The marketing map shows that in addition to electronic bulletin boards, the sources for information on products are websites, relatives, and friends, and this reaffirms that more trusted information comes from people users are close to. Online communities are just platforms for users to have discussions, chat, and sharing. Therefore, when enterprises start online community marketing, they should have a professional website structure and accurate product information to gain users’ credibility and further give them a sense of belonging in the community.
Finally, the advantage of building an online community is not only to increase sales, but also for brand image, customer loyalty, and constant public marketing. The most significant advantage is for direct and all-round business management, so that if negative responses to the enterprise appear, the damage is reduced to a minimum. Because the Internet is used by many people, businesses must check their product and service quality for positive advertising effect in the online community marketing.
FUNDING
This research was funded by the Ministry of Science and Techonology, Taiwan, Republic of China, under contract No. MOST 103-2410-H-032-043-MY3.
Additional information
Funding
REFERENCES
- Agrawal, R., T. Imilienski, and A. Swami 1993. Mining association rules between sets of items in large databases. In Proceedings of the 1993 ACM SIGMOD international conference on management of data, 207–16. New York, NY: ACM.
- Agrawal, R., and J. Shafer. 1996. Parallel mining of association rules. IEEE Transactions on Knowledge and Data Engineering 8:962–69. doi:10.1109/69.553164.
- Benoit, D. F., and D. V. Poel. 2012. Improving customer retention in financial services using kinship network information. Expert Systems with Applications 39:11435–42. doi:10.1016/j.eswa.2012.04.016.
- Berson, A., S. Smith, and K. Thearling. 1999. Building data mining applications for CRM. New York, NY: McGraw-Hill Press.
- Boyd, D., and N. B. Ellison. 2007. Social network sites: Definition, history, and scholarship. Journal of Computer-Mediated Communication 13:210–30. doi:10.1111/j.1083-6101.2007.00393.x.
- Brown, J. J., and P. H. Reingen. 1987. Social ties and word-of-mouth referral behavior. Journal of Consumer Research 14:350–62.
- Cheng, L.-C., and L.-M. Sun. 2012. Exploring consumer adoption of new services by analyzing the behavior of 3G subscribers: An empirical case study. Electronic Commerce Research and Applications 11:89–100. doi:10.1016/j.elerap.2011.06.005.
- Codd, E. F. 1970. A relational model of data for large shared data banks. Communications of the ACM 13:377–87. doi:10.1145/362384.362685.
- Flynn, L. R., R. E. Goldsmith, and J. K. Eastman. 1996. Opinion leaders and opinion seekers: Two new measurement scales. Journal of the Academy of Marketing Science 24:137–47. doi:10.1177/0092070396242004.
- Hill, S., F. Provost, and C. Volinsky. 2006. Network-based marketing: Identifying likely adopters via consumer networks. Statistical Science 21:256–76. doi:10.1214/088342306000000222.
- Huang, Y.-F., and F.-Y. Kuo. 2012. How impulsivity affects consumer decision-making in e-commerce. Electronic Commerce Research and Applications 11:582–90. doi:10.1016/j.elerap.2012.09.004.
- Hui, S. C., and G. Jha. 2000. Data mining for customer service support. Information & Management 38:1–13. doi:10.1016/S0378-7206(00)00051-3.
- Iacobucci, D., and N. Hopkins. 1992. Modeling dyadic interactions and networks in marketing. Journal of Marketing Research 29:5–17.
- Keim, D. A., C. Pansea, M. Sipsa, and S. C. Northb. 2004. Pixel based visual data mining of geo-spatial data. Computers & Graphics 28:327–44. doi:10.1016/j.cag.2004.03.022.
- Khong, K. W., N. C. Onyemeh, and Y. L. Alain Chong. 2013. BSEM estimation of network effect and customer orientation empowerment on trust in social media and network environment. Expert Systems with Applications 40:4858–70. doi:10.1016/j.eswa.2013.02.020.
- Kim, D. 2013. Under what conditions will social commerce business models survive? Electronic Commerce Research and Applications 12:69–77. doi:10.1016/j.elerap.2012.12.002.
- Konzinets, R. V. 1999. E-Tribalized Marketing?: The Strategic Implications of Virtual Communities of Consumption. European Management Journal 17: 252–264.
- Kouris, I. N., C. H. Makris, and A. K. Tsakalidis. 2005. Using information retrieval techniques for supporting data mining. Data & Knowledge Engineering 52:353–83. doi:10.1016/S0169-023X(04)00127-2.
- Liao, S.-H. 2005. Expert system methodologies and applications—A decade review from 1995 to 2004. Expert Systems with Applications 28:93–103. doi:10.1016/j.eswa.2004.08.003.
- Liao, S.-H., Y.-J. Chen, and H.-W. Yang. 2013. Mining customer knowledge for channel and product segmentation. Applied Artificial Intelligence 27:635–55. doi:10.1080/08839514.2013.813195.
- Liao, S.-H., P.-H. Chu, and P.-Y. Hsiao. 2012. Data mining techniques and applications—A decade review from 2000 to 2011. Expert Systems with Applications 39:11303–11. doi:10.1016/j.eswa.2012.02.063.
- Litt, E. 2013. Understanding social network site users’ privacy tool use. Computers in Human Behavior 29:1649–56. doi:10.1016/j.chb.2013.01.049.
- Lo, J. Y. 2012. 2012 Taiwan top 100 website. Business Next Magazine, March, 190:42–45.
- Lynch, K. R., D. J. Schwerha, and G. A. Johanson. 2013. Development of a weighted heuristic for website evaluation for older adults. International Journal of Human-Computer Interaction 29:404–18. doi:10.1080/10447318.2012.715277.
- Ma, W., and M. Wang. 2013. Particle swarm optimization-based algorithm for bilevel joint pricing and lot-sizing decisions in a supply chain. Applied Artificial Intelligence 27:441–60. doi:10.1080/08839514.2013.805596.
- Manchanda, P., Y. Xie, and N. Youn. 2008. The role of targeted communication and contagion in product adoption. Marketing Science 27:961–76. doi:10.1287/mksc.1070.0354.
- Mehta, K., and S. Bhattacharyya. 2004. Adequacy of training data for evolutionary mining of trading rules. Decision Support Systems 37:461–74. doi:10.1016/S0167-9236(03)00091-5.
- Miller, T., and P. Dickson. 2001. On-line market research. International Journal of Electronic Commerce 5:139–67.
- Mouzas, S. 2006. Efficiency versus effectiveness in business networks. Journal of Business Research 59:1124–32. doi:10.1016/j.jbusres.2006.09.018.
- Musaev, A. A. 2004. Analytic information technologies in oil refinery. Expert Systems with Applications 26:81–85. doi:10.1016/S0957-4174(03)00109-X.
- Okori, W., and J. Obua. 2013. Contribution of prior knowledge to probabilistic prediction of famine. Applied Artificial Intelligence 27:913–23. doi:10.1080/08839514.2013.848750.
- Payr, S. 2001. The virtual other: Aspects of social interaction with synthetic characters. Applied Artificial Intelligence 15:493–519. doi:10.1080/088395101753199551.
- Redmond, U., and P. Cunningham. 2013. A temporal network analysis reveals the unprofitability of arbitrage in the prosper marketplace. Expert Systems with Applications 40:3715–21. doi:10.1016/j.eswa.2012.12.077.
- Ryu, G., and J. K. Han. 2009. Word-of-mouth transmission in settings with multiple opinions: The impact of other opinions on WOM likelihood and valence. Journal of Consumer Psychology 19:403–15. doi:10.1016/j.jcps.2009.04.003.
- Scharl, A., A. Dickinger, and J. Murphy. 2005. Diffusion and success factors of mobile marketing. Electronic Commerce Research and Applications 4:159–73. doi:10.1016/j.elerap.2004.10.006.
- Tan, Y.-H., and W. Thoen. 2000. An outline of a trust model for electronic commerce. Applied Artificial Intelligence 14:849–62. doi:10.1080/08839510050127588.
- Tsvetovatyy, M., M. Gini, B. Mobasher, Z. W. Ski, and W. Ski. 1997. Magma an agent based virtual market for electronic commerce. Applied Artificial Intelligence 11:501–23. doi:10.1080/088395197118046.
- Ture, M., I. Kurt, K. A. Turhan, and K. Ozdamar. 2005. Comparing classification techniques for predicting essential hypertension. Expert Systems with Applications 16:379–84.
- Wang, Y.-F., Y.-L. Chuang, M.-H. Hsu, and H.-C. Keh. 2004. A personalized recommender system for the cosmetic business. Expert Systems with Applications 26:427–34. doi:10.1016/j.eswa.2003.10.001.
- Winder, R., C. Haimson, J. Goldstein-Stewart, and J. Grossman. 2013. A model-based analysis of semiautomated data discovery and entry using automated content-extraction. International Journal of Human-Computer Interaction 29:629–46. doi:10.1080/10447318.2012.758528.
- Xu, K., X. Guo, J. Li, Y. K. Lau, and S. S. Y. Liao. 2012. Discovering target groups in social networking sites: An effective method for maximizing joint influential power. Electronic Commerce Research and Applications 11:318–34. doi:10.1016/j.elerap.2012.01.002.
- Yan, H.-S., Q. Wu, and X. Tu. 2013. A short-term forecasting model with inhibiting normal distribution noise of sale series. Applied Artificial Intelligence 27 (6):496–519. doi:10.1080/08839514.2013.805599.
- Yu, B., M. Venkatraman, and M. P. Singh. 2003. An adaptive social network for information access: Theoretical and experimental results. Applied Artificial Intelligence 17:21–38. doi:10.1080/713827056.