
Abstract
There exist problems of small samples and heteroscedastic noise in design time forecast. To solve them, support vector regression with probabilistic constraints (PC-SVR) is proposed in this article. The mean and variance functions are simultaneously constructed based on a heteroscedastic regression model. Probabilistic constraints are designed to make sure that for every sample, the forecast value is in a neighborhood of the target value with high probability. The optimization objective is formatted in the form of par-v-SVR. Prior knowledge about maximum completion time can be embedded in probabilistic constraints, and provides the size of the neighborhood of the target value. The results of application in injection mold design have confirmed the feasibility and validity of PC-SVR.
INTRODUCTION
Product design is a complex and dynamic process, and its duration is affected by a number of factors, most of which are of fuzzy, random, and uncertain characteristics. Because tasks of product design come from different companies, uncertain characteristics vary from product to product. Heteroscedasticity, thus, makes another important feature of product design. The mapping from the factors to design time is highly nonlinear, and it is impossible to describe the mapping relationship by definite mathematical models. And the reasonable degree of the supposed distribution of product design time is a key factor to the control and decision of product development (Cho and Eppinger Citation2005; Yan et al. Citation2010; Yang, Zhang, and Yao Citation2012).
Cho and Eppinger (Citation2005) chose the triangular probability distribution to represent design task durations and proposed a process-modeling and analysis technique for managing complex design projects using advanced simulation. However, if the assumed probability distribution of design activity durations does not match the true state, the proposed algorithm might fail to obtain ideal results. Yan et al. (Citation2010) came up with a time-computing model with its corresponding design activities in concurrent product development process. Yang, Zhang, and Yao (Citation2012) presented a model for better project planning and control, which can identify overlapping and risk for process improvement. But these algorithms require the accurate determination of normal design duration. Once the duration is incompatible with the actual, they might fail to function well. Apparently, the validity of predetermined design time is crucial to the planning and controlling of the product development process.
Traditionally, approximate design time is analyzed through qualitative approaches. With the development of computer and regression techniques, new forecast methods keep emerging. Bashir and Thomson (Citation2001) proposed a modified Norden’s model to estimate project duration in conjunction with the effort estimation model. Griffin (Citation1997) related the length of product development cycle time to the factors of project, process, and team structure through a statistical method and quantified the impact of project newness and complexity on the increasing development-cycle time. Nevertheless, he failed to develop an effective method for design time forecast. Jacome and Lapinskii (Citation1997) proposed a model to forecast efforts at electronic product design based on a structure and process decomposition approach. Only a small portion of time factors, however, are taken into account in the aforementioned models. Xu and Yan (Citation2006) came up with a design time forecast model based on fuzzy neural network, which exhibits good performance when the sample data are sufficient. Nevertheless, only a small number of design cases are available in companies, and this fact reduces the generalization performance of a fuzzy neural network. For this problem, a novel approach should be adopted.
Recently, the support vector machine (SVM) has been identified as one of the leading techniques for pattern classification and function approximation, and has also been successfully applied in various fields (Burges Citation1998; Chuang et al. Citation2002; Vapnik Citation1995; Schökopf et al. Citation2000; Andre, Beltrame, and Wainer Citation2013). With the introduction of -insensitive loss function, SVM, initially developed by Vapnik for pattern classification, have been extended in use to solve nonlinear regression problems.
-insensitive loss function contributes to the sparseness property of support vector regression (SVR). But the value of
, chosen as a prior, is difficult to determine. Schökopf et al. (Citation2000) introduced a new parameter
and proposed
-SVR, where
controls the number of support vectors and training errors;
-SVR has overcome the difficulty of
determination. Furthermore, by combining fuzzy theory with
-SVR, Yan and Xu (Citation2007) proposed F
-SVM to forecast the design time. F
-SVM can be used to solve regression problems with uncertain input variables.
However, -SVR and F
-SVM rely heavily on the assumption that the noise level is uniform throughout the domain, or at least, its functional dependency is known beforehand (Schökopf et al. Citation2000). Thereby, the product design time forecast based on F
-SVM is somehow deficient because heteroscedasticity cannot be ignored in the design time forecast. Hao (Citation2010) came up with par-
-SVR, extending the application of
-SVR to heteroscedastic regression. Experimental results have demonstrated the simplicity and effectiveness of par-
-SVR. In addition, SVMs with probability knowledge gain more robustness (Lee et al. Citation2005; Yang and Li Citation2009). Possibilistic support vector machines incorporate the geometric distribution of an input data set by associating each data point with a possibilistic membership, which measures the relative strength of the self class membership, and have better classification performance than conventional SVMs in various tests (Lee et al. Citation2005). Yang and Li (Citation2009) proposed a probabilistic support vector machine for classification of data with uncertainties.
In addition, incorporating prior knowledge into the regression model is one of the measures for improving the forecast performance (Mangasarian, Shavlik, and Wild Citation2004; Mangasarian and Wild Citation2007; Agarwal et al. Citation2011; Okori and Obua Citation2013). The so-called prior knowledge is obtainable information on the problem at hand, excluding the training examples. No “free lunch” theorem states the importance of incorporation of prior knowledge. For product designs driven by customer orders, there is some knowledge that can be explored in the process of the designs. Therefore, this study has set a simple knowledge that the orders must be completed before the specified dates in the orders. Timing also plays an important role in the stimulation of idea generation in design (Tseng et al. Citation2008). The duration from the start of a product design task to the specified date is called maximum completion time (MCT).
In the present study, to simultaneously consider heteroscedasticity and robustness for regression with uncertain input variables, probabilistic constraints are designed to ensure that the forecast value is in a neighborhood of the target value with high probability. The optimization objective function is formulated on the basis of par--SVR, and support vector regression with probabilistic constraints (PC-SVR) is proposed. Based on this model, a novel forecast method for product design time is put forward. Prior knowledge about MCT is used to determine the size of the neighborhood of the target value. The proposed PC-SVR is an effective approach to product design time forecast, and it is model-free because the underlying model function does not have to be assumed.
The rest of this article is organized as follows. “Overview of -SVR and par-
-SVR” gives brief details of
-SVR and par-
-SVR. “Support Vector Regression with Probabilistic Constraints” describes details of PC-SVR. “Experiments” presents the applications of PC-SVR. The final section draws the conclusions.
OVERVIEW OF v-SVR AND par-v-SVR
This section gives a brief overview of -SVR and par-
-SVR. For more specific details, please refer to Vapnik (Citation1995) and Hao (Citation2010).
Suppose a set of training samples is available, where
is an input and
is a target output, and the prime optimization problem of
-SVR is as follows:
However, -SVR relies on the assumption that the noise level is uniform throughout the domain, or at least, its functional dependency is known beforehand. This assumption limits the application of
-SVR, because in many regression problems the amount of noise may depend on location.
The proposed par--SVR is to estimate both conditional mean and predictive variance. The conditional mean function
and predictive variance function
are, respectively, expressed as
and
, where
and
. The parameter-insensitive zone is
. The optimization problem of par-
-SVR can be expressed as
The size of , which is measured by
, is traded off against model complexity, which is measured by
, and slack variables via a constant
. To eliminate the trouble of computing the parameters of
and
indirectly,
and
in Equation (2) are, respectively, replaced by
and
. Then we have
SUPPORT VECTOR REGRESSION WITH PROBABILISTIC CONSTRAINTS
PC-SVR searches for a heteroscedasitc regression model , so that
lies in the neighborhood of
with a higher possibility, where
and
are unknown mean and variance functions, respectively;
follows the standard normal distribution;
;
. Therefore, the distribution of
can be obtained by Equation (4).
PC-SVR is intended to make lie in the neighborhood of
with a high probability, while simultaneously reducing the complexity of the mean function and increasing the amount of the variance. PC-SVR is primarily formulated as below:
To ensure that lies in the neighborhood of
with a high probability,
and
should be selected in the range of
. Equation (5) is equivalent to the following constrained optimization problem.
Neighborhood size of the target varies with different samples by the constraints of PC-SVR; is a nonlinear function of the input. Thus, PC-SVR can capture the heteroscedasticity associated with the data.
Theorem 1
The -SVR is a special form of PC-SVR.
Proof
Let ,
,
,
,
,
, and
; Equation (7) can be rewritten as
From Equation (8), it follows that -SVR is a special form of PC-SVR.
This completes the proof of Theorem 1.
Theorem 2
The par--SVR is a special form of the PC-SVR.
Proof
Supposing , we thus have
. Let
, where
is a negative number,
,
,
,
,
, and
; and minimizing
is just minimizing
, for
is negative, then Equation (7) can be rewritten as
From Equation (9), it follows that par--SVR is a special form of PC-SVR.
This completes the proof of Theorem 2.
The Lagrangian of Equation (7) is
Substituting these results into Equation (10) yields the following dual optimization problem:
Under the Karush–Kuhn–Tucker (KKT) condition, we have
In the high-dimension feature space, the inner product can be replaced by a kernel function, that is, . Here, the Gaussian kernel function is selected because of its well-known generalization ability in common applications. Obviously, Equation (12) can be rewritten in the matrix form as
After solving Equation (14), we obtain Lagrange dual variables and
. Then, for any input
, we can subsequently determine the mean function and variance function by
For PC-SVR, is used as the forecast value, and the forecast interval can be expressed as
EXPERIMENTS
Experiments were made to verify the effectiveness of the proposed PC-SVR. The model was built by means of MATLAB 7.7. F -SVM, par-
-SVR, and our PC-SVR are all solved by the optimization toolbox QP in MATLAB. Gaussian function
is used as the kernel function for all algorithms.
Product Design Time Forecast Based on PC-SVR
The designs of plastic injection molds were first studied to illustrate the forecast method. The injection mold is a kind of single-piece-designed product, the design process of which is usually driven by customer orders. Some time factors with large influencing weights are structure complexity, model difficulty, wainscot gauge variation, cavity number, mold size, and form feature number. The first three factors are expressed as linguistic variables and the last three as numerical factors.
Prior knowledge about MCT is embedded in our PC-SVR and is used to determine the size of the neighborhood of the target value. For the ith case, denotes its corresponding MCT. Set
, where
is named the conservation index of the model and
. Here,
is considered as a prior. Thus, we have
Kernel approximation (Mangasarian, Shavlik, and Wild Citation2004; Mangasarian and Wild Citation2007), which is totally different from Fv-SVM and PC-SVR, is chosen for comparison. The optimization problem of kernel approximation (KA) is formulated as
Prior knowledge about MCT can be incorporated into KA in the form of linear inequalities, and the model is abbreviated as K-KA, which is represented as the following problem:
In our experiments, 72 sets of molds with corresponding design time and MCT were obtained from a typical company. The detailed characteristic data and design time of these molds compose the corresponding patterns, as shown in . also gives the MCT for each mold. Numerical variables were scaled to be within [0, 1]. For linguistic variables, VL, L, M, H, and VH were transformed into crisp values according to expertise and were, respectively, substituted by 0.1, 0.25, 0.5, 0.75, and 0.95. We first trained PC-SVR with 60 samples, and the rest were used for testing.
TABLE 1 Training and Testing Data of Injection Model Design
Before PC-SVR training, relevant expertise was used to determine its parameters. Then, with relevant experience, we set ,
, and
. The combination of genetic algorithm and cross validation was implemented for searching for its optimal parameters. The selection ranges of
,
, and
are, respectively, [0.01, 104], [0.01, 104], and [10−3, 10]. For PC-SVR, the optimal combinational parameters are
,
, and
. For par-
-SVR, KA, and K-KA in this study, its optimal model parameters are selected in the same way as those of the PC-SVR. We obtain
,
, and
for par-
-SVR. For KA,
, and
are obtained.
,
, and
are selected for K-KA.
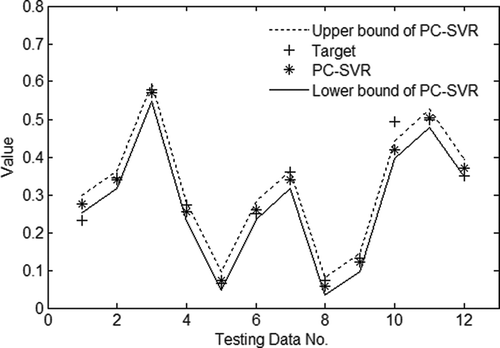
shows the forecast results of our PC-SVR. It can be seen that, for the test samples, our PC-SVR provides the effective forecast intervals, excluding T1 and T10; the sum of its variance values on testing data is 0.004. To make a comparison of different models, the actual forecast values are given in . shows the statistics of five forecast models, which indicate that PC-SVR and F -SVM are of higher precision than par-
-SVR and KA and K-KA, and that K-KA performs better than KA, but worse than PC-SVR. In view of the fact that PC-SVR can simultaneously give the forecast intervals facilitating product development, it is supposed to outperform F
-SVM, especially appropriate to cases with finite samples.
TABLE 2 Comparison of Forecast Results from Five Different Models
TABLE 3 Error Statistics of Five Forecast Models
FIGURE 1 Testing results of PC-SVR.
Extended Applications of PC-SVR
In addition to the problem of design time forecast, PC-SVR can also be extended to other applications. The Boston Housing and Slump Test datasets from the UCI repositoryFootnote1 were used to evaluate the proposed PC-SVR. In our experiments, both the target output and numerical attributes were normalized to be within [0, 1]. Because we had no prior knowledge about the value of in these experiments,
was selected as
, where
is the target output and
is a small positive number. Here, set
. Thus, we have
For the Boston Housing (BH), the dataset consists of 14 attributes, in which the median housing values (MEDV) is taken as the output variable. Three hundred and fifty cases were chosen, of which 100 were used for training and the rest for testing.
TABLE 4 Optimal Model Parameters of Regression Models
TABLE 5 Comparison of Regression Performance
The Concrete Slump Test (CST) covers 7 input and 3 output variables as well as 103 data points. The 28-day Compressive Strength is taken as the desired output variable. Eighty cases were chosen as the training data, and the rest as the testing data.
By the parameter-choosing algorithm, the optimal model-parameters of regression models are given in , and the comparison of regression performance is presented in . The above two experiments demonstrate that even without prior knowledge about the neighborhood of the target value, our PC-SVR yields a comparable result to par--SVR and KA and K-KA, and the forecast method based on PC-SVR is effective and suitable for real-world regression problems.
CONCLUSIONS
Product design is a significant phase in the entire product development process. The control and decision of product development are based on the reasonable degree of the distribution of product design time. However, the duration of product design is subject to many factors, most of which are of fuzzy, random, and uncertain characteristics. In addition, heteroscedasticity is also a significant feature for product design.
In this article, a new model, named PC-SVR, has been proposed to forecast the product-design time, which is based on the combination of par--SVR and heteroscedastic regression. Prior knowledge about maximum completion time is utilized to determine the size of the neighborhood of the target value. The designs of plastic injection mold have been studied as well. Compared with F
-SVM, our PC-SVR enjoys the same forecast precision, but simultaneously provides effective forecast intervals crucial to the control and decision of product development.
The time forecast model has been developed with several goals. First, the model can be used when the designs are driven by customer orders and there are some historical data available. Second, the forecast model is of solid theoretical foundation, and prior knowledge about maximum completion time can be easily incorporated in the model. Finally, the final expression of the model is easily applicable, and we do not have to assume the underlying model function. The forecast method based on PC-SVR is also effective and suitable for real-world regression problems.
ACKNOWLEDGMENT
The authors thank Professor Li Lu for his valuable comments and suggestions.
FUNDING
This work was supported in part by a key program of National Natural Science Foundation of China under Grant 60934008 and the Fundamental Research Funds for the Central Universities of China under Grant 2242014K10031.
Notes
REFERENCES
- Agarwal, K., R. Shivpuri, Y. J. Zhu, T. Chang, and H. Huang. 2011. Process knowledge based multi-class support vector classification (PK-MSVM) approach for surface defects in hot rolling. Expert Systems with Applications 38(6):7251–7262.
- Andre, A. B., E. Beltrame, and J. Wainer. 2013. A combination of support vector machine and k–nearest neighbors for machine fault detection. Applied Artificial Intelligence: An International Journal 27(1):36–49.
- Bashir, H. A., and V. Thomson. 2001. Models for estimating design effort and time. Design Studies 22(2):141–155.
- Burges, C. J. C. 1998. A tutorial on support vector machines for pattern recognition. Data Mining and Knowledge Discovery 2(2):110–115.
- Cho, S. H., and S. D. A. Eppinger. 2005. Simulation-based process model for managing complex design projects. IEEE Transactions on Engineering Management 52 3):316–328.
- Chuang, C. C., S. F. Su, J. T. Jeng, and C. C. Hsiao. 2002. Robust support vector regression networks for function approximation with outliers. IEEE Transactions on Neural Networks 13(6):1322–1330.
- Griffin, A. 1997. Modeling and measuring product development cycle time across industries. Journal of Engineering Technology 14(1):1–24.
- Hao, P. Y. 2010. New support vector algorithms with parametric insensitive/margin model. Neural Networks 23(1):60–73.
- Jacome, M. F., and V. Lapinskii. 1997. NREC: risk assessment and planning for complex designs. IEEE Design and Test of Computers 14(1):42–49.
- Lee, K., D. Kim, K. H. Lee, and D. Lee. 2005. Possibilistic support vector machines. Pattern Recognition 38(8):1325–1327.
- Mangasarian, O. L., J. W. Shavlik, and E. W. Wild. 2004. Knowledge-based kernel approximation. Journal of Machine Learning Research 15(2):1127–1141.
- Mangasarian, O. L., and E. Wild. 2007. Nonlinear knowledge in kernel approximation. IEEE Transactions on Neural Networks 18(1):300–306.
- Okori, W., and J. Obua. 2013. Contribution of prior knowledge to probabilistic prediction of famine. Applied Artificial Intelligence: An International Journal 27(10):913–923.
- Schökopf, B., A. J. Smola, R. Williamson, and P. L. Bartlett. 2000. New support vector algorithms. Neural Computation 12(5):1207–1245.
- Tseng, I., J. Moss, J. Cagan, and K. Kotovsky. 2008. The role of timing and analogical similarity in the stimulation of idea generation in design. Design Studies 29(3):203–221.
- Vapnik, V. N. 1995. The nature of statistical learning theory. New York, NY: Springer-Verlag.
- Xu, D., and H. S. Yan. 2006. An intelligent estimation method for product design time. International Journal of Advanced Manufacturing Technology 30(7-8):601–613.
- Yan, H. S., B. Wang, D. Xu, and Z. Wang. 2010. Computing completion time and optimal scheduling of design activities in concurrent product development process. IEEE Transactions on Systems, Man, and Cybernetics–Part A: Systems and Humans 40(1):76–89.
- Yan, H. S., and D. Xu. 2007. An approach to estimating product design time based on fuzzy ν-support vector machine. IEEE Transactions on Neural Networks 18 (3): 721–731.
- Yang, J. L., and H. X. Li. 2009. A probabilistic support vector machine for uncertain data. In 2009 IEEE international conference on computational intelligence for measurement systems and applications, 163–168. IEEE Computer Society.
- Yang, Q., X. F. Zhang, and T. Yao. 2012. An overlapping-based process model for managing schedule and cost risk in product development. Concurrent Engineering: Research and applications 20(1):3–7.