
ABSTRACT
In this article Tomasz Andrysiak presents the use of sparse representation of a signal based on overcomplete dictionaries of base functions and a QRS detection method using artificial neural network to detect anomalies in the analyzed ECG signals. Performance of the proposed method was tested by means of a widely available database of ECG signals, i.e., the MIT-BIH Arrhythmia Database, and the obtained experimental results confirmed its effectiveness for anomaly detection in the analyzed ECG signals. The current dynamic and intensive development of information technologies and more excellent methods of processing, analysis, and recognition of signals have enriched medicine with new quality techniques in diagnosis and therapy. At present, a special interest is put to noninvasive diagnostic methods for rapid and objective determination of vital signs and, in particular, automatic electrocardiogram performed outside medical facilities. The sparse representation of a signal was performed in an adaptive manner by means of the matching pursuit algorithm. In each step of the algorithm, there was implemented a linear signal decomposition of features belonging to the dictionary with redundancy. Two kinds of dictionaries were tested. The first type included elements that form the analytical base functions, and the second represented the essential components of the ECG signal searched with the use of the K-Singular Value Decomposition (K-SVD) algorithm. Recognition of the QRS was realized by means of a unidirectional, multidimensional neural network with backpropagation of an error. For this solution, tests were performed on a selection of appropriate neural network architectures and the impact of a particular activation function on the recognition results. Anomaly detection was realized with estimation of sparse representation parameters of the tested ECG signal within the field of the recognized QRS complex, and it was compared with the reference values. Performance of the proposed method was tested using a widely available database of ECG signals—MIT-BIH Arrhythmia Database. The obtained experimental results confirmed the effectiveness of the proposed method of anomaly detection in the analyzed ECG signals.
Introduction
Intensive development of techniques used for acquisition, analysis, and detection of signals gave grounds for searching new solutions in the field of modern medical diagnostics. One of directions of this development is automation of the process of analysis and detection of disturbances in ECG signals (Tang and Lan Citation2014). This approach accelerates and facilitates the processes of analyzing the electrocardiogram and enables keeping cardiological supervision in real time outside medical centers. A visible effect of such an intensive development is the currently emerging telemetric systems transmitting in real time the results of processing the ECG signal to the monitoring centers (Srinagesh, Sarala, and Aparna Citation2013).
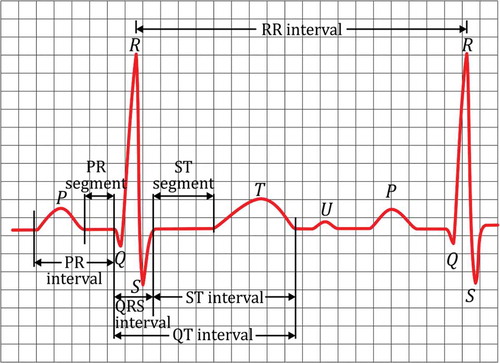
The purpose of electrocardiography is to provide information about the changing electric field on the outer surface of the human body as a result of bioelectric processes (Besterman and Creese Citation1979). Observation and analysis of those changes are the grounds of correct diagnosis of the heart rate reflected in ECG sequences. These sequences describing the deflection of an ECG signal were marked by Einthoven (Citation1924) as the consecutive alphabet letters P, Q, R, S, T, and are associated with polarization and depolarization of the atria and ventricles. The most important information from the point of view of analysis of the structure of the ECG is the QRS complex. This term describes three, occurring next to each other, characteristic points Q, R, S of an electrocardiogram, which form the deflection shape of a narrow pulse (). This complex is characterized by the highest deflection and the shortest duration. Its shape and frequency supply the most diagnostic information about the current state of the heart. Additionally, it is the basis of a particular scheme of construction, i.e., the structure PQRST of the tested person’s cardiac cycle. It is also used as an important message for automatic determination of the heart rate (R-R interval). The correct detection of a QRS complex in an ECG signal is essential information for most automatic ECG analysis algorithms (Daskalov and Christov Citation1999).
Figure 1. An example of an ECG signal with marked folds.
Despite the practical application of systems that recognize the essential elements of the ECG, the problem of detection and identification of QRS is still a subject of research of many scientific centers (Harikumar and Shivappriya Citation2011). The reason for this situation is that, besides the complexity of signal and morphological variety of ECG folds, quite often noise and artifacts of different kind appear, which significantly hinder its analysis (Alfaouri and Daqrouq Citation2008). Therefore, algorithms of the QRS complex detection need to fulfill strict requirements, i.e., they must have high resistance to distortion, almost 100% accuracy of detection, and processing speed close to real time. These algorithms are, in fact, the starting point for the overall analysis of ECG and, in particular, for different kinds of anomalies appearing in it. Their accuracy significantly influences the quality of functioning of the complete system analyzing the ECG signal (de Chazal, O’Dwyer, and Reilly Citation2004).
One of the most often detected anomalyies of the heart rate is arrhythmia, reflected in time changes of the R-R interval and fluctuations of QRS complexes’ morphology in ECG records. There are two basic types of arrhythmia: paroxysmal and chronic. Detection of chronic arrhythmia is relatively simple, paroxysmal arrhythmia, though, requires recording the ECG signal over a longer period of time. However, the diagnostic importance of paroxysmal arrhythmia is immense because it represents deviation from regular sinus rhythm caused by a progressive disease process or arrhythmogenic factors. Arrhythmia detection is most often based on finding in the ECG signal the QRS complexes correlated with the R-R interval and classification of their morphology (Sanamdikar, Hamde, and Asutkar Citation2015).
Given the previous information, in this study, I suggest a system of data analysis and anomaly detection in ECG signals based on machine learning techniques. The main concept of the proposed approach is a skilful combination of the sparse decomposition of an ECG signal on the grounds of redundant dictionaries of base functions with classifying properties of multidimensional unidirectional neural network with backpropagation of an error. The tasks of anomaly detection are realized by estimation of energy of the components of ECG signal’s sparse representation in the field of the found QRS structure. This approach allows rapid and effective anomaly detection in the tested ECG signals.
This article is organized as follows. After the introduction, “Related Work” describes related work on existing detection methods of the QRS complex and anomaly detection in electrocardiographic records. Next, “Machine Learning Techniques for Data Analysis and Anomaly Detection in ECG Signals” and its subsections show the details of machine learning techniques for data analysis and anomaly detection in ECG signals, the sparse representation of ECG signals based on the matching pursuit algorithm, outlines of the details of different versions of dictionaries for sparse representation, the generation of the dictionary tree structure for the optimizing computation, and the QRS detection method using artificial neural network is discussed. The section that follows that presents the details of experimental results of the proposed anomaly detection approach. “Conclusions” are made in the final section.
Related work
Detection algorithms of a QRS complex are the key elements of every system of automatic ECG signal analysis. Their accuracy and efficiency have significant impact on the quality of the diagnostic data reported by the system (Pan and Tompkins Citation1985). Detection of a QRS complex can be divided into two basic stages (Augustyniak Citation2001). The first one implies performing mathematical transformations of the ECG signal with sharpening the features of the QRS complex and minimizing other, nonessential elements of the signal (noise, disturbances). As a result of preprocessing the original signal, we receive a function of detection, the measure of which is the steepness of growing and falling of slopes on the QRS section borders. The second stage consists of thresholding, which is used to find points classified as QRS complexes. Most often, the value of a threshold is established in an adaptive way, and the main objective of thresholding is to find the local maximum. Algorithms of detection and classification of a QRS complex can be divided into: (1) algorithms based on time domain or frequency domain; (2) algorithms using elements of artificial intelligence based on neural network models, Support Vector Machine classifiers, or genetic algorithms.
QRS complex detection in a time domain consists of finding local maximum in the ECG signal, most often by means of various signal differentiation algorithms (Hsiung, Cheng, and Jan 1989), or filtration methods based on principles introduced by Hamilton and Tompkins (Citation1988). Frequency domain analysis, however, involves the study of spectral properties of ECG signals and, in practice, it uses discrete Fourier transform (Kwiatkowski Citation2003) or Gabor transform (Okajima Citation1998).
A development of the above methods is the time-frequency analysis performed with the use of wavelet transform, proposed for the first time for the ECG signal by Hassani and others in their work (Hassani, Fachrudin, and Hubin Citation1994). The mentioned authors utilized the wavelet transform not only to detect the QRS complex, but also to recognize tachycardia and long QT syndrome. In the subject literature, the biggest set of algorithms connected to wavelet transform used for detection of a QRS complex is based on the approach by Mallat and Hwang (Citation1992). The authors studied the correspondence between the singularities of functions and local maxima in the wave transform of the signal. The peak classification was performed by calculating the degree of detail, so called Lipschitz’s local regularity, which was estimated based on the distribution of wavelet coefficients. Both continuous and discrete wavelet transforms may be successfully used not only for detection but also for classification of the signal’s anomaly and recognizing arrhythmia. For instance, Chazal the Daubechies family of wavelets of different orders.
Addison (Addison et al. Citation2000), on the other hand, utilized the wavelet transform to study the ECG signal during ventricular fibrillation. The combination of neural network and wavelet transform for the ECG signal’s diagnostics, however, was first proposed by Celler and de Chazal (Citation1998). For the ECG signal’s decomposition into six levels, the authors used Daubechies and Symlet wavelets, and the statistical parameters obtained in such a way constituted input data for a neural network, which did not have any hidden layers. In turn, in Al-Fahour and Howitt (Citation1999), to automatically detect and classify arrhythmias, the authors proposed the neural network with radial preprocessing, which uses the Daubechies wavelet of the fourth order. Another approach in the field of artificial intelligence is the use of Support Vector Machine techniques, which perform separation of components of the ECG signal while maintaining fairly strict statistical requirements by seeking global minimum of a convex cost function (Osowski, Tran Hoai, and Markiewicz Citation2004). A different approach is methods based on genetic algorithms for ECG signal analysis, which were first used by Poli and Cagnoli (Citation1995). They found that genetic algorithms, in conjunction with polynomial filters, effectively handle noise, artifacts, and diversity of morphology of the ECG in QRS complex detection tasks.
Machine learning techniques for data analysis and anomaly detection in ECG signals
This article presents chosen methods of machine learning for detection of a QRS complex and correlative anomalies reflected in ECG records. Selection of essential features of the signal was realized by sparse decomposition of the ECG signal with the use of redundant dictionaries. However, detection of the QRS complex in the analyzed ECG signal was performed by means of a multilayer neural network with backpropagation of an error. Novelty of the presented solution consists of combining the sparse representation of the ECG signal with classification properties of neural networks.
Sparse representation of an ECG signal
Representations of an ECG signal realized as linear expansions with regard to a particular set of basis functions well located with respect to time and/or frequency are not sufficiently precise and optimal in numerous cases. Depending on the choice of such functions, the expansion coefficients represent different features of the analyzed ECG signal. In the case of complicated signal structures, we are unable to define the optimal scale parameters and frequencies for the particular basis functions. Then, a natural solution is introduction of more diverse, numerous, character sets of functions that are adjusted to the ECG signal’s named dictionaries with redundancy (Rubinstein, Bruckstein, and Elad Citation2010). By performing the above, we obtain much more universal and flexible representations.
However, decomposition of an ECG signal with regard to a dictionary requires then constant searching and matching of its suitable elements, which best reflect the wanted features of the analyzed signal. The mentioned matching should be realized in such a manner that it maximizes the correlations between the chosen element of the dictionary and the rest of the processed signal. Therefore, there is a need to determine the quality measure of such matching and an algorithm ensuring finding the best, in the sense of that measure, the ECG signal’s representation.
The nature of sparse representation is based on seeking the sparse solution of coefficients that represent the signal
with the use of a dictionary with redundancy, on condition that the remainder is smaller than the given constant
. It can be written as (Elad Citation2010):
where is the
norm counting the nonzero entries of a vector,
representing a set of projection coefficients, and
are the elements of redundant dictionary
(Davis, Mallat, and Avellaneda Citation1997).
The optimal representation can be defined as such a subset of dictionary elements, the linear combination of which explains the highest percentage of the signal’s
energy among all the subsets with the same number of elements. The choice of such representation is NP-difficult (Troop Citation2004), thus, in practice, we are satisfied with an adaptive iterative solution called the matching pursuit algorithm. The outcome of this algorithm’s work is a projection of the signal’s structural elements onto the chosen dictionary’s elements.
The matching pursuit algorithm
To realize the signal’s decomposition, we will set a linear expansion with regard to a set of atoms selected from the dictionary
so that they are most properly adjusted to the structural elements of the analyzed signal. These operations will be realized by means of the matching pursuit algorithm (MP) proposed in Mallat and Zhang (Citation1993).
Owing to the MP algorithm, we obtain three pieces of information:
the set of projection coefficients
the set of residua
the list of elements of the dictionary selected as approximate of
and represented as
,
, and
are vectors which thoroughly denote the discrete signal
, which can be written as
where is residuum in an
–term sum.
In every step of the MP algorithm we will perform further decompositions of signal
by means of projections onto the elements of dictionary
. Then, in the
decomposition step, we obtain
and
where is a scalar product, and
is the residuum resulting from decomposition of
in direction
. For residuum of zero order there is a clear link
. The selected
vectors’ indices are gathered in the index vector
,
, and the vectors are collected as columns of the matrix
and
.
Selection of is the core function of the MP algorithm. This task is performed by finding the vector that is best adjusted to the residuum achieved by projection of
onto the elements of the dictionary, i.e.,
For the atom , chosen by means of dependency Equation (5), we minimize the residuum of signal
in the next step of the MP algorithm. The number of iterations
, in which we perform limitation of residua, depends on the required preciseness of the
signal’s representation and is given by dependency, e.g., Equation (5), being at the same time the criterion of the MP algorithm’s stop,
where the parameter . For practical realization of the MP algorithm’s stop criterion we take parameter value
, which gives 90% accuracy of the
signal’s representation.
The pace of residuum norm’s fall depends on the correlation between consecutive residua of the signal and the selected atoms of the dictionary. If, in the ECG signal, there is a sum of high energy components constituting dictionary atoms, then the signal correlation coefficient and its residua are significant. Consequently, their norm falls rapidly because the high-energy components are the signal’s structural elements well correlated with the chosen atoms of the dictionary.
The MP algorithm can be stated as follows:
Step 1. Initialize the residuum
Step 2. Find in dictionary
Step 3. Compute new coefficient
Step 4. If the stopping condition is achieved, e.g., Equation (6), stop the algorithm. Otherwise, set
To differentiate the adaptive decompositions of signal , there has been introduced an additional limitation
in dependence Equation (5). It modifies the MP algorithm and consists of a ban on the selection of the same atoms in two successive iterations of the decomposition process. This condition results in a decrease of correlation in set
containing exploited atoms
, and it improves distinctiveness of the
signal decomposition outcomes.
The orthogonal matching pursuit algorithm
The orthogonal matching pursuit (OMP) algorithm proposed in (Pati, Rezaiifar, and Krishnaprasad Citation1993) presents an enhanced version of the regular MP algorithm. Both algorithms have a greedy structure; however, for the OMP algorithm, every chosen atom must be orthogonal in every decomposition stage.
The in the
iteration is selected by the algorithm by searching for a vector that best matches the residuum achieved by projection of
onto the elements of the dictionary, i.e.,
The reselection issue is not present in the case of the stored dictionary. If , then the index set is updated as
and
. Otherwise,
and
.The residuum
is computed by means of
where is the Gram matrix (Gharavi-Alkhansari and Huang Citation1998).
The OMP algorithm can be presented as follows:
Step 1. Initialize the residuum
Step 2. Find in dictionary
Step 3. Compute the new coefficient
Step 4. If the stopping condition is achieved Equation (6), stop the algorithm. Otherwise, set
Dictionaries for sparse representation
Bases are the smallest complete dictionaries. The greatest dictionary for space consists of all integral functions with the square of the unit standard (Natarajan Citation1995). A precise representation of the analyzed ECG signal in a dictionary larger than a base introduces redundancy. The expected conciseness can be obtained by accepting the signal’s reconstruction inaccuracy, however, with the use of possibly the smallest amount of functions, which are the dictionary’s elements. Optimal representation can be defined as such a subset of the dictionary’s components, the linear combination of which explains the highest percentage of the signal’s energy among all the subsets of the same size (Liu, Wang, and Wu Citation2004).
For realization of sparse representation of a signal, we used two types of dictionaries created on the basis of distinct approaches. One of them is a dictionary whose elements (time-frequency atoms) are computed by means of the properly parameterized Gabor function. The other, however, is created adaptively on the basis of the class of the processed ECG signals with the use of the K-SVD algorithm. Due to such an approach, we minimize the signal’s approximation error for a particular size of the dictionary.
Dictionary of gabor function
In the described solution, we proposed a wavelet form. A time-frequency dictionary can be expressed as a translation , a dilation
, and a modulation
of a window function
where is a standardized Gaussian function.
Time-frequency atoms defined by means of this function are called a Gabor function, and a dictionary consisting of those atoms is a Gabor dictionary. According to Mallat and Zhang‘s statement (Mallat and Zhang Citation1993), with proper discretization of a Gabor dictionary, we are able to obtain fast numerical realization of the MP algorithm.
The optimal time-frequency resolution is achieved for the Gaussian window , which for the analysis of real valued discrete signals gives a Gabor functions dictionary (Gabor Citation1946),
where is the size of the signal for which the dictionary is built,
is a normalizing constant used for the achieved atom’s unit energy
, and
constitutes parameters of the dictionary’s function (Durka Citation1996) .
We assume that the analyzed signal is composed of samples, where
is an integer. Then, entering the dyadic sampling, we achieve
,
. For parameters
and
we assume the same sampling period
. In this way, for the chosen parameters, we obtain a Gabor dictionary characterized by great computational simplicity.
If resolution is defined as distance in time or frequency
between the neighboring atoms of the so defined subset of the Gabor dictionary, and assuming that
is a sampling frequency of the analyzed signal
, we get
This means that resolution depends on the octave , which defines the size of atoms in time and frequency. The time variation interval of the dictionary atoms determines their ability to represent the structural element of the signal
in time. A modification in frequency is achieved by changing the sampling frequency of parameters
and
.
We implemented the modified dictionary, originally proposed by Mallat and Zhang (Citation1993); the parameters of the atoms are chosen from dyadic sequences of integers. Scale , which corresponds to an atom’s width in time, is derived from the dyadic sequence
. However, parameters
and
, which correspond to an atom’s position in time and frequency, are sampled for each octave
with an interval
.
In order to create an overcomplete set of Gabor functions, the dictionary was built by varying subsequence atom parameters: scale
, translation
, modulation
, and phase
. The base functions of dictionary
were created by using 25 different scales and 100 different modulations.
The adaptive method of a dictionary creation on the basis of an ECG signal
Creation of a dictionary containing analytical functions is relatively quick and simple, but it might lead to dependence of the approximation error (in the process of signal decomposition) on the nature and count of functions in the dictionary. The adaptive method of a dictionary creation on the basis of K-SVD algorithm, though, is deprived of the aforementioned disadvantage (Aharon, Elad, and Bruckstein Citation2006). In every iteration of the algorithm, there is a searching and updating of the dictionary’s components in order to, for particular criterion, maximize the correlation between the found atom (an element of the processed signal) and the remaining representation of the ECG signal.
The prime function of the K-SVD algorithm is finding the best dictionary, which would represent the signal as sparse composition, by solving
where is the Frobenius norm and
is a fixed and predetermined number of nonzero entries.
The algorithm is divided into two stages:
Sparse Coding Stage: In this phase, the coefficients
Dictionary Update Stages: In this phase, we update the
where depicts the representation error of the signal’s sample after the
atom. The following stages of the dictionary’s update are:
We define the index set that uses the atom
In the next step, we define the matrix
We compute
and restrict by selecting the columns matching
so that we obtain
.
In the last step, we use SVD to decompose
All dictionary atoms are updated is this manner. Iterating according to thee two steps will create a dictionary that approximates the provided signal in a sparse and accurate way. The outcome of the K-SVD algorithm will be a dictionary
containing often correlated atoms that best represent the analyzed signal
with regard to its sparse representation
. To solve this problem, we propose a modification of the K-SVD algorithm through introduction of a decorrelation condition.
We add the following optimization problem at each iteration of the dictionary learning algorithm that includes approximation followed by a dictionary update
whereis the measure of the maximal correlation of different atoms
and
where the objective is a cost function that describes the approximation feature of the dictionary, and
is the level of a fixed target coherence.
A possible solution to this issue might be to apply a decorrelation step to the iterative scheme in the K-SVD algorithm. To a dictionary learning algorithm implying a sparse approximation that is followed by a dictionary update, we add, at every iteration, the following optimization problem:
where constitutes the unknown minimum value achieved by the criterion Equation (17).
In our practice, we proposed to solve the problem by applying a decorrelation step in the K-SVD loop after the dictionary update.
A searching in the dictionary of atoms
In the basic matching pursuit algorithm, atoms are selected in every step from the entire dictionary, which has a flat structure. In this case, the algorithm causes significant processor burden by performing full search of the dictionary. In the presented solution, for the purpose of optimization of the searching process, it is proposed to use the construction of tree structures of the dictionary on the basis of a K-means algorithm (Berkhin Citation2006).
For the obtained atoms, the clustering algorithm has been used to group them into clusters. By means of this method, the clusters are created in the initial dictionary, where they are organized into a hierarchical tree structure, in which the elements of the dictionary form the leaves. Consequently, the clustering process creates levels of a tree structure. Every branch of the tree haschildren and is completely described by the list of the atom indexes
. A centroid
is assigned to the branch of a tree that represents atoms of the dictionary in the corresponding subtree (Jost, Vandergheynst, and Frossard Citation2005).
The clustering algorithm can be stated as follows:
Step 1. Initialize the set of centroids
Step 2. Assign each atom to the group that has the closest centroid for
Step 3. Calculate the new centroids for
Step 4. Calculate the error of the clustering
Step 5. If the stopping condition is achieved
As a result of operation of the above algorithm, we obtain a tree structure of a dictionary, which enables a significant acceleration of the searching process of a particular atom that best corresponds the analyzed signal . In practical implementation of the clustering algorithm, we assume the parameter values
and
The concept of neural network for sparse representation of an ECG signal
The original idea of neural network realization for sparse representation of a signal consists of finding a linear decomposition of the analyzed ECG signal by means of MP or OMP greedy algorithms. As a result of the realized decomposition, with regard to atoms belonging to a dictionary with redundancy, we obtain essential structural properties of the signal, which further undergo a selection process. So, a prepared vector of features, emerged from finding a sparse representation of the ECG signal, constitutes an optimal input vector for a properly matched structure of the neural network. It is worth mentioning that a similar concept may be found in the work of Shyu, Wu, and Hu (Citation2004), describing detection of various types of QRS complex morphologies; however, they use the wavelet transform, not the sparse representation of the signal.
In the view of the discussed solution, the neural network structure is conditioned by both the way of use of the sparse representation of the ECG signal and the type of the utilized neural network. Therefore, it is impossible to propose one specific and optimal structure. To solve this problem, a unidirectional multilayer neural network was taken as the basis for the research model.
Assuming that is the number of layers, and in every layer there is
of neurons,
is the value of the
-output of the
-hidden layer, and
is the weight of the
-neuron of the
-layer, we can define the output signal of the
neuron (
-output of
-layer) as
For experimental reasons, we will use two activation functions described by means of dependence Equation (23). One of them is a unipolar function taking values in the range (0,1) and the other is bipolar determined on the range of (−1.1).
where is a parameter allowing us to determine the appropriate shape of the activation function and taking the values
.
In the case of the presented solution, the process of neural network learning is realized as learning with supervision, i.e., a defined set of input data corresponds to an assigned output pattern. The network’s learning consists of modification of weight connections in order to match particular input components to the desired patterns. The weight adaptation comes down to finding the minimum of the objective function modeled as a function of the mean square error. Then, the complete mean square error at the outputs of neurons of the neural network last layer
is described by the dependence
The minimization process of error function is most often realized by modifications of weight vector values by means of gradient methods, for which the gradient vector points the direction of the quickest fall. In the presented solution, the backpropagation error method (BP) was used as the gradient learning algorithm of unidirectional multilayer neural networks. However, the neural network learning BP process algorithm might be of low speed. Additionally, the learning process might terminate not in the moment of finding the global minimum of the error function, but in one of its local minimum. The proper selection of input weight values is, therefore, of great importance. A significant improvement of the BP method’s convergence can be obtained by using the moment variation of the method. Then, changes of weights happen in a smoother way, often causing acceleration of convergence. A more detailed description can be found in the work Muller, Reinhardt, and Strickland (Citation1995).
In the presented solution, for the process of neural network learning, we utilized the following method of initial weight creation: weights, the benchmark of which , adopts values of
, the other weights—the value of
. Such a manner of selection ensures repetition of the conducted learning process. To complete the neural network training, the hold-out method was used, which considers the minimum of testing error as the stopping criterion. In our case, it was the value of 0.001. A very important issue is also proper selection of the input dataset. Division of datasets into the learning set and testing set was realized by means of the cross-validation method, which consists of segmentation of the prepared set according to equinumerous
–subsets, of which
were involved in the learning process.
Experimental results
In the conducted tests, we used the Massachusetts Institute of Technology–Beth Israel Hospital Arrhythmia Database (MIT-BIH) composed of eight datasets with various disturbances detectable with Holter’s method (MIT-BIH Arrhythmia Database Citation2010). The test was performed on 48 records from MITDB catalogue, which includes a file with signal, a heading file (information about the patient) and a diagnostic information file (with a binary form of the signal). The sampling frequency of signals was 360 Hz, and resolution 12 bits. The process of determining the parameters of the proposed solution (i.e., the number of levels of sparse decomposition, the threshold detection value, the selection of the learning set and neural network architecture, and the kind of activation function) was performed by means of available signals in the MIT-BIH base. The detailed outcomes, however, were presented exclusively for four selected signals. The mentioned signals have consecutive numbers, and are characterized by (respectively) 105—very big noise, 108—high P wave amplitude (often mistakenly detected as R), 203—high T wave amplitude (often mistakenly detected as R), and 222—the noise very similar to the QRS complex.
Exemplary fragments of those signals are presented in as follows: (a) signal 105, (b) signal 108, (c) signal 203, and (d) signal 222.
Figure 2. The fragments of ECG signals’ records from the MIT-BIH base: (a) signal 105, (b) signal 108, (c) signal 203, (d) signal 222.
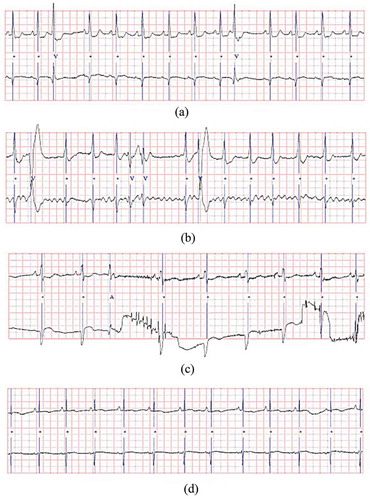
While conducting research, great attention was drawn to signals containing a significant amount of noise, artifacts and morphological changes. As stated in the field literature, the aforementioned signals from the MIT-BIH base are the most problematic and authors obtained the lowest results for them. For every signal, the tests included both the number of false negative and false positive detections, and the following parameters were determined: sensitivity measure, detection error, positive predictive value, and the percentage of correct detection.
The setup of experiments
Generally, detection of the QRS complex can be divided into two basic stages. The first consists of performing mathematical transformations of the ECG signal with sharpening the QRS complex features and minimization of the remaining signal’s features together with noise and disturbances. The second stage includes thresholding, the aim of which is to find the local maximum further used for discovering points classified as the QRS complexes.
The herewith presented concept of the QRS complex detection consists of performing preprocessing of the tested signal by means of a particular number of sparse decomposition layers of the ECG signal. As a result, we obtain the wanted characteristic features deprived of noise and disturbances, which undergo further selection. The prepared features’ vector, emerging as an effect of the utilized decomposition, constitutes an optimal input vector for a properly attuned neural network structure. It is worth noting that in the analyzed context, the neural network structure is conditioned by both the manner of the use of the analyzed signal’s sparse representation, and the applied neural network. Due to the above, it is impossible to propose a priori its definite and optimal structure. One possibility for determining the parameters of such a solution is to conduct experiments of the basis of a significantly large set of the ECG signal in order to estimate the number of sparse decomposition layers, the value of the detection threshold, the adjustment of the learning set, architecture of the neural network, and the type of activation function.
It should be emphasized that the presented solution is not aligned with the classic wavelet-neural networks theory, where the essence of the conception is substitution of the neural networks activation functions with wavelet functions. The learning algorithm is reduced to learning parameters (the scale and/or shifts) of the wavelet transform. In the presented approach, we seek optimal parameters and structures for the described method, however, not by means of learning but through a research experiment.
The selection of the signal’s sparse decomposition level
The sparse representation of the ECG signal realized by means of the MP or OMP is an approximated procedure, which, in every iteration, presents the signal at smaller and smaller levels of detail. Depending on the selection of a dictionary in which this representation in taking place (complying with the rule of energy behavior) we observe different dynamics of the decrease of the signal residuum’s norm. Therefore, with the increase of the sparse decomposition level, the energy of the already computed representation increases (the sum of decomposition coefficients and corresponding dictionary atoms). This process is presented by the results in (percentage of energy of the decomposed signal).
Table 1. The energy of signal’s residuum depending on decomposition level.
It is easy to notice that the choice of the dictionary has an impact on the size of the sparse representation’s energy in the decomposition process. The best results are obtained for the dictionary created by means of K-SVD, the elements of which are the particular structures of the ECG signal, and not time-frequency Gabor atoms. Assuming that we wish to present the ECG signal at least at the level of 90% of its energy, and on the lowest possible level of decomposition, the best solution is to use the OMP method with a dictionary created by means of K-SVD. For this option, five is the suitable level of decomposition. As it is easy to notice, the dynamics of the decrease of the sparse representation’s energy at the following levels is not that big. However, the manner of searching the elements in the dictionary (a full searching or the use of tree structure) did not have any significant impact on the results in . It influenced only the pace of computation.
The selection of the detection threshold value
In order to define the detection threshold value for the analyzed solution, we tested the dependence of the number of the detected QRS complexes on the change in the threshold values belonging to the set (0.4, 0.5, 0.6, 0.7, 0.8). On the basis of the conducted research, it was noticed that the number of the detected QRS complexes increases to the threshold value of 0.6 and then falls, adapting the shape similar to quadratic function parabola. It was also observed that in cases where the number of the detected QRS complexes falls with the increase of the threshold, it approximately takes the shape of a linear function.
However, in most cases (91% of the tested ECG signals) the detection threshold value at the level of showed the best results. The lowest sensitivity and the largest detection error were obtained for the remaining two extreme thresholds; that is, threshold values of 0.4 and 0.8. Exemplary detection error values are presented in .
Table 2. The maximum and minimum detection error for the given threshold value.
The selection of a training set and architecture of the neural network
It should be noted that in the case of medical diagnostic systems, it is important that the part of the set that participates in the learning process is well selected and contains all the characteristic signal structures. In order to conduct the learning process of a neural network, a division of the datasets was made onto the training set and the test set with the use of methods based on the split-sample and cross-validation. The achieved results of correct detections (98.40% for split-sample, and 98.89% for cross-validation) confirm the advantage of cross-validation of a dataset in the learning processes of a neural network.
To determine the architecture of a neural network, a test was performed on networks containing from one to five hidden layers. For every one of the structures, the number of the hidden neurons was changed, according to the consecutive set’s elements (10,20,30,40,50,60). Additionally, the accepted rule was that for networks with p number of hidden layers, if the first layer is constructed of q neurons, then the second will change, respectively, according to the sequence 5, 10, …, q.
Analyzing five types of neural networks, the best results for the most signals were achieved in the case of three hidden-layer structures and the optimal number of neurons equals 40 (this number constitutes the average value of the discussed set of hidden layers). It can be stated that the conducted research did not confirm the literature’s accepted point of view concerning a better ability to generalize the network with the smallest number of neurons ().
Table 3. The accuracy of detection in relation to the number of neurons in the hidden layer.
The accuracy of the QRS complex detection and the choice of activation function
Selection of suitable architecture of the neural network is also connected to the choice of a relevant activation function. For this reason, five types of neural networks were tested for parameter values . It was noticed that for the analyzed networks, by means of two activation functions, the growth of the QRS detection level happens simultaneously with the increase of parameter
value (the worst results, 91% of correct classification, were achieved for
, and the best—over 97% for the parameter value
). Averaged outcomes for particular types of neural networks and the given activation function when
are included in .
Table 4. The accuracy of the QRS complex detection in relation to the activation function.
The analysis of the outcomes presented in points to the purposefulness of using the sigmoidal function for neural networks with one or two hidden layers. However, for networks with more layers, it is advisable to use the tangesoidal function.
The detection outcomes of the presented solution
As a result of the conducted experiments, five decomposition levels realized by means of the OMP algorithm and a dictionary found with K-SVD method were established for the sparse representation of an ECG signal. A unidirectional three-layer neural network with a 40-neuron hidden layer was used as a model network. The detection threshold was fixed at the level of , and tangesoidal activation function was accepted. In , the average measures of detection error and sensitivity were presented in terms of time domain, frequency, time and frequency, neural networks, and the presented solution (SR-NN).
Table 5. Comparison of average measure values of detection and sensitivity for different solutions.
presents the size of detection error and sensitivity to the chosen signals from the MIT-BIH base.
Table 6. The comparison of detection error and sensitivity for signals: 105, 108, 203, and 222.
Analyzing the results presented in and , and comparing them to those published in the field literature, a conclusion can be drawn that the largest detection error is obtained for signal 109, containing high R wave amplitude. This error was smaller in relation to the time and frequency methods, but comparable to time-frequency methods and those utilizing neural networks. However, the smallest detection error was noted for signal 222, containing noise similar to the QRS complex. So low detection error value is probably a result of the signal’s sparse representation feature connected with elimination of noise and artifacts. Analyzing sensitivity, however, it is easy to notice that the highest value is obtained for signal 105, which is also characterized by a significant amount of noise.
Conclusions
The aim of the presented solution is to create a simple and effective method joining features and advantages of the sparse representation of the analyzed ECG signal with classification attributes of the modeled neural network. The sparse representation ensures elimination of minor distortions, noise, and artifacts in the process of adaptive decomposition with the use of defined redundant dictionaries. It also constitutes the basis for optimal selection of the features. However, the parameters modeled in the experimental process and the neural network structure allow obtaining satisfactory detective attributes of the QRS complexes in the analyzed ECG signal. The solution emerged in the aforementioned way can be accepted as a new approach not present in the field literature yet.
This article presents the use of machine learning techniques for analysis and anomaly detection in ECG signals. This process was performed in two steps. The first stage was sparse decomposition of signal on the grounds of redundant dictionaries of base functions. Two types of dictionaries were tested. The first included elements that were analytical base functions, and the second presented essential components of an ECG signal searched by means of the K-SVD algorithm. The sparse representation of a signal, however, was performed in an adaptive manner, with the use of the matching pursuit algorithm. In each step of the MP or OMP algorithm, we made a linear signal decomposition in respect of features belonging to the dictionary with redundancy in order to find the relevant structural characteristics of the processed ECG signal. In the second stage, we used the method of detection of the QRS complex using multivariate unidirectional neural network with backpropagation of error. Elements from sparse decomposition in the first stage constitute data for the exploited neural network. To facilitate such a solution, we tested the selection of the right architecture of the neural network and the impact of specific activation functions on the recognition results. Anomaly detection was realized by estimation of the elements’ energy of the ECG signal’s sparse representation in the area of the structure of the found QRS.
As the result of the conducted experiments, the elements that were defined are the required parameters’ set, the optimal structure, and essential features of the proposed solution. At the preprocessing step, the signal’s sparse representation was realized as adaptive decomposition to the fifth level, copying over 90% of the ECG signal. Due to such an approach, the noise, disturbances, and artifacts were eliminated, and the QRS structure was highlighted in the analyzed ECG signal. The best results of the adaptive decomposition were obtained for the OMP method and for a dictionary formed by means of the modified (through decorrelation of selected atoms) K-SVD algorithm. So, the created set of features (coefficients and their corresponding dictionary atoms) constituted the optimal input vector for the properly adjusted neural network structure. As the network model, in the experimental process, we adopted the unidirectional, three-layer neural network with 40 neurons in the hidden layer. The detection threshold was established at the level of , and the tangesoidal activation function was adopted.
It is worth noticing that the conducted research did not confirm the viewpoint functioning in the field literature that a network with a smaller number of neurons has a better generalization ability, because, in the presented solution, number 40 constitutes the middle value of the analyzed set of hidden layers.
Performance of the proposed method was tested with the use of a public free base of ECG signals from the MIT-BIH Arrhythmia Database. The obtained experimental results confirmed high efficiency of the presented method of anomaly detection in the analyzed ECG signals.
References
- Addison, P. S., J. N. Watson, G. R. Clegg, M. Holzer, F. Sterz, and C. E. Robertson. 2000. Evaluating arrhythmias in ECG signals using wavelet transforms. IEEE Engineering in Medicine and Biology 19 (5):104–109. doi:10.1109/51.870237.
- Aharon, M. L., M. Elad, and A. Bruckstein. 2006. K-SVD: An algorithm for designing overcomplete dictionaries for sparse representations. IEEE Transactionson Signal Processing 54:4311–4322. doi:10.1109/TSP.2006.881199.
- Al-Fahour, A. S., and I. Howitt. 1999. Combine wavelet transform and radial basic neural networks for classifying life-threatening cardiac arrhythmias. Medical and Biological Engineering Computational 37:566–573. doi:10.1007/BF02513350.
- Alfaouri, M., and K. Daqrouq. 2008. ECG signal denoising by wavelet transform thresholding. American Journal of Applied Sciences 5 (3):276–281.
- Augustyniak, P. 2001. Przetwarzanie sygnałów elektrodiagnostycznych. AGH Uczelniane Wydawnictwo Naukowo – Dydaktyczne. AGH Kraków.
- Berkhin, P. 2006. A survey of clustering data mining techniques. In Grouping multidimensional data, eds. J. Kogan, C. Nicholas, M. Teboulle, Springer, 25–71.
- Besterman, E., and R. Creese. 1979. Waller – pioneer of electrocardiography. British Heart Journal 42 (1):61–64. doi:10.1136/hrt.42.1.61.
- Celler, B. G., and P. de Chazal. 1998. Low computational cost classifiers for ECG diagnosis using neural networks. In Proceedings of the annual international cong. IEEE engineering in medicine and biology society, 1337–1340. IEEE.
- Daskalov, I. K., and H. Christov. 1999. Electrocardiogram signal preprocessing for automatic detection of QRS boundaries. Medical Engineering and Physics 21:37–44. doi:10.1016/S1350-4533(99)00016-8.
- Davis, D., S. Mallat, and M. Avellaneda. 1997. Adaptive greedy approximations. Journal of Constructive Approximation 13:57–98. doi:10.1007/BF02678430.
- de Chazal, P., M. O’Dwyer, and R. B. Reilly. 2004. Automatic classification of heartbeats using ECG morphology and heartbeat interval features. IEEE Transactions on Biomedical Engineering 51 (7):1196–1206. doi:10.1109/TBME.2004.827359.
- de Chazal, P., and R. B. Reilly. 2000. A comparison of the use of different wavelet coefficients for the classification of the electrocardiogram. Paper presented at Proceedings of the 14th International Conference on Pattern Recognition, September 3–8, 2000, Barcelona.
- Durka, P. 1996. Time-frequency analyses of EEG. Ph.D. dissertation, Institute of Experimental Physic, Warsaw University.
- Einthoven, W. 1924. The string galvanometer and the measurement of the action currents of the heart. Nobel Lecture. Republished in 1965 in Nobel Lectures, Physiology or Medicine 1921–1941. Amsterdam: Elsevier.
- Elad, M. 2010. Sparse and redundant representations: From theory to applications in signal and image processing. Springer New-York.
- Gabor, D. 1946. Theory of communication. Journal of Institution Electrical Engineering 93 (26):429–457.
- Gharavi-Alkhansari, M., and T. S. Huang. 1998. A fast orthogonal matching pursuit algorithm. The presented at International Conference on Acoustics Speech and Signal Processing, May 15, Seattle, Washington. 1389–1392.
- Hamilton, P. S., and W. J. Tompkins. 1988. Adaptive matched filtering for QRS detection, engineering in medicine and biology society. In Proceedings of the Annual International Conference of the IEEE 4–7:147–148. IEEE.
- Harikumar, R., and S. N. Shivappriya. 2011. Analysis of QRS detection algorithm for cardiac abnormalities – A review. International Journal of Soft Computing and Engineering 1 (5):2231–2307.
- Hassani, M., I. Fachrudin, and M. Hubin. 1994. Pattern recognition of ECG wavesforms using wavelet transform experimental results in the sudden infant death syndrome monitoring. MPBE 94 Conference 2:212–216.
- Hsiung, H. S. H., C. K. Cheng, and G. J. Jan. 1989. A real-time QRS detection and delineation algorithm based on the inflection angle of the ECG waveform. In Proceedings of the annual international conference of the IEEE engineering 9-12, 138–139. IEEE.
- Jost, P., P. Vandergheynst, and P. Frossard. 2005. Tree-based pursuit: algorithm and properties. Signal Processing Institute Technical Report, TR-ITS-2005.013, Swiss Federal Institute of Technology Lausanne (EPFL), Switzerland.
- Kwiatkowski, W. 2003. Wstęp do cyfrowego przetwarzania sygnałów. Wydawnictwo Wojskowej Akademii Technicznej, Warszawa, Poland.
- Liu, Q., Q. Wang, and L. Wu. 2004. Size of the dictionary in matching pursuit algorithm. IEEE Transactions on Signal Processing 52 (12):3403–3408. doi:10.1109/TSP.2004.837423.
- Mallat, S., and W. L. Hwang. 1992. Singular detection and processing with wavelets. IEEE Transaction on Information Theory 38:6. doi:10.1109/18.119727.
- Mallat, S., and Z. Zhang. 1993. Matching pursuit with time-frequency dictionaries. IEEE Transactions on Signal Processing 41:3397–3415. doi:10.1109/78.258082.
- MIT-BIH Arrhythmia Database. 2010. [Online]. www.physionet.org/physiobank/database/mitdb (accessed on 15.12.2015).
- Muller, B., J. Reinhardt, and M. T. Strickland (1995). Neural networks: An introduction. vol. 1 in Physics of Neural Networks, Berlin, Heidelberg: Springer-Verlag.
- Natarajan, B. K. 1995. Sparse approximate solutions to linear systems. SIAM Journal of Computation 24:227–234. doi:10.1137/S0097539792240406.
- Okajima, K. 1998. The Gabor function extracts the maximum information from input local signals input local signals. Neural Networks 11:435–439. doi:10.1016/S0893-6080(98)00008-2.
- Osowski, S., L. Tran Hoai, and T. Markiewicz. 2004. Support vector machine-based expert system for reliable heartbeat recognition. IEEE Transaction on Biomedical Engineering 51 (4):582–589. doi:10.1109/TBME.2004.824138.
- Pan, J., and W. J. Tompkins. 1985. A real-time qrs detection algorithm. IEEE Transactions on Biomedical Engineering 32 (3):230–236. doi:10.1109/TBME.1985.325532.
- Pati, Y. C., R. Rezaiifar, and P. S. Krishnaprasad. 1993. Orthogonalmatching pursuit: Recursive function approximation with applications to wavelet decomposition. Asilomar Conference on Signals, Systems and Computers 1:40–44.
- Poli, R., and S. Cagnoli. 1995. Genetic design of optimum linear and non-linear QRS detection. IEEE Translation Biomedical Engineering 42:1137–1141. doi:10.1109/10.469381.
- Rubinstein, R., M. Bruckstein, and M. Elad. 2010. Dictionaries for sparse representation modeling, Proceedings of the IEEE 98:1045–1057.
- Sanamdikar, S. T., S. T. Hamde, and V. G. Asutkar. 2015. A literature review on arrhythmia analysis of ECG Signal. International Research Journal of Engineering and Technology 2 (3):307–312.
- Shyu, L. Y., Y. H. Wu, and W. Hu. 2004. Using wavelet transform and fuzzy neural networks for VPC detection from the Holter ECG. IEEE Transaction on Biomedical Engineering 51 (7):1269–1273. doi:10.1109/TBME.2004.824131.
- Srinagesh, M., P. Sarala, and K. D. Aparna. 2013. ECG wireless telemetry. International Journal of Engineering and Innovative Technology 2 (8):75–78.
- Tang, X., and S. Lan. 2014. A frame work of automatic analysis system of electrocardiogram signals. International Journal of Signal Processing. Image Processing and Pattern Recognition 7 (2):211–222. doi:10.14257/ijsip.2014.7.2.20.
- Troop, J. A. 2004. Greed is good: Algorithmic results for sparse approximation. IEEE Transactions on Information Theory 50 (10):2231–2242.