
ABSTRACT
Passenger flow forecasting is an essential part of transportation systems. Neural networks in the transportation field have been applied to passenger demand prediction. In this paper, we developed two hybrid methods, known as parlimentary optimization algorithm-artificial neural network (POA-ANN), and intelligent water drops algorithm-ANN (IWD algorithm-ANN). In addition, we applied the proposed algorithms to illustrate the effect of precise prediction for passenger queues. We mainly focus on predicting passenger demand by comparing the genetic algorithm-ANN (GA-ANN) with POA-ANN and IWD-ANN. The results of prediction methods suggest that both POA-ANN and IWD-ANN provide a better forecasting performance, which is obtained via mean square error (MSE), than GA-ANN in the field of passenger flow prediction. This study illustrates that the newly adopted algorithms exhibit good performance for passenger prediction.
Introduction
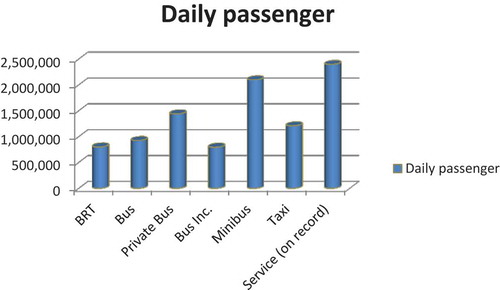
Istanbul is the biggest urban settlement area. It has a huge cultural, commercial, educational, historical, and strategically location prominence. Istanbul has played the role of a bridge between Europe and Asia in many ways (Aydin, Celik, and Gumus Citation2015).The data gathered from Turkish Statistical Institute (TUIK 2014) show that the population of Istanbul was 14.377.018 in 2014 and that Istanbul has the highest population density in Turkey as well. Above all, according to TUIK, Istanbul’s population will exceed 16 M by the year of 2023. There is a necessity to develop an enhanced model for predicting ridership distributions and set up a more accurate operation for both ridership and Bus Rapid Transit (BRT) (Chen et al. Citation2004; Khosravi et al. Citation2011; Van Lint Citation2006) by considering recent developments. Public transport travelers expect a better public transportation for buses, bus rapid transits (BRT) and rail transit lines. Moreover, shows the daily passenger in Istanbul. Besides, the prominence of passenger prediction in BRT is seen in .
The precise prediction of passenger flow in a BRT system is anticipated to minimize operation cost and improve bus service quality by properly allotting the constrained resources. In particular, demand prediction is a prerequisite for an effective proactive real-time bus operation management. A large number of methods have been proposed in the context of passenger flow forecasting, subject to the implementation type and the conceptual output (Tirachini, Hensher, and Rose Citation2013; Ceder et al. Citation2013; Vlahogianni, Golias, and Karlaftis Citation2004). Mostly, a single hidden layer and 5–10 hidden neurons have been performed in the research papers (Ma et al. Citation2014; Guan, Shen, and Wang Citation2002; Xie et al. Citation2014; Mazloumi et al. Citation2011; Wei and Chen Citation2012; Yu, Lam, and Tam Citation2011; Jeong and Rilett Citation2004; Yuen et al. Citation2013; Celebi, Bolat, and Bayraktar Citation2009; Özuysal, Tayfur, and Tanyel Citation2012; Lin et al. Citation2013; Chien, Ding, and Wei Citation2002). Detailed reviewed papers are shown in .
Table 1. Reviewed papers in the field of public transport.
This paper performed intelligent water drops algorithm-ANN (IWD-ANN), parliamentary optimization algorithm-ANN (POA-ANN), and genetic algorithm-ANN (GA-ANN). GA-ANN is performed to compare the performance with POA-ANN and IWD-ANN since it has been applied in several prediction studies. The IWD algorithm has been applied successfully in various areas such as vehicle routing and job scheduling (Kamkar, Akbarzadeh-T, and Yaghoobi 2010; Niu, Ong, and Nee Citation2012). POA was developed by (Borji and Hamidi Citation2009) and applied in several fields. However, POA has not been performed with ANN so far. Thus, the integration of POA and ANN is implemented in this study. This paper aims not only to illustrate the benefit of precise prediction based on ANN also newly-adopted algorithms, IWD-ANN and POA-ANN, can offer better solutions than GA-ANN that is studied in many studies.
This paper illustrated that the implementation of the IWD algorithm or POA with ANN should be considered to predict passenger flow. Moreover, IWD-ANN and POA-ANN have given satisfactory results in other fields.
The main findings of the paper are as follows: Firstly, IWD algorithm, which is performed in the training phase, illustrated that hybrid IWD-ANN should be applied for prediction and forecasting. Moreover, hybrid IWD-ANN has never been applied in the training phase until now, which is why it has been applied in this paper. Secondly, like IWD-ANN, POA-ANN can be applied for prediction and forecasting as well. Additionally, POA-ANN takes more time than IWD-ANN to reach the optimal passenger prediction. Thirdly, POA-ANN and IWD-ANN outperformed GA-ANN in predicting the number of the expected passengers, while POA-ANN provided slightly better results than IWD-ANN. A multivariate analysis, which is performed via SPSS, proves the significant difference between hybrid methods.
The rest of this paper is organized as follows: Firstly, the methodology is presented and consisted of the structure of GA-ANN, POA-ANN and IWD-ANN. In addition, it presents the prediction performance of all related algorithms for the given stations. Secondly, the case study is presented. Thirdly, the experimental results with regard to three different hybrid algorithms are presented. Finally, the all findings are summarized.
Methodology
In this section, POA-ANN, IWD-ANN and GA-ANN are presented. Their tuning parameters and performance values are also shown.
Parliamentary optimization-ANN
Parliamentary elections have mainly two systems: the majority election system and the proportional representation system. Only one member of a parliament is elected per constituency for the majority election system. A number of members of the parliament are elected per constituency for the proportional representation system. Basically, every political party gives a list of candidates. Voters then choose the list of their favorite parties. Parties are allocated parliamentary seats in proportion to the number of votes they win in elections (Shourie Citation2007).
POA begins with first generating a population of individuals. These individuals are presumed to be the members of the parliament. After initializing the population randomly, the population is divided into desired political groups and then a fixed number of members with the utmost fitness are chosen as group candidates.
In the next step, intra-group opposition occurs. In the intra-group opposition phase, each regular member is leant to all candidates with regard to their fitness values. Mean square error (MSE) is chosen as a fitness function in this study. This process is carried out by the phenomenon that a regular member of a party is generally under the influence of other senior members and is illustrated in Equation (1) (Borji and Hamidi Citation2009). Here, is a regular member,
is a candidate, and
is the updated position (value) of the regular member
where represents the bias parameter, determined randomly. This monitoring is shaped as the weighted average of distance vectors from a regular member to candidates. This provides the evolutionary course to seek possible points in searching space. At the end of the intra-party contention, candidates with the utmost fitness are chosen as ultimate candidates of each group. Equation (2) presents the calculation of the power of each group (Borji and Hamidi Citation2009):
where is the member weighting constant and
is the candidate weighting constant. Candidates in a group compete with candidates of other groups in the next stage. Both candidates (
) and regular members (
) of a group are significant in detecting the whole power of a group. A weighted linear integration of the average power of candidates and the average power of regular members is regarded as the total fitness of a group (Borji and Hamidi Citation2009). All parameters required in this algorithm have been presented in .
Table 2. Parameters of POA based ANN.
The pseudo code for POA-ANN is presented in . (1) describes the static parameters. The data are read in line (2) and normalized in line (3). The next command line (4) generates initial population weights. The above commands are especially required in ANN. In order to form initial groups, populations (weights) are partitioned into divisions in (5.1). Regular members of a group are inclined to candidates after interactions happen between candidates and regular members in (5.3–5.4). (5.5) calculates the power of the remaining regular members of a group since stronger groups may merge into one group to strengthen their powers in (5.6). However, if merging is not available, the next iteration is undertaken.
Table 3. Pseudo code for POA-ANN.
As previously mentioned, stronger groups may join and merge into one group to increase their power. This property can avoid missing the best solution that can be positioned in other groups except for the most powerful group. A random number is generated for the merge operation. The most powerful groups are merged into one if the generated random number is less than pm.
Intelligent water drops-ANN
The sources of inspiration for the IWD algorithm are water drops that flow in riverbeds, lakes, and seas. The flowing mechanism is more obvious in riverbeds, which reach the destination to lakes, seas, or oceans in spite of many distinct kinds of blocks on their ways. In the water drops of a river, the gravitational force of the earth provides the movement for flowing toward the destination. If there were no obstacles, the water drops would trace an uncurved path toward the destination, which is the shortest path from the source to destination. However, because of different kinds of difficulties in their way to the destination the real path must not be similar to the ideal path and lots of twists and turns in the river’s path are observed (Shah-Hosseini Citation2008). The IWD algorithm has been applied successfully in various areas such as vehicle routing and scheduling (Kamkar, Akbarzadeh-T, and Yaghoobi 2010; Niu, Ong, and Nee Citation2012; Shourie Citation2007).
Suppose an IWD is in the layer and moves to the next layer
. The weight on the arc between these two layers, declared by
, is used for updating the velocity
of the IWD by:
In Equation (3), the updated velocity of the IWD at the next layer is represented by
. Furthermore,
,
, and
fixed parameters that are used for updating the velocity of water drop in layer j.
where is reached by
is used to keep velIWD away from zero in Equation (4). The static parameter
is a small positive value. Here,
Consider that a local distance function is used for an IWD to move from one layer to another. The distance function is determined by the length between two sequential layers. The time taken for an IWD having the velocity
to move from the current layer
to the next layer
is represented by
in Equation (5)
is the weight that the IWD with velocity
removes from the synapses between layer
and
in Equation (6).
,
, and
are static velocity parameters that are subject to the given problem. The value
was defined in Equation (5) and represents the time taken for the IWD to flow from
to
Later, an IWD proceeds from layer to layer
. The weight
during the synapse between the two layers is lowered in Equation (7).
and
are arbitrary positive numbers that should lie between 0 and 1
The IWD that moves from layer to
increases the weight
by
in Equation (8). Here,
is the hidden neuron number and
the input parameter number. All static parameters for IWD are given in .
Table 4. Parameters of IWD-based ANN.
The pseudo code for IWD-ANN is presented in . Line (1) describes the static parameters. The data are read in line (2) and normalized in line (3). The next command line (4) generates the initial population weights. The above commands are especially required in ANN. Line (5) calculates the initial output. The IWD velocity and time are computed in (6.1–6.2). (6.3–6.4) calculates the removed soil and the remaining soil after IWD moves from layer to
. Line (6.5) computes the new updated weights with respect to Equation (7).
Table 5. Pseudo code for IWD-ANN.
GA-ANN
Genetic Algorithms were devised to imitate some of the processes observed in natural evolution. GAs constitute a competitive set of solutions and then the solution develops through the process of natural selection, where poor solutions run out and better solutions survive to reproduce. This process is repeated until the optimal solution is reached. A hybrid GA-based neural network is basically a back-propagation network, with the only exception being that the weight matrix was acquired from performing the genetic operations under optimal convergence conditions. Diverse options such as population, fitness scaling, selection, reproduction, mutation, crossover, and migration need to be specified before running a GA (Kadiyala, Kaur, and Kumar Citation2013). Hybrid genetic-ANN has been exerted successfully in various areas such as prediction, fault detection, and global optimization (Dybowski et al. Citation1996; Chow et al. Citation2002; Jack and Nandi Citation2002; Elsayed, Sarker, and Essam Citation2014). All related parameters are presented in .
Table 6. Parameters of GA based ANN.
Case study
Passenger flow data were acquired from Istanbul Electricity Tramway and Tunnel establishment (I.E.T.T). I.E.T.T works under Istanbul metropolitan municipality. The acquired data belong to the passengers in BRT. These data have been exerted in order to train the ANN with regard to input parameters. Three different hybrid algorithms have been run ten times and the average values of MSE and were acquired from ten trials. POA-ANN and IWD-ANN have been run on a computer that has a 32-bit Windows 7 operating system, 2.4-GHz processor, and 16-GB memory. POA-ANN and IWD-ANN have been implemented in the C programming language and GA-ANN in Matlab 7.12.
Performance measurement
The training process aims to reach the least MSE, which is defined as the average squared error between the ANN predictions and the actual values of passenger arrival time, as shown below.
Let be the predicted value, let
be an actual value, and
be the number of output neurons (Zhao et al. Citation2011).
ANN topology
Four input parameters, including temperature, weather, working day, activity state of station, and an output, which is the passenger flow prediction, have been used. The same number of hidden neurons have been chosen for all hybrid methods with regard to Ward systems (Frederick Citation1996). The data of case study has 125 instances. 100 and 25 instances are chosen for training and testing, respectively.
where ,
,
, and
are the number of neurons in the hidden layer, number of input parameters, number of output and number of training samples, respectively. Here,
. The numbers of 3–12 hidden neurons have been tried in order to obtain both the best MSE and the most suitable pattern.
Experimental results
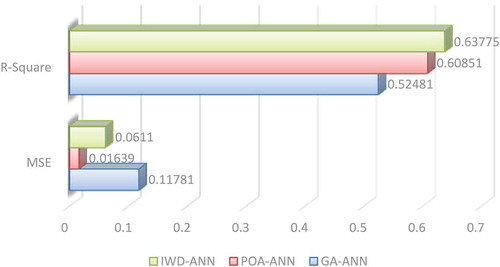
Three developed hybrid methods, namely GA-ANN, POA-ANN, and IWD-ANN, have been experimented to determine the best passenger forecast performance. In , the ANN which has the least MSE is the POA-ANN, with a MSE value of 0.01639. MSE values for the three hybrid algorithms with respect to different sample sizes are presented in Appendices A–C. values for the three hybrid algorithms are presented in Appendices D–F.
Table 7. Comparison of the three hybrid ANNs with respect to MSE and .
In , GA-ANN has the worst performance in terms of both MSE and . Mainly, MSE has been exerted to compare these hybrid algorithms but
has been presented in order to illustrate the fitness degree. In terms of
IWD-ANN has outperformed POA-ANN and GA-ANN, but the one that has the least MSE is POA-ANN. While POA-ANN offers the least MSE, it takes the longest time to reach optimal value. IWD-ANN reaches the optimal value in the least possible time.
Figure 1. Daily passenger amount in Istanbul (except the rail transit).
POA-ANN and IWD-ANN have outperformed GA-ANN in predicting the number of expected passengers, and its results with regard to different sample sizes are presented in . Although, POA-ANN and IWD-ANN show very similar results, it can be said that POA-ANN is slightly better than IWD-ANN.
Figure 2. Graphical representation of the three hybrid algorithms with respect to MSE and .
A multivariate analysis has been performed to investigate whether a meaningful difference between test subjects, which include POA-ANN, IWD-ANN, and GA-ANN, is present via SPSS. It is easily seen that a meaningful difference between methods is obtained since the significance level for both MSE and is less than 0.05 (). However, a meaningful difference between the number of neurons and sample size is not available in terms of MSE and
. This study aims to illustrate the significant difference between hybrid methods, thus the results found in demonstrate the importance of this study.
Figure 3. The number of the expected passengers for hybrid algorithms with regard to different sample sizes.
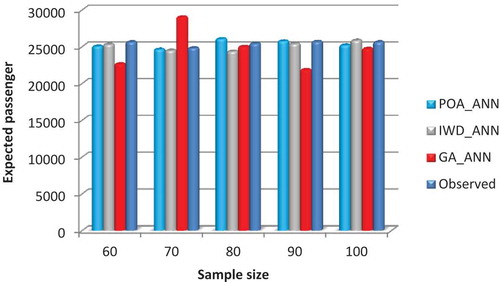
Table 8. Multivariate tests of the three hybrid ANNs with respect to MSE and .
The effect of the interaction between the parameters on the ANNs’ performance is clearly seen in . Interaction between the two parameters, number of neurons and sample size, has less effect on other components that are provided in .
Table 9. The effect of interaction between the parameters on the ANNs’ performance.
Conclusion
The importance of passenger prediction for the Istanbul BRT system cannot be disregarded since it has an intense passenger demand, more than 800 K a day. There is a requirement to develop an improved model for predicting passenger flow distribution and set up more accurate operations in terms of both ridership and BRT agency. In order to achieve this requirement, GA-ANN, POA-ANN, and IWD-ANN, have been exerted and compared with regard to both MSE and to predict passenger demand. The findings of this paper are summarized as follows:
The IWD algorithm has been used successfully in various areas such as vehicle routing and scheduling (Kamkar, Akbarzadeh-T, and Yaghoobi 2010; Niu, Ong, and Nee Citation2012; Shourie Citation2007). The IWD algorithm exerted in the training phase has illustrated that hybrid IWD-ANN can be applied for prediction and forecasting. In addition, IWD-ANN has the least MSE and offers quick prediction. Moreover, hybrid IWD-ANN has never been applied in the training phase until now.
POA has been only used as a global optimization algorithm (Borji and Hamidi Citation2009). Thus, this hybrid algorithm has never been applied in the training phase until now. Like IWD-ANN, POA can be applied not only for prediction and forecasting but also for obtaining the least MSE. Unlike IWD-ANN, POA-ANN takes more time to reach the optimal prediction.
The hybrid IWD-ANN may be applied more effectively to less complicated data. It provides not only a good prediction, but also saves time. IWD-ANN still has the potential to be improved and to be a more powerful tool for prediction and forecasting. Therefore, the improvement of IWD-ANN may encourage the researchers to intensify the exploration on this algorithm.
POA-ANN and IWD-ANN outperformed GA-ANN in predicting the number of the expected passengers. While POA-ANN and IWD-ANN have shown similar results, it is seen that POA-ANN is slightly better than IWD-ANN.
A multivariate analysis, which has been performed via SPSS, has proved that the significant difference between hybrid methods is meaningful. Moreover, interaction between the two parameters, number of neurons and sample size, has less effect on the other components ().
The hybrid algorithms that have been exerted in this paper can be applied in diverse areas such as clustering, in addition to prediction and forecasting, in the future. Moreover, other hybrid algorithms, such as fruit fly optimization algorithm (Li et al. Citation2013) that has been applied in power load forecasting and particle swarm optimization (Ren et al. Citation2014) that has been applied in wind speed forecasting, can be experimented with POA-ANN and IWD-ANN.
References
- Aydin, N., E. Celik, and A. T. Gumus. 2015. A hierarchical customer satisfaction framework for evaluating rail transit systems of Istanbul. Transportation Research Part A: Policy and Practice 77:61–81.
- Borji, A., and M. Hamidi. 2009. A new approach to global optimization motivated by parliamentary political competitions. International Journal of Innovative Computing, Information and Control 5 (6):1643–53.
- Ceder, A., S. Hassold, C. Dunlop, and I. Chen. 2013. Improving urban public transport service using new timetabling strategies with different vehicle sizes. International Journal of Urban Sciences 17 (2):239–58. doi:10.1080/12265934.2013.776287.
- Celebi, D., B. Bolat, and D. Bayraktar. 2009. Light rail passenger demand forecasting by artificial neural networks. Proceedings of the International Conference on Computers and Industrial Engineering, IEEE, 239–43.
- Chen, M., X. Liu, J. Xia, and S. I. Chien. 2004. A dynamic bus‐arrival time prediction model based on APC data. Computer‐Aided Civil and Infrastructure Engineering 19 (5):364–76. doi:10.1111/mice.2004.19.issue-5.
- Chien, S. I. J., Y. Ding, and C. Wei. 2002. Dynamic bus arrival time prediction with artificial neural networks. Journal of Transportation Engineering 128 (5):429–38. doi:10.1061/(ASCE)0733-947X(2002)128:5(429).
- Chow, T. T., G. Q. Zhang, Z. Lin, and C. L. Song. 2002. Global optimization of absorption chiller system by genetic algorithm and neural network. Energy and Buildings 34 (1):103–9. doi:10.1016/S0378-7788(01)00085-8.
- Dybowski, R., V. Gant, P. Weller, and R. Chang. 1996. Prediction of outcome in critically ill patients using artificial neural network synthesised by genetic algorithm. The Lancet 347 (9009):1146–50. doi:10.1016/S0140-6736(96)90609-1.
- Elsayed, S. M., R. A. Sarker, and D. L. Essam. 2014. A new genetic algorithm for solving optimization problems. Engineering Applications of Artificial Intelligence 27:57–69. doi:10.1016/j.engappai.2013.09.013.
- Frederick, M. 1996. NeuroShell 2 manual. Ward Systems Group Inc.
- Guan, W., J. Shen, and W. Wang. 2002. Using S-ANN method to forecast the ridership of Beijing public transportation. International Conference on Traffic and Transportation Studies, Guilin, China, 877–82.
- Jack, L. B., and A. K. Nandi. 2002. Fault detection using support vector machines and artificial neural networks, augmented by genetic algorithms. Mechanical Systems and Signal Processing 16 (2–3):373–90. doi:10.1006/mssp.2001.1454.
- Jeong, R., and L. R. Rilett. 2004. Bus arrival time prediction using artificial neural network model. The 7th International IEEE Conference, 988–93. doi:10.1109/ITSC.2004.1399041.
- Kadiyala, A., D. Kaur, and A. Kumar. 2013. Development of hybrid genetic-algorithm-based neural networks using regression trees for modeling air quality inside a public transportation bus. Journal of the Air and Waste Management Association 63 (2):205–18. doi:10.1080/10962247.2012.741054.
- Kamkar, I., M. R. Akbarzadeh-T, and Yaghoobi. 2010. Intelligent water drops a new optimization algorithm for solving the vehicle routing problem. Proceedings of the IEEE International Conference on Systems Man and Cybernetics (SMC), IEEE, 4142–6.
- Khosravi, A., E. Mazloumi, S. Nahavandi, D. Creighton, and J. W. C. Van Lint. 2011. A genetic algorithm-based method for improving quality of travel time prediction intervals. Transportation Research Part C: Emerging Technologies 19 (6):1364–76. doi:10.1016/j.trc.2011.04.002.
- Li, H. Z., S. Guo, C. J. Li, and J. Q. Sun. 2013. A hybrid annual power load forecasting model based on generalized regression neural network with fruit fly optimization algorithm. Knowledge-Based Systems 37:378–87. doi:10.1016/j.knosys.2012.08.015.
- Lin, Y., X. Yang, N. Zou, and L. Jia. 2013. Real-time bus arrival time prediction: Case study for Jinan, China. Journal of Transportation Engineering 139 (11):1133–40. doi:10.1061/(ASCE)TE.1943-5436.0000589.
- Ma, Z., J. Xing, M. Mesbah, and L. Ferreira. 2014. Predicting short-term bus passenger demand using a pattern hybrid approach. Transportation Research Part C: Emerging Technologies 39:148–63. doi:10.1016/j.trc.2013.12.008.
- Mazloumi, E., G. Rose, G. Currie, and S. Moridpour. 2011. Prediction intervals to account for uncertainties in neural network predictions: Methodology and application in bus travel time prediction. Engineering Applications of Artificial Intelligence 24 (3):534–42. doi:10.1016/j.engappai.2010.11.004.
- Niu, S. H., S. K. Ong, and A. Y. C. Nee. 2012. An improved intelligent water drops algorithm for achieving optimal job-shop scheduling solutions. International Journal of Production Research 50 (15):4192–205. doi:10.1080/00207543.2011.600346.
- Özuysal, M., G. Tayfur, and S. Tanyel. 2012. Passenger flows estimation of Light Rail Transit (LRT) system in Izmir, Turkey using multiple regression and ANN Methods. PROMET-Traffic and Transportation 24 (1):1–14. doi:10.7307/ptt.v24i1.264.
- Ren, C., N. An, J. Wang, L. Li, B. Hu, and D. Shang. 2014. Optimal parameters selection for BP neural network based on particle swarm optimization: A case study of wind speed forecasting. Knowledge-Based Systems 56:226–39. doi:10.1016/j.knosys.2013.11.015.
- Shah-Hosseini, H. 2008. Intelligent water drops algorithm: A new optimization method for solving the multiple knapsack problem. International Journal of Intelligent Computing and Cybernetics 1 (2):193–212. doi:10.1108/17563780810874717.
- Shourie, A. 2007. The parliamentary system: What we have made of it, what we can make of it. Rupa&Co.
- Tirachini, A., D. A. Hensher, and J. M. Rose. 2013. Crowding in public transport systems: Effects on users, operation and implications for the estimation of demand. Transportation Research Part A: Policy and Practice 53:36–52.
- Turkish Statistical Institute. 2014. http://www.turkstat.gov.tr/Start.do ( accessed August 27, 2015).
- Van Lint, J. W. 2006. Reliable real-time framework for short-term freeway travel time prediction. Journal of Transportation Engineering 132 (12):921–32. doi:10.1061/(ASCE)0733-947X(2006)132:12(921).
- Vlahogianni, E. I., J. C. Golias, and M. G. Karlaftis. 2004. Short‐term traffic forecasting: Overview of objectives and methods. Transport Reviews 24 (5):533–57. doi:10.1080/0144164042000195072.
- Wei, Y., and M. C. Chen. 2012. Forecasting the short-term metro passenger flow with empirical mode decomposition and neural networks. Transportation Research Part C: Emerging Technologies 21 (1):148–62. doi:10.1016/j.trc.2011.06.009.
- Xie, M. Q., X. M. Li, W. L. Zhou, and Y. B. Fu. 2014. Forecasting the short-term passenger flow on high-speed railway with neural networks. Computational Intelligence and Neuroscience. doi:10.1155/2014/375487.
- Yu, B., W. H. Lam, and M. L. Tam. 2011. Bus arrival time prediction at bus stop with multiple routes. Transportation Research Part C: Emerging Technologies 19 (6):1157–70. doi:10.1016/j.trc.2011.01.003.
- Yuen, J. K. K., E. W. Lee, S. M. Lo, and R. K. Yuen. 2013. An intelligence-based optimization model of passenger flow in a transportation station. Intelligent Transportation Systems, IEEE Transactions On 14 (3):1290–300. doi:10.1109/TITS.2013.2259482.
- Zhao, S. Z., T. H. Ni, Y. Wang, and X. T. Gao. 2011. A new approach to the prediction of passenger flow in a transit system. Computers and Mathematics with Applications 61 (8):1968–74. doi:10.1016/j.camwa.2010.08.023.
Appendix A. Mean square values of POA-ANN with regard to two different parameters.
Appendix B. Mean square values of IWD-ANN with regard to two different parameters.
Appendix C. Mean square values of GA-ANN with regard to two different parameters.
Appendix D. R square values of POA-ANN with regard to two different parameters.
Appendix E. R square values of IWD-ANN with regard to two different parameters.
Appendix F. R square values of GA-ANN with regard to two different parameters.