
ABSTRACT
Support Vector Machine (SVM) is a supervised learning algorithm widely used in data classification problems. However, the quality of the solution is related to the chosen kernel function, and the adjustment of its parameters. In the present study we compare a genetic algorithm (GA), a particle swarm optimization(PSO), and the grid-search in setting the parameters and C of SVM. After running some experimental tests based on the prediction of protein function, it is concluded that all algorithms are suitable to set the SVM parameters efficiently, yet grid-search runs up to 6 times faster than GA and 30 times faster than PSO.
Introduction
Support Vector Machine (SVM) is a supervised learning algorithm widely used in data classification problems such as medical diagnosis (Conforti and Guido Citation2010), image recognition (Guo, Li, and Chan Citation2000), decision making (SangitaB and Deshmukh Citation2011), public safety (Kianmehr and Alhajj Citation2008), and bioinformatics (Resende et al. Citation2012). When compared to other classifiers, the SVM stands out for its capacity to solve linear and non-linear binary classification problems. It finds a hyperplane which will distinguish between the input data in the support vector.
Choosing the kernel function and its parameters are important in computing the similarity between the input patterns and its representation in the vector space of SVM. A variety of meta-heuristics have been chosen to adjust the SVM parameters, where we cite the evolutionary algorithms and their utility in solving multi-goal problems (Quang, Zhang, and Li Citation2002).
The Genome project has enabled the identification of several proteins. However, the majority of these proteins have unknown functions. Knowing the protein function brings benefits in health and industry. For instance, it aids in the design of new medicines and the development biofuels (Pandey, Kumar and Steinbach Citation2006). Due to the importance of the knowledge of protein’s function in biological and industrial contexts, computational techniques are an alternative to the costly laboratorial tests of crystallography and x-ray.
The purpose of this paper is to analyze a Genetic Algorithm (GA), Particle Swarm Optimization (PSO), and the grid-search heuristic in adjusting the SVM parameters. The experiments were conducted in the prediction of protein function context.
Firstly, “Background” section presents the SVM, GA, PSO and Grid-search concepts and also shows the analyzed enzymes in this work. The “Related works” section covers some similar works which used GA and PSO in adjusting the SVM parameters. The “Materials and Methods” section describes the databases considered in this study, the procedures adopted in adjusting the parameters and the SVM quality assessment metrics. The “Results” section discusses the main results. Finally, the “Conclusions” presents the final considerations.
Background
Non-linear SVM
The SVM algorithm is based on the statistical learning theory whose principle is structural risk minimization. The goal of SVM is to find a hyperplane that separates the input examples in different classes in the training set, and that maximizes the distance between such sets through the optimal hyperplane (Huang and Wang Citation2006).
The learning algorithm developed in (Vapnik and Lerner Citation1963) was created to work only with a linearly separable dataset or dataset that had an approximately linear distribution. Nevertheless, the authors realized that a hyperplane was not capable of separating the training data in some applications. Thus, in 1992 the non-linear SVM was created (Boser, Guyon, and Vapnik Citation1992).
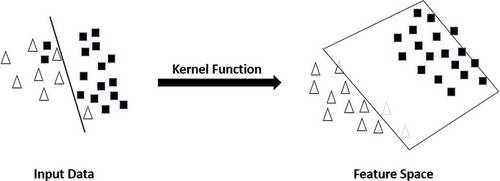
Support Vector Machine works with some non-linear classification problems through a kernel function that performs the mapping of the training dataset on the input space to a feature space as can be seen in (Ben-Hur and Weston Citation2010). illustrates a mapping to a feature space performed by a kernel function.
Figure 1. Mapping of the input data to a feature space through kernel function. Adapted from Elmezain et al. (Citation2009).
Let it be a kernel function K that receives two points and
in the input vector and performs the dot product of these data in the feature space (Herbrich Citation2001). Consider
:
a mapping such that X is the input space and
is the feature space. Choosing an appropriate
makes the training set mapped in
separable by a linear SVM Equation (1):
It is extremely important to choose an appropriate kernel function and adjust its parameters, since these are directly related to the results found by the classifier (Resende et al. Citation2012). The most commonly used kernels are polynomial, Gaussian (RBF), and sigmoidal. Moreover, each kernel function has parameters that have to be set by the user. presents examples of used kernel functions and their free parameters.
Table 1. The most used kernel functions.
When the polinomial kernel is called linear. The
parameter determines the width of Gauss function. The parameters
e k of sigmoidal kernel describe the scale of the input data (when
), and the mapping threshold, repectively.
The penalty parameter C has to be set by the user as well. It allows the user to control the the tradeoff between errors on training data and margin maximization (Rychetsky Citation2001). Hence, by choosing a small value for C, the number of training errors will increase. On the other hand, a large value of C will lead to hard margin SVM (Joachims Citation2002).
GA and elitism
The GAs are stochastic mathematical algorithms based on the natural selection principles discovered by Charles Darwin. GA is a meta-heuristic that accounts for a search and optimization technique inspired by genetic recombination (Srinivas and Patnaik Citation1994). Algorithm 2.2 describes the steps of a simple GA with the use of elitism.
Algorithm 1:
Genetic Algorithm with Elitism
1: Create a random population of chromosomes;
2: Calculate fitness of each chromosome;
3: while termination criteria is not reached do
4: Select chromosomes;
5: Do Crossover;
6: Mutate;
7: Elitsm;
8: Calculate fitness of each chromosome;
9: end while
In line 1 the algorithm creates a random population where each chromosome represents a possible solution to the problem. Its codification is generally in bits. Line 2 uses an objective function, which evaluates each chromosome by setting a value (fitness) that represents its chance to survive in the next generation. In line 4 the algorithm selects the chromosomes (according to a probability tax previously set) that will be the input to the crossover step. Line 5 crosses the chromosomes that were selected previously. This step involves a genetic recombination where the offsprings inherit features (genes) of their parents. In line 6, the algorithm modifies some bits of a chromosome (according to a mutation probability) to raise the diversity of the population. When creating a new population through crossover and mutation steps, chromosomes with high value of fitness might dissapear. To overcome this problem, chromosomes with best values of fitness are inserted in the new population, which is done in line 7. The last step is to evaluate the chromosomes of the new population (line 8). Lines 4–8 are repeated until a stop criteria is reached by the algorithm.
PSO
Particle swarm optimization was created by Kennedy (Kennedy and Eberhart Citation1995) and its main aim was to simulate a social behavior of birds mathematically. Later on, the authors found out that with few modifications, the model could be used as an optimization heuristic. Algorithm 2.3 shows the steps followed by a simple PSO.
Algorithm 2:
Particle Swarm Optimization
1: Initialize swarm position;
2: Initialize swarm speed;
3: Calculate fitness of each particle;
4: while termination criteria is not reached do
5: Update swarm speed;
6: Update swarm position;
7: Calculate fitness of each particle;
8: end while
Line 1 creates a particle swarm randomly in the search space. Line 2 initializes the speed array of each particle in the swarm. In line 3 an objective function caluculates the fitness of each particle. In line 5 each particle speed is calculated according to Equaion (2):
where k is the current iteration; is the particle speed; w is the inertia factor that controls the impact of the previous speed at the current speed of the particle;
and
are random numbers that prevent the particle from getting stuck in a local optimum.
and
are confidence parameters that indicate the importance of social and cognitive knowledge of the swarm. That is, when
, it is given greater relevance to the individual particle knowledge and, when
, greater importance is given to the knowledge of the swarm. In the literature, usually
=
so there is a balance between the individual and global knowledge of a particle in the swarm (Shi Citation2004);
is the position of particle i;
is the best fitness of a particle calculated so far;
is the best fitness calculated by a particle i in the swarm. Line 6 updates each particle position according to Equation (3):
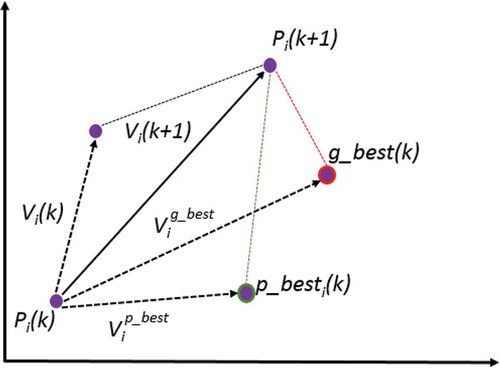
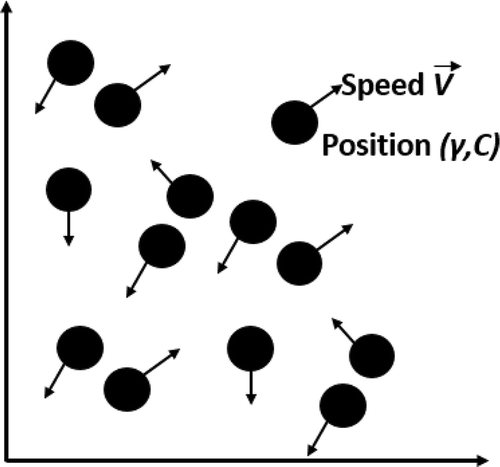
Thereby, an optimal solution in PSO is obtained by a result of its current speed V, an acquired knlowdge by the particle itself (), and the learning acquired from the community (
), as said in (Hassan, Cohanim, and De Weck Citation2005) and illustrated in .
Figure 2. Updating the speed and position of a particle. Adapted from Hassan, Cohanim, and De Weck (Citation2005).
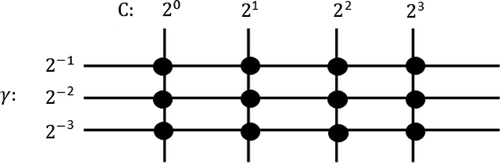
Grid-search
Grid-search is a heuristic consisting of a grid that performs different combinations of parameters based on a search range. Together with SVM, this heuristic adjusts the e C parameters by testing exponential sequences of values found during the exhaustive search (Chang and Lin Citation2011).
The optimality of a grid-search solution is directly related to the selected step. Thus, the smaller the chosen step, the more refined the solution is. shows how grid-search works.
Figure 3. Grid-search with step of 1.
Enzymes
Enzymes are proteins that act as catalysts of biochemical reactions. They are capable of accelerating the biochemical process without being consumed during the process. The number of molecular transformations of the enzymes measure their efficiency as catalysts (Nelson and Cox Citation2017).
According to criteria established by the International Union of Biochemistry and as shown in (Dobson and Doig Citation2005) and (Nelson and Cox Citation2017), enzymes have six classes: 1) Oxidoreductases: catalyze electron transfer reactions, that is, oxidation reactions. 2) Transferases: are enzymes that catalyze group transfer between molecules and such functional grouping could be amine, phosphate, acyl, etc. 3) Hydrolases: catalyze the hydrolysis of several bonds. 4) Lyases: cleave bonds C-C, C-O, C-N through hydrolysis and oxidation. 5) Isomerases: perform catalysis interconversion reactions between optical or geometrical isomers. 6) Ligases: are enzymes that catalyze reactions of synthesizing a new molecule from the binding between two molecules, with concomitant ‘Adenosine triphosphate (ATP) hydrolysis.
Each described enzyme receives a number of classification, known as Enzyme Commission(EC), according to the International Union of Biochemistry and Molecular Biology. This number is formed by 4 digits: 1) class; 2) subclass within the class; 3) specific chemical groups participating in the reaction; 4) the enzyme itself.
Related works
In (Zhou, Maruatona, and Wang Citation2011) the authors adjusted the SVM parameters by using a GA with an improvemnt of genetic operators which they called IO-GA. It was done to avoid the premature convergence of the meta-heristic.The tests were executed using five datasets from the 0 database and the results show that SVM had a better performance by using the proposed methodology.
The authors in (İlhan and Tezel Citation2013) developed a GA to select the Single Nucleotide Polymorphism labels. Moreover, they used a PSO heuristic to adjust the C and parameters of SVM. For the tests, the authors defined a swarm of 20 particles, confidence values (
and
) equal to 2, and an inertia value of 1. These values were chosen after several trial and error tests.
In (Ren and Bai Citation2010) the authors compared a GA and a PSO in adjusting the parameters of SVM. They investigated how the population size influences the solution found by both meta-heuristics. In the experiments, the population size varies from 10 to 30 chromosomes, and the conclusion is that both GA and PSO, are suitable for adjusting the SVM parameters at an acceptable computational cost compared to grid-search.
Materials and methods
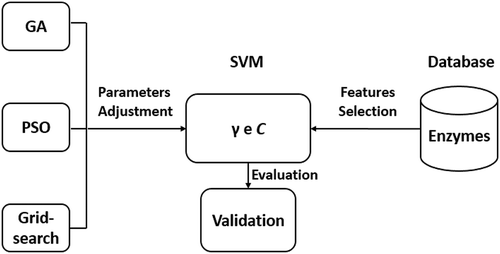
Genetic algorithm and particle swarm optimization heuristics were written in C due to the fact that theses heuristics run together with the C-SVM developed by (Chang and Lin Citation2011). Since the goal of this work is to compare the GA, PSO, and grid-search in adjusting the C e, the search space varies from 0.03125 to 65536 for the C parameter and from 0.000030517578125 to 8 for
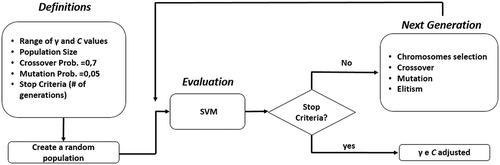
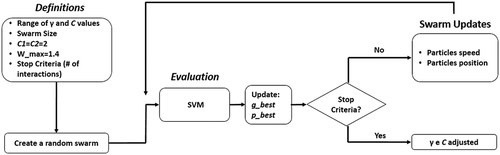
. ilustrates the flowchart of the methodology used in the present work.
Figure 4. Flow chart of the adopted methodology.
Database
This work used the same set of proteins utilized by (Leijôto et al. Citation2014) to evaluate the GA, PSO, and grid-search heuristics. These proteins were extracted from Protein Data Bank (Berman et al. Citation2000), a databank of 3D proteins, nucleic acids, and other molecules. presents the quantity of enzymes of each class used to run the tests.
Table 2. Classes of enzymes.
In (Leijôto et al. Citation2014) the authors selected 11 physicochemical features of enzymes using a GA; with this method, they reached a precision of 71% in the classification. To adjust the SVM parameteres, the authors utilized the grid-search heuristic.
The selected physicochemical features utilized in (Leijôto et al. Citation2014) were obtained from Sting_DB. This database was created by the Computational Biology Laboratory of Embrapa Brazil and contains a variety of features extracted from the structures that build a protein. Among the feature sets available, the authors used the physicochemical features through the Java Protein Dossier (Neshich et al. Citation2004) which owns a total of 338 features for each amino acid.
GA-SVM
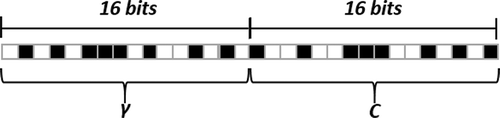
To better represent the value of each parameter, we used a 32-bit array where the first 16 bits represent the parameter.The remaining bits represent the cost parameter. shows the chromosomal representation of the GA population.
Figure 5. Cromossome representation.
After calculating the fitness of each chromosome, individual chromosomes were chosen from a population for later breeding. Roulette wheel selection was the method used to select the genomes that will participate in the crossover step, and work as follows: first, it sum the fitness of all chromosomes in the population (sum); after that, it generates a random value in the interval ; finally, the method travels into all population and sums the fitness of each chromossome starting from 0. When the sum reaches a value greater than the random value, the chromosome is chosen to take part in the genetic recombination. As has been noted, the greater the fitness of a chromosome, the greater its chance to be chosen (Srinivas and Patnaik Citation1994).
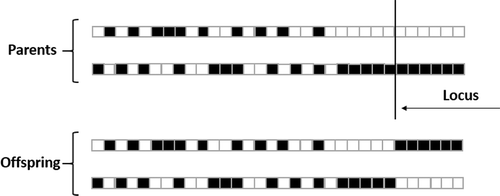
The one-point crossover technique was chosen for the genetic recombination due to the fact it presented the best results in the experiments compared to other crossover techniques tested. The literature recomends a crossover probability between 60% and 90% and after several trial and error tests, 70% of the individuals had the chance to breed in the present work. shows the one-point crossover technique which was adopted.
Figure 6. One-point crossover technique.
The probability of mutation should be less than the probability of crossover according to empirical studies. These studies also recommend a probability of mutation between 0.01% and 0.05%. As the purpose of mutation in a GA is preserving and introducing diversity, we adpoted a probability of 0.05%. A flowchart of GA-SVM operation is shown in .
Figure 7. GA-SVM.
PSO-SVM
A particle in the PSO developed in the present work is represented by an array of components as seen in . The first and second components of the array hosts the and C parameters in the search space, respectively.
Figure 8. Particle representation in PSO.
As seen in (Hassan, Cohanim, and De Weck Citation2005), the self confidence () should vary in the range
and the swarm confidence (
) should stay in the interval
. This work found out that
provided the best convergence rate while running trial and error experiments. The inertia weight w was calculated according to a fraction of the number of interactions and the inferior and superior bounds of 0.4 and 1.4, respectively. SVM calculates the fitness of each genome so as to update the
and
values. illustrates the flowchart of the PSO running together with SVM.
Figure 9. PSO-SVM.
Validation and evaluation
The k-fold cross-validation was the method utilized in the present study and works as follows: first, the method partitions the original sample into k subsets of same size; after that, a single subset is retained for testing the model, and the remaining subsets are used as training data; and finally, the cross-validation process is repeated k times, where all subsets are used as training and testing data, independently (Huang and Wang Citation2006).
To measure the performance of the classifier, three metrics were used: precision, sensitivity, and F-measure:
Precision: The percentage of selected classes of proteins that are correct, see Equation (4).
Recall: The percentage of correct classes of proteins that are selected, see Equation (5).
F-measure: A harmonic mean of precision and sensitivity, see Equation (6).
where TP = True Positives, TN = True Negatives, FP = False Positives e FN = False Negatives.
Results and discussion
This section presents the results obtained from the adopted methodology. A comparison of the heuristics GA, PSO, and grid-search was conducted by analyzing the execution time and the average accuracy between all classes of enzymes. It also presents a comparison of the present study with the work developed in (Leijôto et al. Citation2014) according to the evaluation metrics of precision, recall, and F-measure. Waikato Environment for Knowledge Analysis (Hall et al. Citation2009)) was used to simulate the rating when running the experiments.
The experiments were conducted as follows: to both GA and PSO a combination between the population/swarm size and the generations/iterations number were performed 10 times for each combination. The quantity of representatives in GA and PSO varied in a range of 20, 40, 60, 80, and 100. The termination criteria in both heuristics varied in a range of 10, 20, and 30 iterations. In order to compare the perfomance of the heuristics, the best cases of GA, PSO, and grid-search were used in the tests. The tests were conducted on Ubuntu Linux workstation with Intel(R) Core(TM) i7-2600 CPU @ 3.40 GHz.
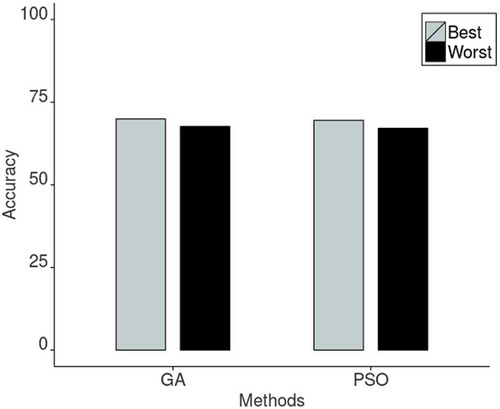
shows the results of avarage accuracy for GA and PSO meta-heuristics. The best accuracy values were obtained with and
considering the GA implemented; and
and
in the PSO case. From it is observed GA reached an average accuracy of 71% approximately with a population size of 100 chromosomes and the termination criteria set up for 30 generations. The best case of GA has a better performance than the best case of PSO, when it took GA 1604 seconds to finish the execution and 1784 seconds for PSO. also shows that the worst case of GA was higher (in accuracy and performance) than the worst case of PSO. In this case, a difference of approximately 0.6% of mean accuracy was computed and GA had a speedup of 3 compared to the performance of PSO.
Figure 10. Average accuracy of GA and PSO (best and worst cases).
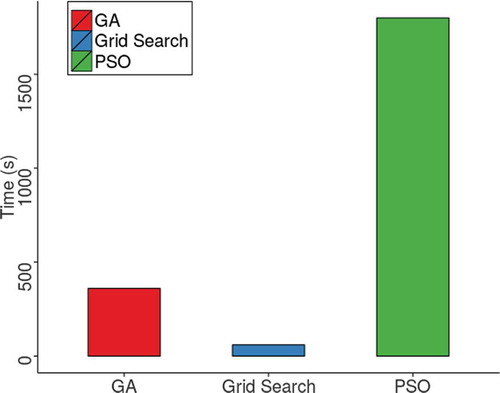
illustrates the average execution time between the GA, PSO, and grid-search heuristics. It is noticed that grid-search with a step of 2 achieved a better performance followed by GA and PSO with a time of execution equal to 6 and 30 minutes, respectively. All heuristics had an average accuracy of 70% approximately.
Figure 11. Average time of execution of GA, Grid-search, and PSO.
presents the the evaluation metric results of GA and PSO heuristics compared to the values found in (Leijôto et al. Citation2014). The authors in (Leijôto et al. Citation2014) utilized grid-search to adjust the SVM parameters. The avarage precision obtained was 71% for all proposed heuristics. The Ligases contributed to the precision rate because among 15 proteins classified as belonged to the Ligases, 12 were correctly classified on the GA and PSO execution. Among 145 proteins predicted as belonged to the Transferases, 54 were mistakenly classified in this class on the execution of GA. In this manner, Transferases precision was only 61% for GA and 62% for PSO, approximately. GA, PSO, and Grid-search reached an average recall of 68%. Lyases had the lowest recall (57%) for both GA and PSO, where 26 out of 60 Lyases were misclassified as belonging to other classes of enzymes. As a result, the F-measure achieved an avarage of 70% with GA and 69% in the execution of PSO.
Table 3. Comparative evaluation metrics.
Conclusion
In this study, a GA, a PSO, and the grid-search were implemented, and we observed that all heuristics are suitable in adjusting the SVM parameters. When considering the ease of implementation and performance, grid-search is highly recommended in the prediction of protein function context.
As a future work, we propose the use of parallelism along the evolutionary algorithms implemented, as this proposal may contribute to the average performance of the heuristics. In the context of the prediction of protein function, a combined implementation of both GA and the PSO can be used for the selection of features of proteins and the adjustment of the parameters of SVM. The use of GA and PSO for adjusting the parameters of another classifier, for instance artificial neural networks, is also discussed as a proposal for future work.
References
- Ben-Hur, A., and J. Weston. 2010. A User’s guide to support vector machines. In Data mining techniques for the life sciences, Humana Press, Totowa, NJ, 223–39. Springer.
- Berman, H. M., J. Westbrook, Z. Feng, G. Gilliland, T. N. Bhat, H. Weissig, I. N. Shindyalov, and P. E. Bourne. 2000. The protein data bank. Nucleic Acids Research 28(1):235–42. doi:10.1093/nar/28.1.235.
- Boser, B. E., I. M. Guyon, and V. N. Vapnik. 1992. A training algorithm for optimal margin classifiers. Proceedings of the 5th Annual Workshop on Computational Learning Theory, (COLT’92), 144–52. New York, NY: ACM.
- Chang, -C.-C., and C.-J. Lin. 2011. LIBSVM: A library for support vector machines. ACM Transactions on Intelligent Systems and Technology 2:27:1–27:27.
- Conforti, D., and R. Guido. 2010. Kernel based support vector machine via semidefinite programming: Application to medical diagnosis. Computers and Operations Research 37 (8):1389–94. Operations Research and Data Mining in Biological Systems.
- Dobson, P. D., and A. J. Doig. 2005. Predicting enzyme class from protein structure without alignments. Journal of Molecular Biology 345 (1):187–99.
- Elmezain, M., A. Al-Hamadi, O. Rashid, and B. Michaelis. 2009. Posture and gesture recognition for human-computer interaction. In-tech, Advanced Technologies, Kankesu Jayanthakumaran (Ed.), InTech, doi: 10.5772/8221. Available from: https://www.intechopen.com/books/advanced-technologies/posture-and-gesture-recognition-for-human-computer-interaction.
- Guo, G., S. Z. Li, and K. L. Chan. 2000. Face recognition by support vector machines. Proceedings of 4th IEEE International Conference on Automatic Face and Gesture Recognition, Grenoble, France, 196–201. doi: 10.1109/AFGR.2000.840634
- Hall, M., E. Frank, G. Holmes, B. Pfahringer, P. Reutemann, and I. H. Witten. 2009. The weka data mining software: An update. ACM SIGKDD Explorations Newsletter 11 (1):10–18.
- Hassan, R., B. Cohanim, and O. de Weck. 2005. Comparison of particle swarm optimization and the genetic algorithm. Proceedings of 46th AIAA/ASME/ASCE/AHS/ASC Structures, Structural Dynamics, and Materials Conference, number AIAA-2005-1897. Austin, TX: American Institute of Aeronautics and Astronautics. doi: http://dx.doi.org/10.2514/6.2005-1897.
- Herbrich, R. 2001. Learning kernel classifiers: Theory and Algorithms. Cambridge, MA, USA: MIT Press.
- Huang, C.-L., and C.-J. Wang. 2006. A ga-based feature selection and parameters optimizationfor support vector machines. Expert Systems with Applications 31 (2):231–40.
- İlhan, İ., and G. Tezel. 2013. A genetic algorithm–support vector machine method with parameter optimization for selecting the tag snps. Journal of Biomedical Informatics 46 (2):328–40.
- Joachims, T. 2002. Learning to classify text using support vector machines: Methods, theory and algorithms. Norwell, MA, USA: Kluwer Academic Publishers.
- Kennedy, J., and R. C. Eberhart. 1995. Particle swarm optimization. Proceedings of the IEEE International Conference on Neural Networks, vol. 4, Perth, WA, Austrália, 1942–48. doi: 10.1109/ICNN.1995.488968.
- Kianmehr, K., and R. Alhajj. 2008. Effectiveness of support vector machine for crime hot-spots prediction. Applied Artificial Intelligence 22 (5):433–58.
- Leijôto, L. F., T. A. O. Rodrigues, L. E. Zárate, and C. N. Nobre. 2014. A Genetic Algorithm for the Selection of Features Used in the Prediction of Protein Function. IEEE 14th International Conference on Bioinformatics and Bioengineering, Boca Raton, FL, USA, 168–74. doi: 10.1109/BIBE.2014.42.
- Nelson, D. L., and M. M. Cox. 2017. Lehninger Principles of Biochemistry. 7a edition. WH Freeman and Company.
- Neshich, G., W. Rocchia, A. L. Mancini, M. E. Yamagishi, P. R. Kuser, R. Fileto, C. Baudet, I. P. Pinto, A. J. Montagner, J. F. Palandrani, et al. 2004. Javaprotein dossier: A novel web-based data visualization tool for comprehensive analysis of protein structure. Nucleic Acids Research 32 (suppl 2):W595–W601.
- Pandey, G., V. Kumar, and M. Steinbach. 2006. Computational approaches for protein function prediction: A survey. Technical report, TR06-028. University of Minnesota, Minneapolis, MN. Available in http://cs-dev.umn.edu/sites/cs.umn.edu/files/tech_reports/06-028.pdf. Accessed in 26-04-17
- Quang, A. T., Q.-L. Zhang, and X. Li. 2002. Evolving support vector machine parameters. Proceedings of the First International Conference on Machine Learning and Cybernetics, Brijing, IEEE Computer Society Press, Silver Spring, MD, pp. 548–551. doi: 10.1109/ICMLC.2002.1176817.
- Ren, Y., and G. Bai. 2010. Determination of optimal svm parameters by using ga/pso. Journal of Computers 5 (8):1160–68.
- Resende, W. K., R. A. Nascimento, C. R. Xavier, I. F. Lopes, and C. Nobre. 2012. The use of support vector machine and genetic algorithms to predict protein function.. IEEE International Conference on Systems, Man, and Cybernetics (SMC), COEX, Seoul, Korea, 1773–1778. doi: 10.1109/ICSMC.2012.6377994
- Rychetsky, M. 2001. Algorithms and architectures for machine learning based on regularized neural networks and support vector approaches. Berlin, Germany: Shaker Verlag GmbH.
- Sangita, B, P., and S. R. Deshmukh. 2011. Use of support vector machine, decision tree and naive bayesian techniques for wind speed classification. Proceedings of the International Conference on Power and Energy Systems (ICPS), Chennai, 1–8. doi: 10.1109/ICPES.2011.6156687.
- Shi, Y. 2004. Particle swarm optimization. IEEE Connections 2 (1):8–13.
- Srinivas, M., and L. Patnaik. 1994. Genetic algorithms: A survey. Computer 27 (6):17–26.
- Vapnik, V., and A. Lerner. 1963. Pattern recognition using generalized portrait method. Automation and Remote Control. 24 (6):774–80.
- Zhou, J., O. O. Maruatona, and W. Wang. 2011. Parameter optimization for support vector machine classifier with IO-GA. Proceedings of the 1st International Workshop on Complexity and Data Mining (IWCDM), Nanjing, Jiangsu, 117–20. IEEE. doi: 10.1109/IWCDM.2011.34.