
ABSTRACT
Word spotting is the answer to the question whether the document contains the user’s query word. One of the main challenges of keyword spotting at the testing stage is that some testing non-classes are not included in training classes. Hence, this paper presents a robust handwritten word-spotting method for handwritten documents using genetic programming (GP). Using this technique, a tree is created as a classifier which separates the target class (keyword) from the other classes (non-keyword). The new components of the proposed classifier include proper chromosome and new classification fitness function. The proposed chromosome was based on the relationship between features and each chromosome (tree) mapped the features to a real number. Then, a margin was obtained from the real number. To evaluate the generality of the proposed method, several experiments have been designed and implemented on three standard datasets (namely IFN/ENIT Arabic for Arabic, IFN/Farsi for Persian, and George Washington for English). The results of experiments carried out on these three datasets show that the proposed method has much higher precision and recall than previous methods
Introduction
The hugeness of the amount of historical handwritten documents in traditional libraries with different languages has been a challenge in the field of information extraction and retrieval (Rath Citation2003a; Rothfeder Citation2003; Ye Citation2015). The main cause of this issue is that these huge collections need to be indexed. These indexes are usually established as hand transcriptions of documents or by producing an index pen from their digital version (Rath Citation2003a; Rothfeder Citation2003). This method is acceptable for small volumes of documents, but not for large volumes of documents (Murugappan Citation2011; Rath Citation2003a). Therefore, it is essential to study the information retrieval of handwritten document datasets. An effective and efficient information retrieval approach retrieves the documents related to the user’s query from among huge volumes of documents.
Handwritten word spotting is an approach that allows the user to search for keywords in handwritten documents.
Keyword spotting was first introduced for machine-printed texts (Doermann Citation1998) and then for online (Jain Citation2003) and offline (Blessy Varghese Citation2015; Huang Citation2011) handwritten texts. Keyword spotting in handwritten documents is the main core of searching that helps all the relevant samples of user’s hypothetical query in a pictorial document in any languages to be retrieved. Therefore, studies gradually moved toward this technique, a technique that performs information retrieval without the full conversion of document to text (ASCII code). Many studies have been conducted on this technique, based on the apparent information of image without its full conversion to text. Keyword spotting has several advantages over Optical Character Recognition (OCR). The first is that computational expenses are decreased dramatically in comparison with OCR and text line transcription. The second is that this technique does not need linguistic information for retrieval. Therefore, it is appropriate when no linguistic information is available. The third advantage of keyword spotting is that, compared to OCR, it is appropriate for low-quality documents such as noised documents and historical handwritten documents (Antonacopoulos Citation2007; Cheriet Citation2012; Fernández Citation2011; Moghaddam Citation2009; Saykol Citation2004; Shahab Citation2006).
Two main approaches for handwritten keyword spotting are template-based (Manmatha Citation1996) and learning-based approaches (Al-Khayat Citation2014; David Citation2005; Rodríguez-Serrano Citation2009). In the former, word image query is compared to a collection of words saved in the dataset and the system of images with the highest similarity is shown to the user. These methods do not need a training step and are not appropriate where labeled data are not available. These methods are mostly useful for single-writer problems and have very little generalizability to multi-writer problems. Also, for each query, only a restricted number of word images that are indexed in the dataset are retrievable. These methods cannot be extended to several languages easily (Ball Citation2006; Saabni Citation2008; Sagheer Citation2010; Sari Citation2002). Nowadays, learning-based approaches train a statistical model by applying statistical learning methods and then do the keyword query based on the built scoring model.
The trained models have more generalizability in comparison to the pictorial template, and have the ability to spot optional words out of the lexicon (Fischer Citation2012; Haji Citation2012). These methods can also be generalized to other languages easily (Wshah Citation2012). However, they need numerous training templates (Rodríguez-Serrano Citation2009).
Different classifiers have been used to create a model in learning-based approaches, including Hidden Markov Model (HMM) (Fischer Citation2010, Citation2012; Wshah Citation2012), and Recurrent Neural Network (RNN) (Frinken 2012) and Support Vector Machine (SVM) (Al-Khayat Citation2014). However, none of the classifiers have been based on genetic programming. The main challenge of keyword spotting is that some classes are only present during the training process; however, some classes and non-classes are present in the testing process. The issue gets more complicated since the frequency of non-classes is far greater than the frequency of the classes. None of the above-mentioned classifications has considered the issue from the perspective of keyword spotting. Most of these methods were proposed to enhance the precision within post-processing and during a separate phase called score normalization. The method presented in this study, however, would solve the problem during the learning phase.
In the present paper, we propose a novel word-spotting system for handwritten text that is based on genetic programming. Given that a large number of keywords(classes) in the test process are not included in the train process for the keyword spotting, a GP-based method which is called one to other is presented to solve this problem. A tree is built for each keyword during the train process. In the testing process, if the output is positive, the test data will also be included in this class and if the tree output is negative, the test data won’t be included in this keyword class. One of the advantages of the proposed method is its being language-independent. Different tests were performed on three languages (including Latin, Arabic, and Farsi) in Section 5 and the parameters and operators available in the model were examined. The results were evaluated and compared with important and authentic methods. According to the results of tests on the three languages, the proposed method is independent of the language type and achieves acceptable results.
Genetic programming is a method used for optimization problems (Shenoy et al. Citation2005; Stejic, Takama, and Hirota Citation2004). This method is graph-based. It evaluates and returns the best graph which corresponds to the problem solution through using fitness function. The graphs are recovered over several successive generations by genetic operators. The genetic crossover operator is used to obtain a new graph out of two parent graphs; therefore, it performs a search across the parent spaces. The genetic mutation operator can change the sub-graphs in a graph; therefore, it prevents trapping in local minimum. The most important innovation for the problems which are solved based on this method is the proper problem modeling using a graph as well as offering fitness functions corresponding to the problem. Modeling graph problems is one of the difficulties and challenges of the problems which are solved based on GP. Modeling must be analyzed. The fitness function should be able to use the problem and specify a better graph.
The remainder of the paper is organized as follows. Section 2 discusses the related work. Section 3 presents the proposed method. Section 4 presents a discussion of the proposed method. The experimental validation of the system is reported in Section 5 and finally conclusions and future works are presented in Section 6.
Related works
Originally, word spotting was expressed for spotting words in speech messages (Rose Citation1990), and then extended to detect words in machine-printed documents (Doermann Citation1998). In Manmatha (Citation1996) it was first proposed for offline handwritten documents, as a method to automatically index historical document groups.
As it was mentioned in the Introduction Section, keyword-spotting methods are divided into two categories: learning-based and template-based.
In the template-based methods, keyword spotting in handwritten documents is performed by an image-matching operation between one or a number of keyword queries and sets of indexed word images in a dataset (Rath Citation2003a, Citation2003b). In this method, the results are obtained based on a similarity measure between the user’s query and the candidate word images, and there is no training.
In template-based methods, the features of two images are matched. Features include binary (Zhang Citation2003), Gabor (Hangarge Citation2016), scale-invariant feature transform (SIFT) (Rusinol Citation2011; Rusiñol Citation2014), global word shape (Belongie Citation2002; Srihari Citation2005), moment-based (Bhardwaj Citation2008), profile-based (Rath Citation2003a, Citation2003b, Citation2003c), impact-based (Jain Citation2003), discrete Cosine Transform (Adamek Citation2007), Histogram of Gradient’s (Terasawa Citation2009), geometric gradient (Saabni Citation2011a), bag of visual words (Aldavert Citation2015), grapheme graph (Riba Citation2015), and Blurred Shape Model-Based Descriptors (Fornés Citation2011). The sliding window is used in some of methods such as Rodrıguez (Citation2008). The sliding window moves from the left to the right of the image and a sequence of features such as gradient (Rodrıguez Citation2008) is extracted that is used in Dynamic Time Wrapping (DTW) matching. One of the advantages of using the sliding window is that the nature of left to right (or right to left) writing is kept in it. DTW is used for calculating the distance of two time-series.
Here, some significant studies in this regard are presented. To solve the multiple-writer problem in keyword spotting, the learning-based methods are used. In this category, a significant training dataset is required for training operations. In learning-based methods, different classifiers such as HMM (David Citation2005; Fischer Citation2010, Citation2012), RNN (Frinken 2012), hierarchical classifiers (Al-Khayat Citation2014) are used to develop models. Each of the methods is briefly discussed below.
The hidden Markov model is a statistical model applied for recognizing keywords in documents by training a model in the letter or word level (David Citation2005; Fischer Citation2010, Citation2012; Rodríguez-Serrano Citation2012). The hidden Markov model in the letter level trains each letter; a model is made for each letter, and the word model is made after concatenating the letter models. In the word model, a training lexicon of words is trained and then the scoring for users’ query is done according to the trained model.
Example of keyword spotting for the word “résiliation” (translated as “cancellation”) is presented in .
Figure 1. Word spotting example.
Proposed method
In this paper, a new method for handwritten text keyword spotting is developed using the genetic programming. In the proposed method, a tree is generated for each keyword using the genetic programming. The generated tree is a function of the best features driven from the feature set and each of the tree leaf displays a feature. Function (tree) output is a positive (+) or negative (−) value. The positive value indicates that the test word belongs to the class; however, the negative value shows that the test word is not the class member. In a general phase, if the test word does not belong to any of the classes (keywords) and there is a negative output per tree, the final output is also a negative value. This means that the word is not included as a keyword. If there are positive outputs for several classes in some cases, the output with the largest positive value will be considered since the greatest distance from the point of separation has the positive class. Local gradient histogram (LGH) (Rodrıguez Citation2008)and Gabor (Hangarge Citation2016) is used in experiments as features. The proposed method and different methods are compared based on existing features. Finally, stochastic filter feature-selection algorithm (Liu and Motoda Citation1998; Dash and Liu Citation1997) was used to select a subset of features in order to reduce the dimensions because of a great number of features and the high complexity of the training process. illustrates the overall block diagram of the proposed method. It is discussed in following sections.
Figure 2. Overview of the proposed handwritten word-spotting system.

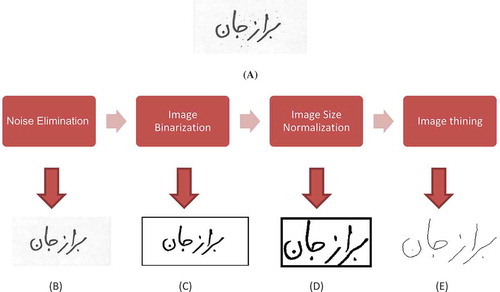
Preprocessing
Preprocessing of word images includes four main steps: primarily, noise is eliminated by a Gaussian filter on word images; then, word images are binarized by Otsu Binarization algorithm (Lam September 1992). This technique runs the Binarization algorithm through the histogram of the image by class variance minimization between the background and foreground pixels.
This method is based on the pixels of an image that are separated into two classes: C0 (e.g. objects) and C1 (background) and by a threshold T. C0 denotes pixels with gray level [1 … T] and C1 denotes pixels with gray level [T + 1, …, L]. The gray level histogram is normalized and regarded as a probability distribution (Equation (1)):
Where (weights) are the probabilities of the two classes and variances of classes. According to Otsu, minimizing intra-class variance is the same as maximizing inter-class variance (Equation (2)):
Which is expressed in terms of class probabilities and class means
which in turn can be updated iteratively.
In the next step, we determine the top, bottom, left, and right limits of the word in the window, and crop the word from that window in order to determine the box around it. This is done so that we are able to remove the white pixels around the word as much as possible, and insert the word in the center of the image in order to extract the features from different images monotonically.
Finally, the word image becomes thin by the thinning algorithm (Lam, September 1992). Given that words are not related to the thickness of the written line and the extracted feature must be robust against thickness.
The preprocessing steps for the image word (“Borazjan”)  (from IFN/ENIT Farsi database) are shown in .
Figure 3. (A) Original image, (B) noise elimination, (C) image binarization, (D) image size normalization, and (E) image thinning.
Feature extraction
To demonstrate the proposed method explained in Section 4, two well-known features were implemented and assessed. Those features which had been previously used in modeling handwritten words (Rodríguez-Serrano Citation2009, Citation2012) were selected to be used in this section. The features include LGH (Rodrıguez Citation2008) and Gabor (Hangarge Citation2016) and are described below:
Local gradient histogram features
LGH (Rodrıguez Citation2008) was first presented by Rodriguez and Perronnin. This feature is better than other usual features. Extraction procedures for this algorithm are shown in .
Figure 4. (a) Feature extraction process (Rodrıguez Citation2008) and (b) angular bins for T = 8 and angle differences of (x, y) to the two closest bins.
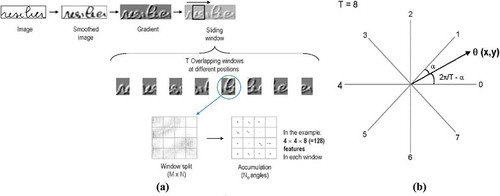
First a Gaussian filter is applied to a word image to obtain the smoothed image
. From
, the horizontal and vertical gradient components
and
are determined as Equations (3) and (4):
and
Then, the gradient magnitude m and direction are obtained for each pixel with coordinates
as Equations (5) and (6):
and
Where is a function that returns the direction of the vector
in the range
. by taking into account
and the signs of
and
.
A sliding window of fixed width traverses the image from left to right to obtain a sequence of overlapping sub-images of word parts. Each sub-image is further reduced to the region actually containing pixels and this region is subdivided into 4 × 4 regular cells. From all the pixels in each cell, a histogram of gradient orientations is constructed. We consider T = 8 orientations. Each pixel contributes to the closest bin with an amount m(x, y). Alternatively, the two closest orientations can share the amount m(x, y) as determined by a linear interpolation to reduce the impact of aliasing noise (see ). The concatenation of the 4 × 4 histograms of 8 bins gives rise to a 128-dimensional feature vector for each window position. Each feature vector is scaled to have norm1.This operation can be related to a local contrast normalization and significantly improves performance in practice.
Gabor feature
The Gabor feature (Al-Khayat Citation2014) is applied for the recognition and spotting of handwritten words by Khayyat. In the Gabor feature, there is no need for the binarization of images and it is very resistant against the noise. According to Equation (7), a two-dimensional Gabor filter is a complicated sinusoidal page that is defined by a Gaussian function in the space domain as shown below:
In Equation (7), is the Gabor filter’s wavelength, ϕ is the Gabor filter’s direction,
and
are the standard deviations in the directions of x and y, and
and
are defined as follows:
According to Equations (8) and (9), the Gabor filter is selected based on the wavelength and direction of the original signal.
Feature selection
In this paper, a stochastic filter feature-selection algorithm was used for feature selection (Hiroshi Liu 2012).
LVF (Las Vegas Filter) is a Las Vegas algorithm for filter feature selection. LVF (Liu and Motoda Citation1998) contains a random method that produces random subsets of features and an evaluation method that checks if each subset satisfies the chosen metric. The emergent property of the two methods in LVF is the best subset of features. The evaluation metric used in LVF is the Inconsistency rate. One of the two factors is an allowed inconsistency rate that can be estimated by the inconsistency rate of the data with all features. The other is the maximum number of subsets randomly generated, which is, as a matter of fact, a stopping criterion that can be changed to other stopping criteria. One alternative can, for example, let the loop run forever and report a solution whenever it finds a better subset.
Modeling: handwritten word-spotting based on genetic programming (HWSGP)
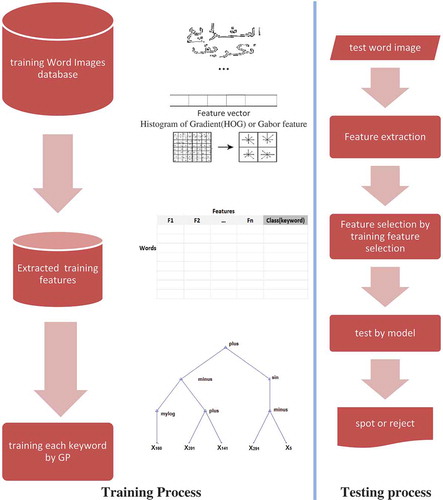
The training and testing processes of the proposed method are displayed in . As it can be observed, modeling keywords involves two training and testing processes. During the training process, the word image’s database is preprocessed (Section 3.1) and the features are extracted (Section 3.2) and finally selected (Section 3.3). The GP algorithm is then applied to each keyword in order to achieve a distinct classifier for each training keyword. During the testing process, test words are first preprocessed and the features are then extracted according to the selected features in the training process (Section 3.2). Finally, the test word feature vector is given to keyword classifiers and the word is spotted or rejected.
Figure 5. A summary of training and testing processes in the proposed method.
Training algorithm in GP
Genetic programming is one of the important methods to achieve optimal trees and graphs. In genetic programming, chromosome representation is in the form of a tree or graph and this model is also inspired by nature. First, a few trees are randomly generated. Then, the optimum amount of each tree is determined by using the fitness function. The trees are combined using selection methods such as roulette wheel as well as crossover and mutation and an optimal tree would be developed after a few generations. Important aspects of the proposed genetic programming methods are technically mentioned in details.
According to , the model may sometimes be overfitted in the train phase. Hence, an approach is proposed to identify overfitting by validation algorithm. In this algorithm, validation data are similar to the test data and are not trained. As a result, a sample of the test data during the algorithm implementation is train data. Considering that the accuracy of optimal classifiers is increasing on the train data, the accuracy of classifiers may be decreased on the validation data from a certain generation. If the validation data precision and recall Max_count are not improved in successive generations, overfitting would be detected and the algorithm would be stopped. The proposed validation algorithm is shown in .
Figure 6. Proposed algorithm of train Classifier for keyword i.
Figure 7. Proposed validation algorithm.
Chromosome representation in the GP model
Chromosome presented in this paper is a tree with leaves and nodes. The tree leaves are formed by feature labels. Because the data are normalized in [−1, +1] space using Equation (10), the real numbers are also considered to lie in the range [−1, +1]. In fact, the leaves are tree operands. Equation (11) shows the allowed set for the leaf sets. Intermediate nodes in trees act as operators. If a binary tree exists, only two operators “not or” and “not and” can be used to generate all possible scenarios; however, working with real numbers is challenging. Thus, a series of basic operators are used to obtain the complex functions. These operators are shown in Equation (3) and are used as the labels of the tree intermediate nodes.
As it can be seen in Equation (12), operators have a maximum of two operands (multiply, divide, plus, minus, power) and the generated tree has a maximum of two children per node. It should be noted that the two children on the left side are considered for unary operators such as sin, cos, ln, and the child on the right is removed. If the denominator is zero for the operator divide, it will be one. represents an example of the proposed tree with node labels with regard to Equations (10) and (11).
Figure 8. (a) Tree representation and (b) relation of tree.
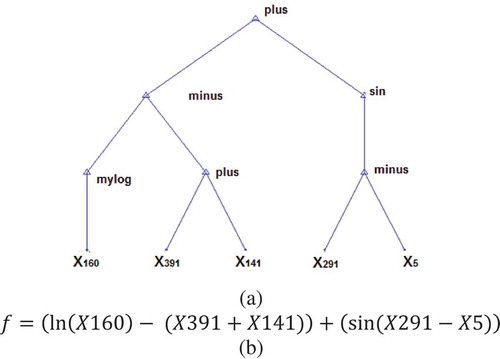
Using the proposed tree, the data are mapped in a new one-dimensional space. This tree along with the presented operators can generate all the phrases and relationships between features in order to find out a relationship among the features of a class data. As a result, the class data would generate positive values through examining the tree. Negative values are generated for the data not involved in this class. To reach the best tree with the best relationship among features for the data and keywords in keyword spotting, the fitness function is presented below.
Fitness function in GP
An important part of modeling using genetic programming is the design of a fitness function suitable for the problem. Since the problem here is to design a classifier, the classifier train data accuracy of the data is considered for the suitability of each tree. However, since the word spotting for the data available in the positive class is much less than the data included in non-classes, the classification accuracy cannot be used. The reason is that if a tree maps all the data to a negative number, given that the number of positive data is too low, the output of classification accuracy is still too high and thus, this tree is not appropriate. Hence we use the precision criterion in train data (Equations (13) and (14)).
In these equations, true positive (TP) equals the number of data included in this class, indicating proper classification by the classifier. Here, true negative (TN) equals the number of data not correctly classified by the classifier in the class. Also, false positive (FP) is the number of data not included in the class, but incorrectly classified by the classifier. Finally, false negative (FN) is the number of data included in the class, but incorrectly excluded by the classifier from the class.
Precision is considered as the fitness function in one-class classifiers since it is the most important measure among them. However, if the tree chromosome properly performs the classification and causes the precision value to reach 1, one must consider a measure to distinguish between the trees and, thus, the minimum recall and precision are used. Moreover, when the tree results in both the precision and recall values to be equal 1 in the train data, to make the margin value between the mapped data reach maximum (), the margin value is also added to the minimum recall and precision values that are equal to 1. Since by doing this, the contour between the mapped train data reaches maximum, test data are more accurately separated. According to the keyword spotting, there are some words in the test phase that are not included in the train keywords. As a result, another innovation of this paper is to propose a margin-based fitness function to solve this challenge. According to this approach, the security margin is calculated for data not included in the train phase ().
Figure 9. The new data space and margin between the positive class and non-class data in the one-class classifier.
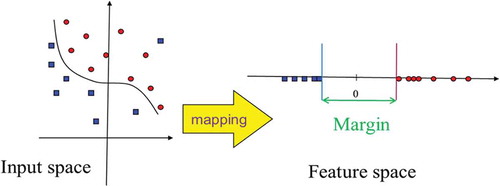
Figure 10. Example of bit data tree.
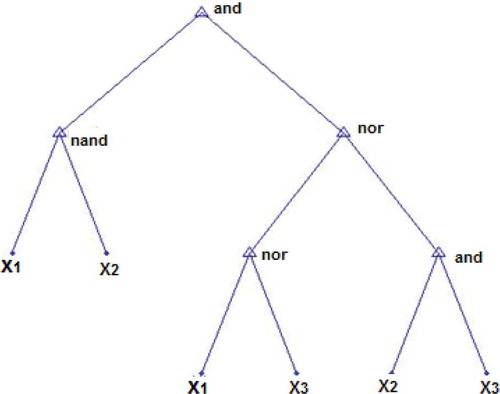
Figure 11. Samples of words from the (a) IFN/ENIT Arabic dataset (Pechwitz et al. Citation2002), (b) IFN/Farsi dataset (Mozaffari et al. Citation2008), and (c) George Washington Dataset.
In methods such as the SVM, the margin value is fixed and cannot be changed; however, one innovation in this approach is that the margin is maximized. According to such description and since the minimal fitness value is considered, their negative values are offered as fitness. The proposed function is presented as a multidisciplinary function in Equation (15).
Other procedures
After expressing chromosome representation and fitness function, the other parts of genetic programming are provided. Initially, balanced and unbalanced binary trees with maximum depth are uniformly randomly generated. Then the intermediate nodes of the trees are uniformly randomly labeled based on Equation (12). Moreover, the tree leaves are uniformly randomly selected from Equation (11). The roulette wheel method is also used for the selection operator. In addition, for the crossover, two sub-trees of parents are exchanged together. Several steps are also taken for the mutation operator. Accordingly, an intermediate node is randomly labeled from Equation (12). Then a leaf node is randomly labeled from Equation (11). In the following, a new sub-tree is generated and replaced by a sub-tree in the tree. Next, a sub-tree is randomly removed from the tree. Finally, the number of fitness function calls was used.
Discussion
In Section 4.1, the proposed method is analyzed and the use of GP is discussed. Also in section 4.2, the complexity of the proposed method is investigated.
One-class classifier (why and how?)
Keyword spotting is a classification problem. However, it includes two limitations. Some words are included in the test data, which are not involved in the train keywords. Hence, an alternative method is required. The second limitation of word spotting is the low number of training data since only a small sample of data is located in the training process in most cases; however, most data do not belong to keyword classes. Given these two challenges, a model is presented in this paper to remove these limitations. Thus, a one-class classifier is presented through proposing a proper margin in the model and distinguishing each class data from all other classes’. A model for mapping features is developed to find out the relationship among the features of train data. The method presented in this paper is based on mapping features in a suitable space to better distinguish classification problem data. In some feature mapping methods, the data size is tailored. These methods aim to achieve dimensions where the data per class have a minimum distance from one another and the data from different classes have the greatest distance.
Dimension reduction methods such as linear discriminant analysis (LDA) have limitations like Gaussian distribution. If the data are not normally distributed, LDA does not respond well.
On the other hand, using kernel functions in some methods such as the SVM kernel, the data dimensions are enhanced. The disadvantage of this method is that the kernel functions must be positive semi-definite in order for the method to well generate the separating hyperplane. In general, some kernels including radial basis function (RBF), linear and polynomial kernels are widely used. The linear kernel is the simplest kernel which maps data into a new space through a Cartesian product. With regard to the non-linear nature of the data relationship, this space does not provide a proper classification. Non-linear polynomial kernels and RBF have a parameter that should be set by tests.
The SVM in the new space regards a hyperplane as a separator to develop the maximum margin for the support vectors. This leads to higher test data accuracy. In some cases where the positive class data are much less than the other classes’ data, this method transfers all data to the negative class space and the precision equals to zero.
According to what has been mentioned, a new method is proposed to solve classification problems in this article. This method is based on obtaining a (linear or non-linear) function to map the data in a one-dimensional space with the greatest margin for the train data. Consequently, the tree model is used to obtain the optimal function. The tree leaves contain fixed numbers and data features and intermediate nodes and the root contains a set of basic operators. A tree is achieved, which maps the class data to a positive value and maps the data that are not part of this class to a negative value. displays a tree for Boolean or bit data. Furthermore, to increase the accuracy of the test data, a tree is generated, which maximizes the margin between positive and negative data.
Since the search space is directly related to the number of features, a method that is based on the mutual information entropy is used to reduce the dimensions and to select features in order to select and extract the features affecting the classification (Hiroshi Liu 2012). Given that finding an optimal tree is complicated, the genetic programming method was used to generate the best tree.
System complexity
Prior to examining the execution rate, some definitions are required to be addressed ():
Table 1. Some definitions of system complexity.
The two phases of train and test were examined in terms of execution rate and run-time. Given that the major functions in the GP are the mutation, crossover, mutation, and fitness functions, the mutation and crossover operation with a run-time of equals
, and the selection operation equals
, where
. However, the most influential function in terms of time in the GP is the fitness function which must scale the entire train database for each tree and, therefore, has the maximum delay time. If we consider the number of tree nodes equal to NT, since all the operators are carried out for each record, eventually a time equal to
is required to run any fitness function where R is equal to the number of records and
is the number of internal nodes of the tree. Given that the number of records is greater than the population number,
and also,
, during the train phase, if the generation number is
, population number is PN and also, children number is
, the train run-time equals
.
As all the operators are performed for all keywords and the keyword number equals , the run-time in the train phase equals
.
We assume that a record exists in the test phase and trees exist in the train phase. Since the test record is given to all the trees, the run-time becomes equal to
and, thus, the test phase is in real time.
In all the above computations, preprocessing complexity and, also, feature extraction and selection were ignored, and only the model complexity was evaluated.
In this dataset, according to the strategy similar to that of the IFN/ENIT Arabic dataset, more famous classes (n = 50) were selected as query, and 10 images were randomly selected for each class, resulting in a total number of 500 query images.
Experiments and evaluation
Datasets
Three public datasets are used for the experimental evaluation: the public George Washington dataset (Rath Citation2003b) for English, the IFN/ENIT Arabic dataset (Pechwitz et al. Citation2002) for Arabic, IFN/ENIT Farsi dataset (Mozaffari et al. Citation2008) for Farsi.
George washington dataset (Rath Citation2003b)
Dataset: The George Washington dataset is a collection of historical documents written by George Washington and his assistants. Rath and Manmatha segmented 20 pages of this collection, obtaining a set of 2,381 word images (Rath Citation2003b). shows a selection of samples of this dataset. The ground-truth consists of a matrix
indicating whether word images
Preprocessing and Feature extraction: Features extracted from segmented and normalized images are already available in the dataset. See (Rath Citation2003b) for details. Each word image is described as a sequence of 4D feature vectors (upper, lower, mean, and black/white transition profiles). To make the comparison with previous works easier, we use these features and LGH features.
IFN/ENIT arabic dataset (Pechwitz et al. Citation2002)
Dataset: We also run word-spotting experiments in the IFN/ENIT dataset of Arabic handwritten words. IFN/ENIT (Pechwitz et al. Citation2002) is a public dataset of Arabic handwritten word images. The dataset consists of 5 sets (a to e), each with approximately 6700 word images of Tunisian town names produced by multiple writers, together with the corresponding ground-truth annotations. In this paper, the protocol in [45] has used: A set of query images is selected from set a to e be searched in set b (6710 images). With regard to the query selection, the 50 most popular labels in set b are identified and 10 images of each are randomly selected from set a. Thus the total number of query images is 500. In set b, each of the selected labels has a number of occurrences ranging from 27 to 107.
Preprocessing: In this case the images do not need to be normalized since the IFN/ENIT dataset already provides normalized images.
Feature extraction: Features are then obtained for all the images by sliding a window from left to right and computing for each window a set of features. We use LGH features by Rodriguez and Perronnin (Rodrıguez Citation2008).
IFN/farsi dataset (Mozaffari et al. Citation2008)
Dataset: We also run word-spotting experiments in the IFN/ENIT dataset of Farsi handwritten words (Mozaffari et al. Citation2008). The IfN/Farsi-database consists of 7,271 samples from 1,080 Iranian city names. IfN/Farsi-database has a large lexicon and also comprehensive information in its ground truth. In this dataset, the similarity protocol in [45] has been used: the 50 most popular labels in the dataset are identified and 10 images of each are randomly selected from dataset. Thus the total number of query images is 500.
Evaluation measures
The results are measured using recall, precision, and mean average precision (MAP) (Al-Khayat Citation2014; Rodríguez-Serrano Citation2012; Wshah, Kumar, and Govindaraju Citation2014).
Recall rate : measures the ratio of actual positives, or the successful retrieval of the relevant target sample.
Precision rate: the probability that the retrieved image is a target word.
Expressions for the above definitions are presented in Equations (13) and (14).
Where in Equations (13) and (14), TP is the total number of correctly spotted target samples; FN is the total number of target samples which are not supported; and FP is the total number of spotted samples which are misrecognized.
The precision-recall curve is also used to calculate the MAP represented by the area under the curve, and the R—Prec which gives the rate at which the recall and precision graphs intersect.
Results and discussion
For the purpose of test implementation, the GP lab was used which is a MATLAB toolbox. Moreover, the maximum depth was considered dynamically so that it could be incremented by one unit if no change would be observed in the fitness after a few consecutive generations. By doing this, we can both control the depth and search for greater depths.
Analysis of the proposed model behavior and the need for validation
For the first test, we discuss the necessity of the validation section in the train phase of the proposed method on the IFN/Farsi dataset. The feature is considered as a Gabor filter and then, its first 100 features are extracted according to Section 3.3 using the feature-selection method. The number of members is considered as equal to 100 chromosomes and number of generation as equal to 50. and show the result of the train and test fitness function based on the generation for one-class classifier. As can be seen, in the generations 22 and 41, by improving the train fitness value, the test fitness value is observed to decline. In this case, overfitting has occurred and, thus, the algorithm must be stopped and re-implemented from scratch. As a result, the data are partitioned into three sets of test (20%), train (70%), and validation (10%). The important point in this method is that, according to the proposed fitness, one value of the fitness or precision may decrease whereas the other increases; therefore, one should not only investigate the minimum value. To avoid this, we propose a new definition to determine the overfit of the data. According to this definition, whenever the data precision and recall become worse over generations, the algorithm is overfitted and, thus, should be stopped.
Figure 12. The generation-based fitness value. The overfitting has occurred in the generations 22 and 41; however, both the precision and recall should be considered.
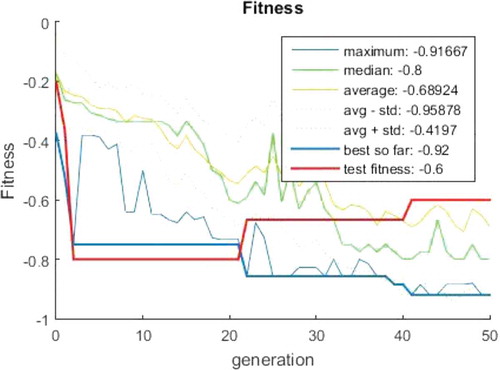
Figure 13. (a) The fitness function based on the generation, (b) the probability rate applied to the operators, (c) the population diversity percentage based on the generation, (d) the depth of the best chromosome and its average as well as nodes’ number in the trees.
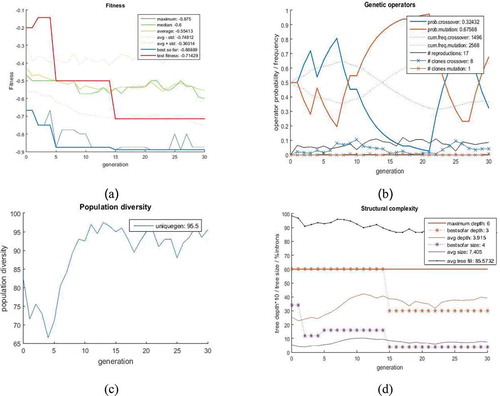
Figure 14. The tree resulting from the method for the one-class classifier in , which is obtained in the train phase and used in the test phase.
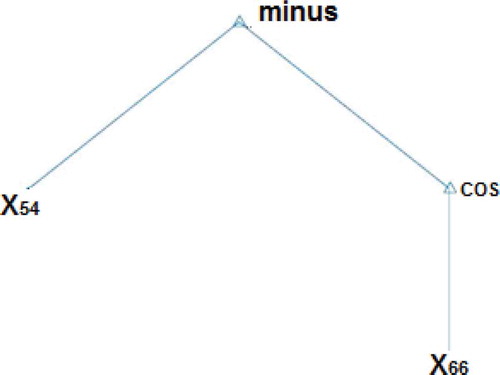
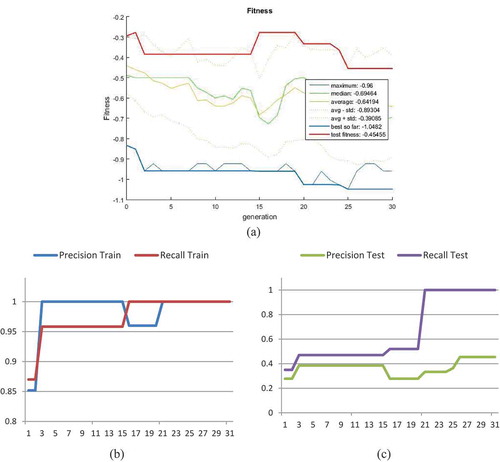
Figure 15. (a) The fitness function based on the generation. The margin value increases in generation 26 and the fitness function reaches less than −1 and also, the test data become more accurate, (b) the train data precision and recall, and (c) the test data precision and recall.
Parameter setting for premature convergence and uniformity prevention
In the second test, the convergence of test and train data as well as prevention of premature inertia and convergence are discussed. In this test, the number of trees is assumed to be equal to 150 (), the feature is considered as a Gabor filter, and dataset is the IFN/ENIT Arabic dataset. To perform the test, its first k features are extracted using the feature selection method (k = 100). Then, by improving the fitness value in each generation, the crossover and mutation probabilities are increased and decreased, respectively, so that the tree with good genes can be transferred to other trees. On the contrary, if the fitness value is declined or remained unchanged, the probability of crossover is reduced to prevent premature convergence, whereas the probability of mutation is increased to provide new genes to search for new space. shows the applied changes according to the probabilities and operators. Moreover, indicates the result of these changes on the population diversity so that the percentage of unique chromosomes and genes can be observed in every generation. Also, shows the depth and number of trees in each generation.
The final tree obtained from the algorithm for the second test is shown in .
Figure 16. The final tree obtained by the keyword corresponding to .
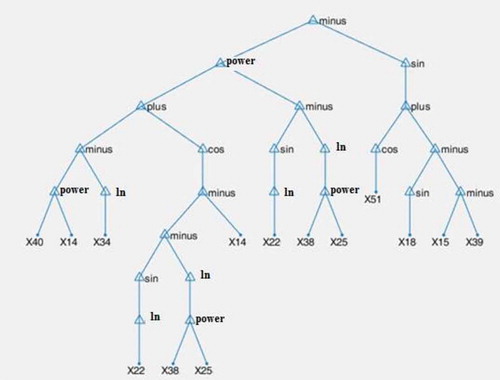
Figure 17. System performance with different operators in the George Washington dataset using the LGH feature.
Margin parameter analysis in the proposed model
In the third test, we discuss the margin parameter in the fitness function given in Equation (7). In this test, 150 trees are used as the initial population, the feature is considered as a Gabor filter, and the dataset is the George Washington dataset. Then, its first 100 features are extracted using the feature-selection method. Moreover, one-class classifier is considered for one keyword in the word spotting. In , the fitness value is given based on the generation. Also, in and , the precision and recall values for the test and train data are specifically given for this test. As can be seen, in generation 3, both the precision and recall values along with the fitness values of the test and train data have improved. In generation 17, by increasing the recall value in the train data, the precision value in the test data becomes much better. This is due to the fact that an increase in the recall value causes the number of correctly classified data to increase; thus, it extends to the test data and positively influences them. In generation 22, the fitness value reaches −1 and, also, the precision and recall values in the train data become 1. Moreover, the precision value of the test data also equals 1. However, by increasing the margin in generation 26, it can be seen that the precision value of the test data has improved. The reason is that by increasing margin distance, the test data that are not visible are moved to the + region in and, thus, cause better results to be obtained. This test reflects the novelty of this article in proposing a margin and its necessity when the precision and recall values of the train data are equal to 1. shows the final tree of this keyword in the word spotting.
Figure 18. System performance with different operators in the IFN/ENIT Arabic dataset using the LGH feature.
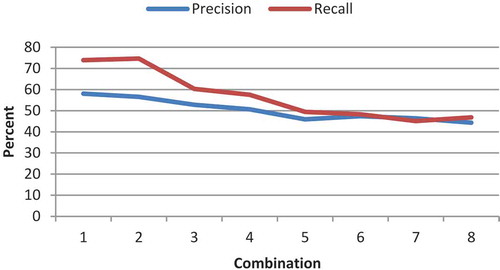
Figure 19. System performance with different operators in the IFN/Farsi dataset using the LGH feature.
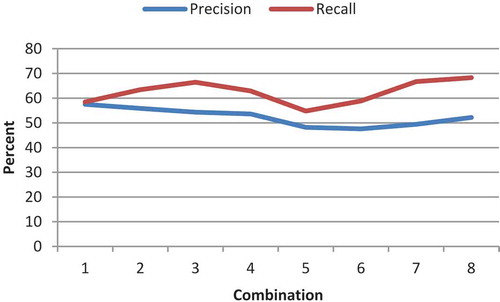
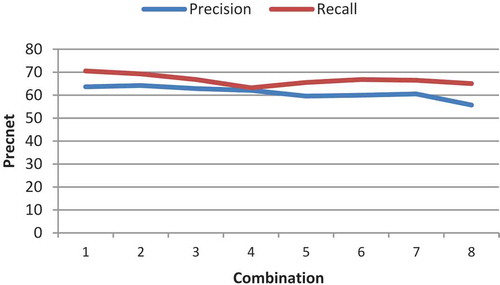
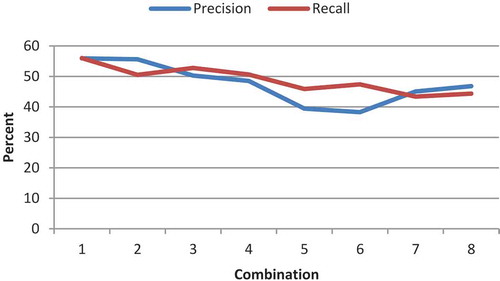
The effect of the tree operands in the proposed model
The fourth test studies the operands and genes (Equation (2), the tree operand). The number of generations and population size are considered to be 30 and 150, respectively. The test is considered for the features LGH and Gabor. The implementation results of the features LGH and Gabor are illustrated in – and –, respectively. Its first 100 features are extracted by feature-selection method. Each is separately removed from the eight proposed operands and the results are compared. The results of the test phase are presented in –. As it can be observed, the impact of removing minus is greater than that of plus. A greater removal impact was also achieved for the divide, compared with the multiply operator. The removal effects of sin, cos, ln, and power are the same and they have the greatest impact; therefore, they are the most influential operators. In terms of features, the LGH feature achieved better results, compared with the Gabor feature. To simplify, a number was assigned to each of the combinations ().
Table 2. Numbering of combinations.
Figure 20. System performance with different operators in the George Washington dataset using the Gabor feature.
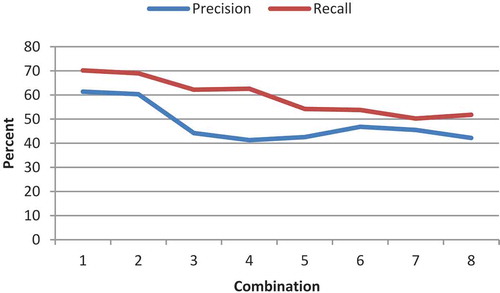
Figure 21. System performance with different operators in the IFN/ENIT Arabic dataset using the Gabor feature.
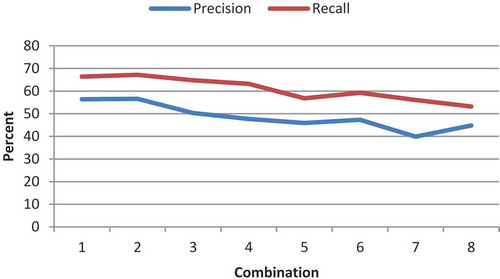
Figure 22. System performance with different operators in the IFN/Farsi dataset using the Gabor feature.
Comparison of the proposed method with the other methods
In the fifth test, we compare the proposed method with other methods (Rodríguez-Serrano Citation2012; Wshah, Kumar, and Govindaraju Citation2014). The results of the test phase are presented in . The results of the proposed model are provided with two features, LGH and Gabor. The results of the proposed method have improved about 1% in terms of the MAP index in the George Washington dataset. The improvement values for the IFN/ENIT Arabic Dataset and IFN/Farsi Dataset were 8 and 7%, respectively. As it can be seen, significant improvement has been achieved in the Farsi and Arabic datasets, compared to the English dataset. This is due to similarities between both Farsi and Arabic texts and their differences with the English text. It is observed that the results of the proposed model are better than other methods’ since a separate classifier is considered for each key in the proposed method and a proper tree is achieved for the classifier through presenting appropriate operators and genes. The tree develops based on the GP and represents the function of each keyword classifier mapped to a real number with the maximum margin. Providing the fitness function based on recall, precision, and, more importantly, margin, has also increased the model accuracy, compared to other methods.
Table 3. Comparison of the proposed method with the other methods.
Conclusion and future works
We presented a robust handwritten word-spotting system for handwritten documents using genetic programming. We have attempted to present a solution to the problem from the aspect of one-class classifier. As we know, the difference between the problem of word spotting and the description of the problem of recognition is that there are words in word spotting that are non-keywords not seen in the training step. Therefore, attempts have been made to overcome the challenge through presentation of a tree fitness function based on the margin made by the tree. In view of the experiments performed on the model parameters, it was observed that the best solution is obtained when all the tree operators are located in the model. Furthermore, for prevention of overfitting, a new model has been presented for validation, which is in accordance with the presented model. For prevention of premature convergence of the algorithm, the probability parameters of mutation and crossover are updated based on the population. It was observed in the experiments that when the training data reach the precision and recall of one, the margin parameter presented in the model has been successful in affecting the precision of the test data positively. The proposed method has been compared to recent validated methods, and has reached the best precision in most cases. One of the drawbacks of the model is that it is time-consuming in the training step, but the test step is performed through real-time word spotting. As a future work, another technique can be presented instead of the gp technique, so that run-time in the training step increases.
References
- Adamek, T. N. 2007. Word matching using single closed contours for indexing handwritten historical documents. International Journal of Document Analysis and Recognition (IJDAR) 9 (2–4):153–65. doi:10.1007/s10032-006-0024-y.
- Aldavert, D. A. 2015. A study of Bag-of-Visual-Words representations for handwritten keyword spotting. International Journal on Document Analysis and Recognition (IJDAR) 18 (3):223–34. doi:10.1007/s10032-015-0245-z.
- Al-Khayat, M. 2014. Learning-based arabic word spotting using a hierarchical classifier. PhD. dis., Computer Science and Software Engineering, Concordia University.
- Antonacopoulos, A. A. 2007. Special issue on the analysis of historical documents. International Journal on Document Analysis and Recognition 9 (2):75–7. doi:10.1007/s10032-007-0045-1.
- Ball, G. R. 2006. Segmentation-based and segmentation free approaches to Arabic word spotting. In Tenth International Workshop on Frontiers in Handwriting Recognition, La Baule, France, October 2006.
- Belongie, S. J. 2002. Shape matching and object recognition using shape contexts. Pattern Analysis and Machine Intelligence, IEEE Transactions On 24 (4):509–22. doi:10.1109/34.993558.
- Bhardwaj, A. D. 2008. Script independent word spotting in multilingual documents. In the Second International workshop on “Cross Lingual Information Access-Jan 2008”, 48–54.
- Blessy Varghese, S. G. 2015. A survey on various word spotting techniques for content based document image retrieval. International Journal of Computer Science and Information Technologies 3 (6):2682–86.
- Cheriet, M. A. 2012. A robust word spotting system for historical arabic manuscripts. In Guide to OCR for arabic scripts, ed. by H. E. Volker Märgner, 453–84. London: Springer.
- Dash, M., and H. Liu. 1997. Feature selection for classification. Intelligent Data Analysis 1 (3):131–56. doi:10.1016/S1088-467X(97)00008-5.
- David, J. E. 2005. Making latin manuscripts searchable using gHMM’s. Advances in Neural Information Processing Systems 17: Proceedings of the 2004 Conference, vol. 17, 385. Vancouver, British Columbia, Canada: MIT Press.
- Doermann, D. 1998. The indexing and retrieval of document images: A survey. Computer Vision and Image Understanding 70 (3):287–98. doi:10.1006/cviu.1998.0692.
- Fernández, D. J. 2011. Handwritten word spotting in old manuscript images using a pseudo-structural descriptor organized in a hash structure. In Pattern recognition and image analysis, ed. J. M. Jordi Vitrià, 628–35. Spain: Springer, Berlin, Heidelberg.
- Fischer, A. A. 2012. Lexicon-free handwritten word spotting using character HMMs. Pattern Recognition Letters 33 (7):934–42. doi:10.1016/j.patrec.2011.09.009.
- Fischer, A. A. 2010. HMM based word spotting in handwritten documents using subword models. 2010 20th international conference onPattern recognition (ICPR), 3416–19. Istanbul, Turkey: IEEE.
- Fornés, A. V. 2011. A keyword spotting approach using blurred shape model-based descriptors. Proceedings of the 2011 Workshop on Historical Document Imaging and Processing, 83–90. Beijing, China: ACM, September 2011.
- Haji, M. 2012. Arbitrary Keyword Spotting in Handwritten Documents. PhD thesis, Computer Science at Concordia University.
- Hangarge, M. A. 2016. Gabor wavelets based word retrieval from kannada documents. Procedia Computer Science 79:441–48. doi:10.1016/j.procs.2016.03.057.
- Liu, H. and H. Motoda. 1998. Feature selection for knowledge discovery and data mining, vol. 454, Norwell, MA, USA: Kluwer Academic Publishers.
- Huang, L. F.-H.-L. 2011. Keyword spotting in offline Chinese handwritten documents using a statistical model. 2011 International Conference on Document Analysis and Recognition (ICDAR), 78–82. Beijing, China: IEEE, September 2011.
- Jain, A. K. 2003. Indexing and retrieval of on-line handwritten documents. 2003 12th International Conference on Document Analysis and Recognition, 655–55. Edinburgh, UK: IEEE Computer Society, August 2003.
- Lam, L. S.-W. 1992. Thinning Methodologies-A comprehensive survey. IEEE Transactions on Pattern Analysis and Machine Intelligence, 14(9): 869–885.
- Manmatha, R. C. 1996. Word spotting: A new approach to indexing handwriting. Proceedings CVPR’96, 1996 IEEE Computer Society Conference on Computer Vision and Pattern Recognition, 1996, 631–37. San Francisco, CA, USA: IEEE.
- Moghaddam, R. F. 2009. Application of multi-level classifiers and clustering for automatic word spotting in historical document images. 10th International Conference on Document Analysis and Recognition, 2009. ICDAR’09, 511–15. Barcelona, Spain: IEEE.
- Mozaffari, S., H. El Abed, V. Margner, K. Faez, and A. Amirshahi. 2008. IfN/Farsi-Database: A database of Farsi handwritten city names. International Conference on Frontiers in Handwriting Recognition, Montreal, Quebec, Canada, August 2008.
- Murugappan, A. A. 2011. A survey of keyword spotting techniques for printed document images. Artificial Intelligence Review 35 (2):119–36. doi:10.1007/s10462-010-9187-5.
- Pechwitz, M., S. S. Maddouri, V. Margner, N. Ellouze, and H. Amiri. 2002. IFN/ENIT-database of handwritten Arabic words. Proc. of CIFED, vol. 2, 127–36, Hammamet, Tunisia, October 2002.
- Rath, R. M. 2003a. Indexing of handwritten historical documents-recent progress. Proceedings 2003 Symposium on Document Image Understanding Technology, 77. Greenbelt, Maryland: UMD.
- Rath, T. M. 2003b. Features for word spotting in historical manuscripts. Document Analysis and Recognition, 2003. Proceedings. Seventh International Conference on, 218–22. Edinburgh, UK: IEEE.
- Rath, T. M. 2003c. Word image matching using dynamic time warping. Proceedings of 2003 IEEE Computer Society Conference on Computer Vision and Pattern Recognition, vol. 2, II–521. IEEE.
- Riba, P. A. 2015. Handwritten word spotting by inexact matching of grapheme graphs. 2015 13th International Conference on Document Analysis and Recognition (ICDAR), 781–85. Tunis, Tunisia: IEEE.
- Rodrıguez, J. A. 2008. Local gradient histogram features for word spotting in unconstrained handwritten documents. Int. Conf. on Frontiers in Handwriting Recognition Montreal, Quebec, Canada, August 2008.
- Rodríguez-Serrano, J. A. 2009. Handwritten word-spotting using hidden Markov models and universal vocabularies. Pattern Recognition 42 (9):2106–16. doi:10.1016/j.patcog.2009.02.005.
- Rodríguez-Serrano, J. A. 2012. A model-based sequence similarity with application to handwritten word spotting. Pattern Analysis and Machine Intelligence, IEEE Transactions On 34 (11):2108–20. doi:10.1109/TPAMI.2012.25.
- Rose, R. C. 1990. A hidden Markov model based keyword recognition system. 1990 International Conference on Acoustics, Speech, and Signal Processing, 1990. ICASSP-90, 129–32. Albuquerque, NM, USA: IEEE.
- Rothfeder, J. L. 2003. Using corner feature correspondences to rank word images by similarity. Computer Vision and Pattern Recognition Workshop, 2003. CVPRW’03. Conference on, vol. 3, 30–30. Madison, Wisconsin, USA: IEEE.
- Rusiñol, M. A. 2014. Boosting the handwritten word spotting experience by including the user in the loop. Pattern Recognition 47 (3):1063–72. doi:10.1016/j.patcog.2013.07.008.
- Rusinol, M. D. 2011. Browsing heterogeneous document collections by a segmentation-free word spotting method. Document Analysis and Recognition (ICDAR), 2011 International Conference on, 63–67. Beijing, China: IEEE.
- Saabni, R. A. 2011a. Fast key-word searching via embedding and Active-DTW. 2011 International Conference on Document Analysis and Recognition (ICDAR), 68–72. Beijing, China: IEEE.
- Saabni, R. A.-S. 2008. Keyword searching for Arabic handwritten documents. Proc. 11th International Conference on Frontiers in Handwriting Recognition, (ICFHR), vol. 11, 271–77. Montreal, Quebec, Canada: IEEE.
- Sagheer, M. W. 2010. Novel Word Recognition and Word Spotting Systems for Offline Urdu Handwriting. PhD, Thesis, Concordia University, Computer Science Department, Montreal, Quebec, Canada.
- Sari, T. L. 2002. Off-line handwritten Arabic character segmentation algorithm: ACSA. Proceedings of Eighth International Workshop onFrontiers in Handwriting Recognition, 2002, 452–57. Ontario, Canada: IEEE.
- Saykol, E. A. 2004. Content-based retrieval of historical Ottoman documents stored as textual images. IEEE Transactions on Image Processing 13 (3):314–25. doi:10.1109/TIP.2003.821114.
- Shahab, S. A.-K. 2006. Computer aided indexing of historical manuscripts. 2006 International Conference on Computer Graphics, Imaging and Visualisation, 287–95. Sydney, Qld, Australia: IEEE.
- Shenoy, P. D., K. Srinivasa, K. Venugopal, and L. M. Patnaik. 2005. Dynamic association rule mining using genetic algorithms. Intelligent Data Analysis 9 (5):439–53.
- Srihari, S. A. 2005. Handwritten arabic word spotting using the cedarabic document analysis system. Proc. Symposium on Document Image Understanding Technology (SDIUT-05), 123–32. Adelphi, Maryland, Novamber 2005.
- Stejic, Z., Y. Takama, and K. Hirota. 2004. Modified hierarchical genetic algorithm for relevance feedback in image retrieval. Intelligent Data Analysis 8 (4):363–84.
- Terasawa, K. A. 2009. Slit style HOG feature for document image word spotting. Document Analysis and Recognition, 2009. ICDAR’09. 10th International Conference on 116–20. Spain: IEEE, July 2009.
- V. Frinken, A. R. 2012. A novel word spotting method based on recurrent neural networks, IEEE Transactions on Pattern Analysis and Machine Intelligence. Pattern Analysis and Machine Intelligence, IEEE Transactions On 34 (2):211–24. doi:10.1109/TPAMI.2011.113.
- Wshah, S., G. Kumar, and V. Govindaraju. 2014. Statistical script independent word spotting in offline handwritten documents. Pattern Recognition 47 (3):1039–50. doi:10.1016/j.patcog.2013.09.019.
- Wshah, S. G. 2012. Script independent word spotting in offline handwritten documents based on hidden Markov models. 2012 International Conference on Frontiers in Handwriting Recognition (ICFHR), 14–19. Bari, Italy: IEEE, September 2012.
- Ye, Q. A. 2015. Text detection and recognition in imagery: A survey. IEEE Transactions on Pattern Analysis and Machine Intelligence 37 (7):1480–500. doi:10.1109/TPAMI.2014.2366765.
- Zhang, B. S. 2003. Word image retrieval using binary features. Electronic Imaging 2004, 45–53. International Society for Optics and Photonics. San Jose, California, USA: International Society for Optics and Photonics, December 2003.