
ABSTRACT
Image segmentation with complex background is a tedious task. In our study, a convex spline is constructed based on Good Features to Track (GF2T) method’s region-based salient feature (i.e., corner) set. For an optimized edge-based segmentation, an ellipse shape prior based on this convex spline is useful in edge regularization procedure with region-based features. This kind of optimization is achieved by Boltzmann machine (BM) to automatically form an elliptical foreground mask of the GrabCut method. We demonstrated our approach’s usability through traveling salesman problem (TSP), thus, we consider that the TSP’s valid tour’s path solved by BM can be taken as an optimized convex spline for edge-based segmentation. In our experiments, proposed BM-based approach has the performance improvement of segmentation to stand-alone GF2T as 29.79% improvement based on bounding boxes evaluation and as 38.67% improvement based on the overlapping pixel regions for a quantitative evaluation via objective metrics.
Introduction
Nowadays, multimedia systems play important role for digital video and audio networking and communication. Image segmentation has a preliminary role in content-based image analysis. To obtain object(s) of interest (OOI), it subdivides a given image into its constituent parts, thus the valuable information can be extracted from this image. In this scope, image parts are disjoint regions with uniform and homogeneous attributes. In the literature, there are edge- and region-based segmentation, and thresholding (or multithresholding) categories which are well known and frequently used for decades (Peng and Varshney Citation2015). Basically, a bi-level image segmentation treated as a separation process of sets of abovementioned image attributes (or regions) is based on the coverage area of foreground and background. There are fully automated, manual, or semi-automated segmentation (i.e., user interaction) studies in the literature. The main aim of interactive segmentation is to segment a specific foreground object from background region based on user choices (Veksler Citation2008). The GrabCut is an interactive segmentation approach which iteratively estimates Gaussian mixture models (Wu et al. Citation2014). In this way, it improves the results of graph cut algorithm that combines boundary (i.e., edge) regularization with region-based attributes (i.e., features). The GrabCut segments given image into homogeneous regions. In addition, the initial information about foreground and background for GrabCut are given by the user as a rectangular box selection, thus pixels outside the box are specified as background, and pixels inside the box are specified as foreground (i.e., OOI). This bounding box is a sufficient user interaction to enable object (i.e., foreground) segmentation to be completed automatically (Rother, Kolmogorov, and Blake Citation2004). For the edge- and region-based segmentations, edge preserving is important to overcome under- and over-segmentation problems. The mean-shift (MS) filtering can be used for edge-preserving smoothing before segmentation. By this way, some important edges of an image might be easier detected after MS filtering. In its procedure, a set of neighboring pixels for each pixel of an image is determined. These pixels have a spatial location and a particular color, and their neighboring pixels are within a spatial radius and a defined color distance in hue–saturation–value color space. The new color mean value and spatial mean (i.e., center) are calculated for these neighboring pixels and, thence, for the next iteration of the procedure, these mean values can be used as a new center (i.e., window move). Until the spatial and color means do not change, the procedure will be iterated, then at last iteration, the final mean color value will be assigned to related position in the image (Comaniciu and Meer Citation2002). Harris corners are interesting (i.e., salient) feature points at the junction of two edges. Good Features to Track (GF2T) algorithm is a solution that the features it detects can be used as a good root set for selecting interest points from given image. In addition, this algorithm requires the interest points to be sorted by their Harris score. It starts from the point with the strongest Harris score and also with the largest minimum eigenvalue. Therefore, this algorithm continues only with accepting the interest points which are in a given distance from the already accepted points. However, it has a good distribution of points across the image (Laganiere Citation2011; Shi and Tomasi Citation1994). Traveling salesman problem (TSP) is a NP-complete optimization problem. The aim of the TSP is to find a tour of a given set of cities that is of minimum length. For TSP, the tour of minimum distance is desired and this tour consists of visiting each city exactly once (i.e., constraint). At the end of tour, it returns to the starting city. In this scope, we can consider that this tour’s valid path can be taken as a convex spline for edge-based segmentation. Boltzmann machine (BM) (i.e., an artificial neural network [ANN]) can be used to locate optimal and near-optimal solutions to the TSP (Gutzmann Citation1987). Given system’s global state can be assigned to a single value that is the energy of this state. The simulated annealing process is able to locate better solutions from a random starting solution (Kirkpatrick, Gelatt, and Vecchi Citation1983) that it used by BM to locate energy minima in given optimization problem. The number of update cycles and annealing schedule effects on solution quality. This process gradually reduces the temperature of given system (Kirkpatrick, Gelatt, and Vecchi Citation1983; Metropolis et al. Citation1953). The higher temperature indicates the higher energy of the state. In this scope, the BM aims to minimize given system’s energy, and it has been described as a constraint satisfaction network (Gutzmann Citation1987). For BM, each unit of ANN represents a hypothesis. When the unit is “on,” the hypothesis is “true” and, also, “off” units represent that the hypothesis is “false.” The weights of ANN are fixed to describe both the function to be optimized and given constraints of the problem. A valid TSP tour is described by exactly one unit being “on.” In order to go from one valid tour to another, several invalid tours must be accepted by BM. The final valid tour’s path can be considered as a convex spline for optimized segmentation in our study. This path calculated with the use of the set of GF2T interest points locations as given for TSP cities. The Scharr operator is a directional filter for edge detection and preferred when more accurate estimates of the gradient orientation are required. With the help of Scharr operator, we constructed the best fitting ellipse’s junction points from optimized convex spline obtained by BM. Our area of research mainly focuses on optimized segmentation of natural image (i.e., butterfly on complex background) and we combine it with BM approach to show the improvement on performance of existing segmentation results. We concentrate on the best edge regularization with region-based features. Therefore, MS filtering used as a preprocessing step to provide a good segmentation accuracy for other steps in segmentation process. With the help of GF2T, we obtain the root set of features for a better edge considered as a convex spline. In order to improve the performance of automatic image segmentation, MS filtering, GF2T-based salient feature (i.e., corner) set detection, and BM-based convex spline optimization to detect the best edge combined with Scharr operator to construct the fitted bounding ellipse (i.e., foreground mask) for GrabCut are applied to our optimized segmentation approach, respectively. The important contribution of this paper is to able to include BM-based optimization in edge regularization procedure with the use of region based features.
The remainder of the paper is organized as follows. The “Proposed approach” section describes the details of abovementioned methods/techniques and algorithms, and our proposed optimized segmentation approach based on BM for butterfly images with complex background is introduced. The “Experimental results” section covers the details of butterfly image database used in our experiments and the performance evaluation based on the experimental results given on both qualitative and quantitative manner. In addition, a discussion is presented at the same section on performance results obtained with experiments. The paper is concluded with the “Conclusion” section.
Proposed approach
The edge-based segmentation subdivides an image into its regions or objects. Therefore, accurate segmentation of a particular OOI is an important edge localization problem. In this section, we will explain our proposed segmentation approach for a particular OOI (i.e., butterfly) with BM-based edge optimization. We assume that every image in given image dataset contains an instance of the OOI. According to extracted local information, deciding the homogeneity or similarity of the clustered regions is a limited issue. Color clustering-based segmentation algorithms perform well when the given object contains similar looking parts. When the object’s parts start to differ from each other in a large scale, those algorithms perform the worse segmentation results (i.e., under- or over-segmentation problems) due to insufficient information about different image parts (Alam et al. Citation2013). For accurate segmentation, the local information can be enriched with the use of edge regularization with region-based features. For edge-preserving smoothing before segmentation, MS filter can be used to improve the homogeneity of intra-region and then the useful local information for different parts of given image will be extracted. These useful local information can be obtained by the use of GF2T and, thence, the better edge as a convex spline will be used accurately to segment OOI from background region or other object(s). In our study, the MS filter and GF2T parameters are determined by the use of graphical user interface (GUI) of our Boltzmann Machine-based Image Segmentation (BoMISe) software application. A spatial window radius (Sp) and a color window radius (Sr) are parameters of MS filtering in BoMISe. In addition, the end user can change the values of parameters for the number of GF2T method’s maximum possible detected corners (i.e., strongest situated features) and the minimum possible Euclidean distance between detected corner points of GF2T method in BoMISe. These parameters of GF2T are the main difference with the original Harris algorithm. By the use of a quality level for GF2T, it determines the minimum quality of corner below in which every corner is rejected. It is a value between zero and one. In BoMISe, we fixed the quality level to 0.01 as well. In GrabCut method, the user specifies an initial region (i.e., region of interest, ROI) containing the object as a rectangular box. Usually, this rectangular box involves a considerable part of the background. This issue causes that the appearance model is less reliable. To model the object appearance as more reliable, the investigation of a shape prior for GrabCut segmentation can be useful. Olga Veksler proposed a generic shape (i.e., with star-convexity constraint) prior similar to the ellipse assumption (Slabaugh and Unal Citation2005; Veksler Citation2008), which is quite stronger assumption than a plain connectivity (i.e., rectangular box), but it still restricts its applications to real images with complex background like butterfly in natural scene. At this point of view, this kind of ellipse shape constraint is useful to update the contour of given OOI with complex background. In our study, we used an ellipse assumption powered by Scharr operator to update the contour (i.e., edge based) for an accurate segmentation of OOI. In this way, our reliable appearance model-based segmentation approach can find a large significant part of foreground that it contains without the background pixels. In the study of Gutzmann (Citation1987), it is emphasized that BM is designed to locate energy minima. These minima are then interpreted as solutions to an optimization problem. Due to a change in the state of local unit (i.e., neuron), each unit can locally identify the change in the global energy of the system. The state of unit is “on” with a probability defined by the energy difference of its “on” and “off” states and temperature parameter T. According to annealing process, the annealing (i.e., cooling) schedule helps to obtain a better or worse solution. In annealing process, the starting temperature T0 value is slowly reduced to reach the ending temperature Tf value. Depending on the energy comparison, the move from existing solution to a new neighbor solution is done, which is suitable for Boltzmann’s distribution. In this way, by considering the Metropolis criterion, energy alteration can be made (Karasulu and Korukoglu Citation2011). Therefore, BM seeks to determine a direct relationship between the constraints and objective function of an optimization problem (e.g., TSP) and the units’ weight set of a BM (Gutzmann Citation1987). This weight set is an interconnection weight matrix for the units of BM. The TSP instance is presented in the weighted connections of BM. For layout matrix, the unit in the jth row and kth column indicates the tour hypothesis. In this way, city j resides at the kth position in the TSP tour. A valid tour (i.e., legal solution) will have only one unit of BM active in each row and column of layout matrix (Tesar, Kapenga, and Trenary Citation1989). In addition, a proposed solution is determined by the collective state of units of BM. A consensus (i.e., objective) function is given as below (Tesar, Kapenga, and Trenary Citation1989):
where is the connection’s weight (i.e., distance between city i and city j) between unit i and j, and
is the state (i.e., zero for “off” and one for “on”) of unit i. With the help of Metropolis criterion, a unit’s activation probability is computed and, thus, this unit is updated with the probability of becoming (or remaining) active (i.e., state is “on”). However, the equilibrium distribution of states in given BM is independent of the path to that state (Gutzmann Citation1987). Also, the BM net in thermal equilibrium means that the probabilities of two configuration of the BM net obey the Boltzmann distribution (i.e., stationary distribution). In , the flowchart of the proposed approach is shown; therefore, related steps are given in an abstract form in this figure.
Figure 1. Flowchart of the proposed approach.
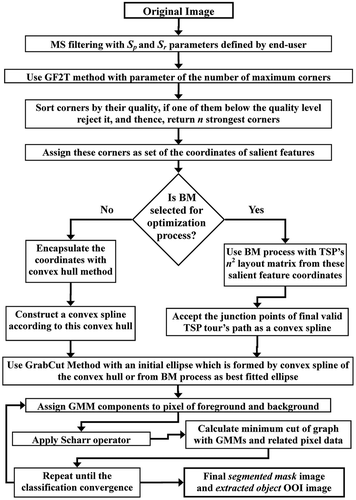
For our segmentation approach, abovementioned ellipse’s boundary has been treated as a convex spline which is optimized with the use of BM. To acquire useful local information, the salient feature set is obtained by GF2T, which uses Harris corner detection. The coordinates of feature points in this feature set are considered as cities of TSP optimization problem’s tour. The position of the city in the tour and index of the city are formed as a layout matrix to simplify the calculation of tour length within the mapping of the problem. For n feature points (i.e., n cities), BM is composed of n2 units which form as abovementioned layout matrix. Then, the tour of minimum distance computed by BM, and at the end of process, city coordinates of optimized final path are treated as the convex spline’s junction points. We update the model by these points’ coordinates which are improved by Scharr operator’s results as well. Until the solution convergences, BM iterates the process to find best fitting ellipse’s boundary as a convex spline. The complete algorithm of proposed approach consists of the steps given in .
According to abovementioned algorithm, our BoMISe application produces a final bi-level segmented image (black and white) and extracted OOI image (i.e., colored) as well. In the experiments, we used BoMISe and some appropriate image subsets with ground truth (GT) data for segmentation performance evaluation. In the following section of this paper, the details of conducted experiments and the performance results in the qualitative and quantitative manner are given, respectively.
Experimental results
According to the study of Gulshan et al. (Citation2010), the interactive segmentation evaluation is either qualitative or is restricted to a fixed set of user interactions. This interaction is seeded with some points obtained by the use of GT segmentation. Unlike the study of Gulshan et al., we used a quantitative way to evaluate our automatic image segmentation approach optimized by BM. In our experiments, GT images are treated as reference images contain GT data. In these GT images, there are two regions called as foreground (i.e., OOI) and background. The GT images are given in form black and white that the pixels of foreground (i.e., OOI) are given as white, and the pixels of background are given as black. In addition, we used only these GT images to evaluate automatically the segmentation results of our proposed approach and, also, we did not interactively use abovementioned seed points by the use of GT segmentation. On the contrary, the performance evaluation made full automatically by our BoMISe application with its built-in facilities via pixel-by-pixel comparison between GT image (manually labeled by expert human) and segmented image constructed by our approach. We used the Leeds Butterfly Dataset (Wang, Markert, and Everingham Citation2009) to conduct our experiments.
Image dataset
The Leeds Butterfly Dataset has 10 categories (i.e., species) of butterflies. According to its study, images in this dataset collected from Google Images by querying with the Latin name of the species (Wang, Markert, and Everingham Citation2009). There are totally 832 images in this dataset with the related images of subset per category of butterflies. And there is considerable variation in illumination and pose. In this dataset, images of butterflies are filtered for depicting the butterfly to interest (i.e., OOI). In addition, we take note that many images used in our experiments contain a complex background (i.e., natural scene). We used in our experiments five categories of this dataset as subsets, i.e., Danaus plexippus as subset1, Heliconius charitonius as subset2, Heliconius erato as subset3, Junonia coenia as subset4, and Lycaena phlaeas as subset5, as well. In addition, we selected randomly some images from these subsets to test our proposed approach in our experiments. Our tests conducted on 98 images which are randomly collected from these 5 subsets, i.e., 33 images from subset1, 15 images from subset2, 9 images from subset3, 22 images from subset4, and 19 images from subset5, respectively.
Performance evaluation
In the qualitative evaluation way, the final segmented image is evaluated by the human expert that it is based on previous experiences of this human expert. Nevertheless, the final decision of human expert is practically relative due to the specific errors in the segmentation and agglutinate to perception of this human expert. In our study, we selected five objective performance metrics from information retrieval research area to evaluate quantitatively our proposed approach such as pixel-based precision (Pp), pixel-based recall (Pr), F-measure (Fm), Jaccard similarity coefficient (Js) and kappa index (Kp). To label the pixels as relevant or irrelevant at two-class pixel-based classifier, a contingency table is used that it involves the true positives (TP), true negatives (TN), false positives (FP), and false negatives (FN). According to the scope of abovementioned information retrieval, Pp is a ratio as given below (Karasulu Citation2013):
where the operator represents the number of pixels in the relevant area. And also,
The weighted harmonic mean of Pp and Pr is defined by the formula (i.e., Fm) as given below:
To evaluate similarity between GT object and segmented object by given algorithm for OOI, the Js and Kp metrics are frequently used where R1 and R2 are the pixel-based area of the GT object and the segmented object, respectively. For Js and Kp metrics, the and
operators represent the intersection and combination of the R1 and R2, respectively (Karasulu Citation2013).
and also, kappa index is given as following formula:
where abovementioned performance metrics are in range between zero and one. The zero value and one value indicate the worst result and the best result for performance measurement, respectively. The higher values of Js and Kp mean that the better matching of the segmented object area with the GT object area is achieved. In all experiments, all abovementioned performance metrics are used in evaluation of performance based on both bounding boxes of OOI and pixel regions (i.e., R1 and R2) in given image. The performance results based on these metrics are given with the details in the following section.
Performance results
Our system implemented on C++ with OpenCV computer vision library infrastructure. The experimental tests are run on a Microsoft(TM) Windows 7 (64-bit) OS machine equipped with Intel(R) Core(TM) i7 CPU (i.e., Quad-core) at 3.20 GHz and 12.0 Gb of RAM. Our tests are executed over 10 trials with given test parameters (e.g., 15 or 20 feature points for the number of maximum corners of GF2T, and some values for spatial window radius (Sp) and a color window radius (Sr) for MS filtering) for each one of the butterfly images of related subsets. The end user may select some different test parameter values to test the system with an original image from related subset in a given test run, thus the performance changes with parameters can be tracked by end user via our BoMISe system. At the end of the test run, our system produces the segmented mask image and the resultant (i.e., extracted object) image of final segmentation. This resultant image is evaluated by considering abovementioned five metrics in a quantitative way and, also, the qualitative results are given in this study as well. These qualitative results are shown from –, respectively.
Figure 2. “0027” image from subset1, (a) GT image, (b) segmented mask image by BM, (c) segmented mask image by GF2T, (d) original image, (e) extracted object image by BM, and (f) extracted image by GF2T.
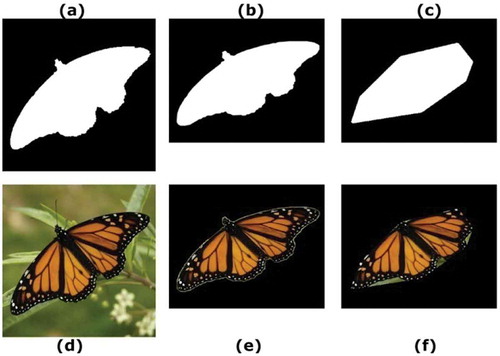
Figure 3. “0049” image from subset2, (a) GT image, (b) segmented mask image by BM, (c) segmented mask image by GF2T, (d) original image, (e) extracted object image by BM, and (f) extracted image by GF2T.
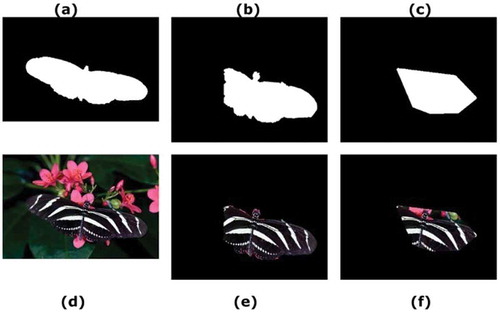
Figure 4. “0002” image from subset3, (a) GT image, (b) segmented mask image by BM, (c) segmented mask image by GF2T, (d) original image, (e) extracted object image by BM, and (f) extracted image by GF2T.
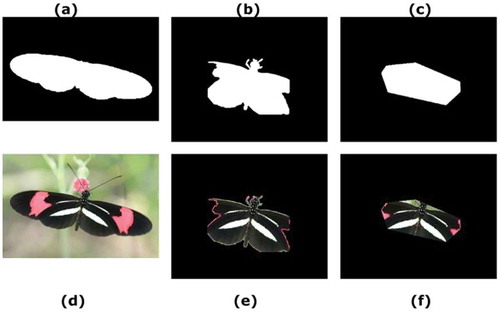
Figure 5. “0037” image from subset4, (a) GT image, (b) segmented mask image by BM, (c) segmented mask image by GF2T, (d) original image, (e) extracted object image by BM, and (f) extracted image by GF2T.
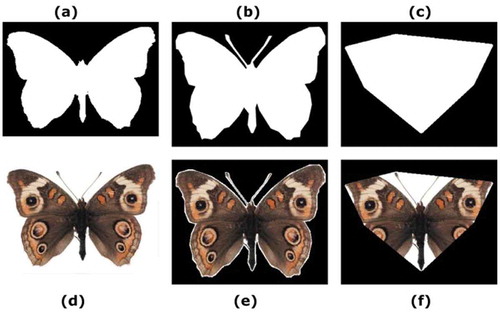
Figure 6. “0023” image from subset5, (a) GT image, (b) segmented mask image by BM, (c) segmented mask image by GF2T, (d) original image, (e) extracted object image by BM, and (f) extracted image by GF2T.
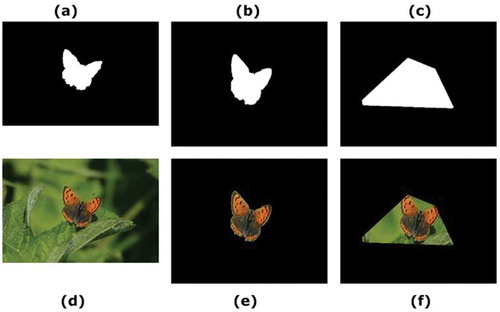
In these figures, selected original images and GT images from subset1 to subset5 are shown. In addition, these figures involve the segmented mask images and the extracted object images obtained by related method (i.e., GF2T or BM) for related original image from related subset. In , from subset1 for “0027” image, (a) GT image, (b) segmented mask image by BM, (c) segmented mask image by GF2T, (d) original image, (e) extracted object image by BM, and (f) extracted image by GF2T. - show the qualitative resultant images constructed with the segmented and extracted images from the subset2 to subset5 (i.e., images “0049”, “0002”, “0037”, and “0023”, respectively) using the GF2T and BM methods. From –, it can be seen that the proposed approach (i.e., BM-based optimization) has a better qualitative result than GF2T method’s result. To arrive at a satisfactory judgment, we looked up the overlap ratio between segmented mask image and GT image of related original image by considering bounding boxes or pixel regions. As a result of this, five quantitative (i.e., objective) performance measurements for both of abovementioned methods are given in the - via performance results based on bounding box or pixel regions, whereby the best performance results are given in bold.
In given quantitative evaluation, it can be seen from these tables that our proposed BM-based optimization approach has better overall results than GF2T-based image segmentation. In addition, our proposed approach has better overall segmentation performance results for five image subsets in the experiments. In , only one result (i.e., precision for GF2T based on the bounding boxes) is better than BM result, but its pixel regions evaluation counterpart is worst than our proposed BM-based approach’s evaluation as well. For bounding boxes based performance evaluation with the use of five metrics, there are both 490 measurement values obtained for GF2T and 490 measurement values for our proposed BM-based optimization approach (i.e., totally 960 values). The same situation is valid for pixel region-based evaluation with the use of 5 metrics as well (i.e., totally 960 values). Judging from these measurement values, our proposed approach offers an improved segmentation performance compared to the original GF2T method, as evident from the 29.79% performance improvement in the bounding boxes evaluation, and from the 38.67% performance improvement in the pixel regions (i.e., R1 and R2) evaluation.
Table 1. BoMISe’s algorithm.
Table 2. The quantitative evaluation of performance based on the precision metric. The results shown in bold in the table indicate the best performance values.
Table 3. The quantitative evaluation of performance based on the recall metric. The results shown in bold in the table indicate the best performance values.
Table 4. The quantitative evaluation of performance based on the F-measure metric. The results shown in bold in the table indicate the best performance values.
Table 5. The quantitative evaluation of performance based on the Jaccard metric. The results shown in bold in the table indicate the best performance values.
Table 6. The quantitative evaluation of performance based on the kappa metric. The results shown in bold in the table indicate the best performance values.
Table 7. The overall performance results obtained for five image subsets. The results shown in bold in the table indicate the best performance values.
Conclusion
One attractive feature of our proposed approach is that it does not require a whole user interaction to select ROI containing the OOI, but it is only enough to complete the segmentation with a few entries of user-specified MS filter and GF2T parameters using GUI of our BoMISe software application. Based on the qualitative and quantitative segmentation performance results as given in the performance result tables of our study, it can be said that our proposed BM-based optimized segmentation approach is more preferable and usable than stand-alone GF2T method to segment the natural images with complex background as well. For future studies, we plan to add some other edge detection and feature extraction methods to our approach and its system.
Additional information
Notes on contributors
Bahadir Karasulu
Bahadir Karasulu is a full-time associate professor of Computer Engineering Department at Canakkale Onsekiz Mart University, Canakkale, Turkey. In 2003, he graduated from the Science and Arts Faculty—Physics Department at Kocaeli University, Kocaeli, Turkey. Afterwards, in 2006, he completed a M.Sc. thesis study in Computer Engineering Department of Maltepe University, Istanbul, Turkey. In 2010, he obtained his Ph.D. degree in Computer Engineering Department of Ege University, Izmir, Turkey. In 2013, his book is published by Springer Science + Business Media, New York, USA which is entitled as Performance Evaluation Software: Moving Object Detection and Tracking in Videos. In 2015, his textbook about the issues of “soft computing” and “hybrid intelligent systems” is published by a national publisher (i.e., Nobel yayincilik) in Turkey. He has published many articles in international journals as well as papers in conferences. His research interests are artificial intelligence, computer vision, pattern recognition, distributed and parallel computing, simulation, and optimization.
References
- Alam, F. I., M. I. H. Chowdhury, M. R. Rabbani, and F. K. Bappee. 2013. An optimized image segmentation algorithm. Proceedings of the 2013 International Conference on Informatics Electronics and Vision (ICIEV), Dhaka, Bangladesh, 1–6. doi: 10.1109/ICIEV.2013.6572644.
- Comaniciu, D., and P. Meer. 2002. Mean shift: A robust approach toward feature space analysis. IEEE Trans Pattern Anal Mach Intell 24 (5):603–19. doi:10.1109/34.1000236.
- Gulshan, V., C. Rother, A. Criminisi, A. Blake, and A. Zisserman. 2010. Geodesic star convexity for interactive image segmentation. Proceedings of the 2010 IEEE Computer Society Conference on Computer Vision and Pattern Recognition, 3129–36, San Francisco, CA. doi: 10.1109/CVPR.2010.5540073.
- Gutzmann, K. M. 1987. Combinatorial optimization using a continuous state Boltzmann machine. Proceedings of IEEE First Annual Conf. on Neural Networks III:721–734, San Diego, CA, June 21–24.
- Karasulu, B. 2013. An approach based on simulated annealing to optimize the performance of extraction of the flower region using mean-shift segmentation. Applied Soft Computing 13 (12):4763–85. doi:10.1016/j.asoc.2013.07.019.
- Karasulu, B., and S. Korukoglu. 2011. A simulated annealing-based optimal threshold determining method in edge-based segmentation of grayscale images. Applied Soft Computing 11 (2):2246–59. doi:10.1016/j.asoc.2010.08.005.
- Kirkpatrick, S., C. Gelatt Jr, and M. Vecchi. 1983. Optimization by simulated annealing. Science 220 (4598):671–80. doi:10.1126/science.220.4598.671.
- Laganiere, R. 2011. OpenCV 2 computer vision application programming cookbook, 277. Packt Publishing Ltd., Birmingham, United Kingdom. ISBN: 978-1-849513-24-1.
- Metropolis, N., A. W. Rosenbluth, M. N. Rosenbluth, A. H. Teller, and E. Teller. 1953. Equation of state calculation by fast computing machines. Journal of Chemical Physics 21 (6):1087–92. doi:10.1063/1.1699114.
- Peng, R., and P. K. Varshney. 2015. On performance limits of image segmentation algorithms. Computer Vision and Image Understanding 132:24–38. doi:10.1016/j.cviu.2014.11.004.
- Rother, C., V. Kolmogorov, and A. Blake. 2004. Grabcut: Interactive foreground extraction using iterated graph cuts. Proceedings of ACM Transactions on Graphics (TOG) SIGGRAPH 2004. 23(3):309–314, New York, USA, ACM. doi: 10.1145/1015706.1015720.
- Shi, J., and C. Tomasi. 1994. Good features to track. Proceedings of the IEEE Conf. on Computer Vision and Pattern Recognit. (CVPR), 593–600. doi:10.1109/CVPR.1994.323794.
- Slabaugh, G., and G. Unal. 2005. Graph cuts segmentation using an elliptical shape prior. Proceedings of the IEEE International Conf. on Image Processing 2005:II-1222–1225. doi: 10.1109/ICIP.2005.1530282.
- Tesar, B. B., J. Kapenga, and R. Trenary. 1989. A Boltzmann machine solution of the traveling salesperson problem: A study for parallel implementation. Proceedings of the TENCON ‘89 Fourth IEEE Region 10 International Conference, 142–44, Bombay, India, Publ by IEEE (Piscataway, NJ, United States), November 22–24, 1989. doi: 10.1109/TENCON.1989.176914.
- Veksler, O. 2008. star shape prior for graph-cut image segmentation. In Computer Vision – ECCV 2008: 10th European conference on computer vision, eds. D. Forsyth, P. Torr, and A. Zisserman, Marseille, France. October 12-18, 2008, Proceedings Part III:454-467. LNCS, vol 5304. Springer, Berlin, Heidelberg. doi:10.1007/978-3-540-88690-7_34.
- Wang, J., K. Markert, and M. Everingham. 2009. Learning models for object recognition from natural language descriptions. Proceedings of the 20th British Machine Vision Conference (BMVC2009), 2.1–2.11, BMVA Press. doi: 10.5244/c.23.2.
- Wu, J., Y. Zhao, J. Y. Zhu, S. Luo, and Z. Tu. 2014. MILCut: A sweeping line multiple instance learning paradigm for interactive image segmentation. Proceedings of the IEEE Conf. on Computer Vision and Pattern Recognition, Columbus, OH, 256–63. doi: 10.1109/CVPR.2014.40.