
ABSTRACT
This article presents the development and evaluation of a computerized decision support system (DSS), aiming to Show the feasibility and potential toward maximizing the benefits of a new algorithm by combining the machine-learning techniques which are not used in the literature for automatic recognition of the gastric images. The object of this article is fivefold: first, the features Maximally Stable Extremal Regions (MSER), Speeded Up Robust Features (SRF), and Binary Robust Invariant Scalable Keypoints (BRISK) of histopathological gastric images were analyzed. Second, the Fourier Transform (FT) was applied to these properties which were calculated to equalize the dimensions of the obtained features. Third, MS and LE size reduction methods have been applied. Fourth, the decision tree (DT) and discriminant analysis (DA) classifiers are used to classify the histopathological gastric images. Fifth, these classification results have been compared. In this article, the highest accuracy result obtained by using the SRF_FT_MS_DT method is found to be 86.66%. Fast and multimodality computerized DSS can beneficial to patients for early detection of gastric diseases. It may facilitate early diagnosis of the disease.
Introduction
Discriminant analysis (DA) method is a statistical and machine-learning method that finds a linear combination of properties that determine or distinguish two or more events. Logistic regression and statistical likeness regression is similar to DA. Despite the fact that independent variables have normal distribution in DA, there is no need such an acceptance in logistic regression and statistical likelihood regression. The DA that seeks the linear combination of the variables that best explain the data is related to principal component analysis (PCA) and factor analysis methods. DA explicitly tries to model the difference between classes of data. For DA, there should be a distinction between independent variables and dependent variables. DA works in situations where the independent variables for each observation are constant quantities. In the case of dealing with independent variables belonging to the category, the discriminant similarity analysis is equivalent to the DA method (Shayan et al. Citation2016). Machine-learning techniques are widely used in computer-assisted analysis of histopathological gastric cancer images. In the literature, machine-learning techniques such as Bayesian networks (BNs), decision trees (DTs), artificial neural networks (ANNs), and support vector machines (SVMs) have been widely applied in cancer research for the development of predictive models with effective results (Kourou et al. Citation2015).
There are computer-aided studies carried out with machine-learning techniques in gastric cancer diagnosis. To date, there are many studies for the early detection of cancer types using machine-learning techniques.
In the study of Korkmaz, Korkmaz, Poyraz and Yakuphanoglu (Citation2017), AFM images were used for early diagnosis of breast cancer. They used Gray-Level Co-Occurrence Matrix (GLCM) features. Minimum redundancy and maximum relevance (mRMR) were used as size reduction method. The fuzzy k-nearest neighbor (KNN) and least-squares support vector machine (LSSVM) methods were used as classifiers. The accuracy rate found for mammograms of breast cancer is mRMR_KNN and mRMR_LSSVM method is found to be 100%. In another study (Korkmaz and Korkmaz), the machine-learning methods, such as the minimum-redundancy-maximal-relevance m (RMR) and Kullback–Leibler (KL), are used for cancer diagnosis. The accuracy result is found to be 98.3%. In addition, the machine-learning techniques for early diagnosis of the gastric cancer in the literature are used. An important cause of gastric cancer is Helicobacter pylori infection. Yoshihiro et al. (Citation2010) studied a computer-based system for predicting risk factors for gastric cancer. Digital endoscopy images of patients with H. pylori bacteremia have been studied in the system. Three parameters have been used to classify the gastric mucosa. The data obtained from this classification are processed by Bayes Theorem and the output is obtained. This study sheds light on the identification of patients with a high risk of cancer and whose endoscopy needs to be done. Korkmaz et al. (Citation2017) proposed a new approach using the machine-learning methods for gastric cancer detection. They used the following methods in the this approach: Histograms Oriented Gradient (HOG) (Korkmaz et al. Citation2017), Artificial Neural Network (ANN) and linear discriminant analysis (LDA). The classification accuracy with proposed method was found to be 88.9%. Korkmaz and Binol (Citation2018) suggested computer-aided methods for early gastric cancer detection. They used the following methods for histopathological gastric images with this purpose: the Artificial Neural Network (ANN), Random Forest (RF), Histogram of Oriented Gradients (HOG) and Local Binary Patterns (LBP). They highlighted the two important points for gastric cancer: (1) ANN classifier performance for gastric cancer has higher accuracy than the RF classifier and (2) LBP properties have higher accuracy than HOG features for ANN classifier. Surf features are used in many kinds of image classification. Vasilakakis et al. (Citation2016) proposed a lesion detection algorithm on video capsule endoscopy images. They used the Bag-of-Color Features. They used the SRF properties in comparing the experimental results. The highest accuracy result found by using this algorithm is 81%. In another endoscopic image study (De Souza et al. Citation2017), surf and sifter features were applied to endoscopic images. They aimed to make an automated computerized diagnosis and classify neoplastic lesions. The optimum-path forest (OPF) and support vector machine (SVM) classifiers were used for this. The best results were obtained with the OPF classifier. The accuracy rate obtained with OPF classifiers by using SRF properties was found to be 73.8%. The histopathological gastric carcinoma (Cosatto et al. Citation2013) was diagnosed by using machine-learning techniques. In this study, medically related nuclei properties were used. The multi-instance learning framework (MIL) was used as a classifier. The sensitivity and specifity values were found to be 90%.
In another study of image processing (Işık Citation2014), the SIFT, SRF, BRIEF, FAST, BRISK, ORB, and MSER features for landscape images in the Oxford data set are compared. It has been suggested that FAST with BRIEF features are faster than other features. In the SRF method, which is an alternative to the SIFT algorithm, the feature extraction stage is faster than SIFT. However, there are cases where the two methods are advantageous compared to each other. The extracted features are different. MSER (Maximally Stable Extremal Regions) algorithm is another feature extraction method used to find stable features. Because the process complexity is close to linear, this algorithm, which works very fast, has been shown to work with stability and high utility (Matas et al. Citation2004). The features obtained in this feature extraction method generally represent complex points that are matte or brighter than those around them (Matas et al. Citation2004).
This paper is consists of Introduction, Theory and method, Experimental Results and Discussion and Conclusion Sections. The aim of this study is to provide a new algorithm to literature for automate the diagnosis of gastric cancer. The following contributions have been made to this article:
1) Until today, SRF, MSER, and BRISK features have been used with some machine-learning methods in some image types and endoscopy images. However, in this article SRF, BRISK, and MSER have been applied to classify the gastric histopathological images.
2) FT, MS, LE, SRF, MSER, and BRISK machine-learning techniques were not used in classifying histopathological images of the gastric carcinoma.
3) So far, only SRF features have been applied to classify gastric endoscopy images. However, in this article, besides SRF features, BRISK and MSER features were also applied to classify the gastric histopathological microscope images.
Theory and method
Data Collecting and Proposed Systems
Gastric images used in this study were taken from Pathology Department of the Fırat University. The use of medical images was verified by the relevant board of directors on April 12, 2016 with file number 07–05. The steps of the proposed algorithms are given in .
Figure 1. Steps of proposed systems.
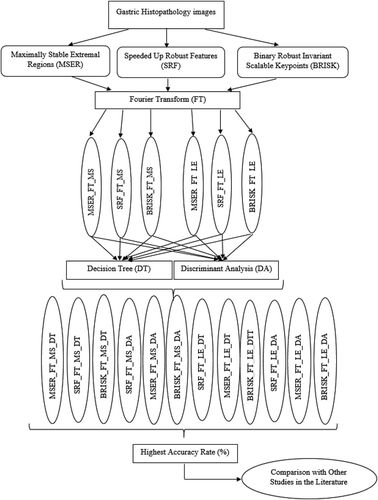
In the first step, the features of Speeded Up Robust Features (SRF), Maximally Stable Extremal Regions (MSER), and Binary Robust Invariant Scalable Keypoints (BRISK) of histopathological gastric images were analyzed.. In the second step, FT was applied to these properties which were calculated to equalize the dimensions of the obtained features. In the third step, MS and LE size reduction methods have been applied. In the fourth step, histopathological gastric images were classified using DT and DA classifiers. In the fifth step, these classification results have been compared.
Maximally Stable Extremal Regions (MSER)
The MSER algorithm is an algorithm used to find circles or ellipse-like shapes (blobs) in images. The algorithm selects key points taking these shapes into account and calculates their attributes on these key points (Matas et al. Citation2002). An MSER region (Matas et al. Citation2004) consists of a set of interconnected points over a certain threshold value, whose persistence is dependent on the changing threshold value. In other words, the selected region is a local binary form that does not depend on a set of threshold values. According to Matas et al. (Citation2004), the findings of MSER regions are in good agreement with those obtained by Watershedding’s method. The threshold value is changed to vary between 0 and 255, while regions connected to one another, which do not change or change very little in all scenes, are called as MSER regions.
In the implementation of the method, the image points are sorted by the brightness value. The points are placed in the image in ascending or descending order. During this process, the component regions and the fields of these regions are kept in a list by finding with Union-finder algorithm. At each step of the thresholding process, the small region with the association of the two regions is included in the large region. The smaller region is removed from the list. The threshold values at which the variation of the zone area is minimized by increasing/decreasing the threshold value are selected as the threshold ranges producing the maximum stable extremal zones. In other words, the boundaries of the end regions formed by the connected components at all threshold values are represented as a series of contiguous regions. This sequence provides the
condition. It is need to be a local minimum in
value of the
expression in order to select as the maximum stationary the Qi* end region in the array (Güney and Arıca Citation2009). In this expression,
denotes the area of the region and
value denotes a parameter of the method. The
sign also indicates that there are local minimum for both decreasing and increasing threshold values. This process is applied on all the region arrays in the set of extremal regions to obtain the maximum extremal stable regions (Güney and Arıca Citation2009).
In the MSER method, neighboring image points having a similar color are subjected to clustering based on the stacked clustering. For clustering process, the color distances of four or eight neighboring points to one another are kept at an associated list. At each step of the algorithm, , the image points are labeled progressively. If the coordinate space of the image points is denoted as a set of labels
, each step is expressed as
mapping. As a result of the labeling, the connected points that have the same label determines the image end regions.
The distance between all neighboring points of the image extremal region must be lower than , which is a threshold value calculated for the step in question. The distance of the image points in the color space is calculated using the chi-square distance. Initially, all values in the
label image are labeled as 0. In
tag image, all neighbor points with a distance less than
are labeled as new region and
tag image is obtained (Güney and Arıca Citation2009). Due to the spatial relationship between the image points, the distances of all neighboring points do not show a uniform distribution. The vast majority of distances have small values, and large distance values in a few numbers exist. Therefore, at each step, the threshold value is increased linearly, resulting in a very rapid number of tag changes at the beginning. Thus, to the end of the steps, the labels of many points change (Güney and Arıca Citation2009). In order to change the label of an equal number of image points in each step, the distance between all neighboring points in the image is taken as a random variable and the threshold values are modified according to the ordered reversal of the cumulative distribution function (CDF) of this random variable (Güney and Arıca Citation2009). The chi-square CDF for colored images is calculated as follows:
where μ is the mean of the sample set. Thus, the threshold values after the average estimate are obtained as follows:
Next, field changes of the extremal regions detected by increasing the value of at each step are checked, and maximum stationary ones are detected. In addition, those smaller than a given value are eliminated from the maximum stable extremal regions (Güney and Arıca Citation2009).
Binary Robust Invariant Scalable Keypoints (BRISK)
The BRISK algorithm is an algorithm that takes less time as processor time than SRF algorithm and performs better than SRF algorithm. It is the bit sequence used to compare the densities of the pixels in the neighborhood of each key point, in addition to the keypoint finding method used in the FAST algorithm because it takes less time. While the local attributes obtained in SIFT, SRF, and similar methods can represent an image in some transformations, such as rotation, change of view angle, and other distortions, the descriptors obtained from these methods cause very troubles in situations where network load is limited or very large conditions are required. Because of this reason, many binary descriptors have emerged. The FAST-based BRISK method (Leutenegger, Chli, and Siegwart Citation2011) is only one of these. In general, BRISK consists of three parts: sampling pattern, directional compensation, and sample pairs. Taking a sample pattern here means getting points on the circle in the FAST method. The sample pairs are then separated into two subgroups: short-distance and long-distance pairs. For effecting rotation, the long-distance pairs are determined by looking at the sum of the gradient values, and the short-distance pairs are rotated according to the directions in which they are obtained. Finally, the brightness values of the first and second points are compared for all pairs. If the value of the first point is greater than the second value, the output is 1; otherwise, the output is 0. Thus, a descriptor consisting of 512 bits for 512 pairs is created. The Hamming distance, which runs in a shorter time than the Euclidean distance, is used in the matching phase. To realize this, only looking at the total value of the XOR operation is sufficient to compare binary identifiers.
Classical Multidimensional Scaling (MS)
The multidimensional scaling (MS) is calculated between each pair of training instances. MS starts from a concept of distance (Bengio, Citation2004; Korkmaz and Binol Citation2018; Van Der Maaten, Postma, and Van Den Herik Citation2009). The MS is calculated as follows:
Local Linear Embedding (LE)
The measurement that protects embedding the local geometry at the each data point is called the local linear embedding (LE) algorithm. The LE is calculated as follows (Bengio, Citation2004; Korkmaz and Binol Citation2018):
Embedding uninteresting except the smallest eigenvector of L is achieved from the minimum eigenvector, because (1,1, …., 1) eigenvalue is 0. The biggest eigenvectors of are lowest eigenvectors of L.
Decision Trees
DT is starting from a root and proceeding at decision nodes and eventually ending in labeled leaves a classifier and supervised learning inclusion. When you go from root to leaf, you can reach it very quickly when you handle half of each flow of data in decision-making. In the best case, for n number nodes decide log2 n reached the result (Aki Citation2017; Alpaydin Citation2014; Özkan Citation2008). Entropy in the form of a sum of the probabilities in a T is expressed as follows:
where T class is feature and entropy is available for class T feature. The weighted averages of each property, on a class basis, are calculated as follows:
Here, entropy is calculated for each X property of class T. The total number of T values is the number of values that the H (Ti) is the entropy value calculated for the value i of the T property. For each property, the information gain is calculated as follows:
In this way, the feature that yields the highest gain is treated as the root node of the tree. The remaining values are recalculated to form the other branches and nodes of the DT, and each subnode is added as the highest earning property. While the ID3 algorithm only applies to category-based classification, the C4.5 algorithm, which is the improved version of the same algorithm, allows the use of features with numerical values in decision nodes. The threshold value is used in decision mechanisms in which numerical properties are used. DTs are created by calculating the earnings separately for the divided values (Aki Citation2017).
Discriminant Analysis
In the case of more than one class, the analysis used in the Fisher discriminant derivative can be extended to find a subspace that is observed to contain variability of all classes. Let’s assume that each class C has a mean of one μ and the same Σ covariance. The class variability is defined as the sample covariance of class averages:
where μ is the average of the class averages. The w r-oriented class distinction is given as follows:
The eigenvalue vector for is the eigenvalue corresponding to the difference between the classes. Since
rank has these nonzero eigenvalues, the properties of the vectors contain a vector that defines the subspace. These vectors can be used especially for vector reduction. The eigenvalues with the smallest value will be very sensitive to the good selection of the training data and may need an arrangement. If classification is needed instead of size reduction, there are a number of alternative methods. For example, after classes have been separated, the standard Fisher discriminant or DA method can be used to classify each difference. In a commonly used example, a class is placed in a group and everything else is placed in another group and the DA is applied. The end result is that the results are grouped together as a C classification. Another common use is binary classification. Here a classifier is assigned for each pair of classes and the classifiers are grouped together to form a final classification. In practice, class averages and covariances are unknown. However, they can be estimated from the training set. Even if these estimates are considered to be optimal estimates, they will be the replacement of actual values. Another difficulty in applying DA to real data is in the cases where the number of samples of each example exceeds the number of samples. DA is often used in financial applications. These applications include bankruptcy prediction algorithms, production management, income estimation algorithms, and market research. This method is also used in positioning and face-recognition areas (Karakitsos et al. Citation2004).
Experimental Results and Discussion
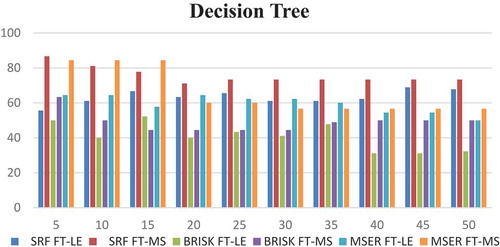
In this article, a total of 180 images with a size of 2592 × 1594 were analyzed. Ninety of these images were used for testing purposes and 90 were used for educational purposes. First, MSER, SRF, and BRISK features have been obtained. The dimensions of these properties have been found to be different. To reduce the size of these features to the same size, Fourier transformations have been applied to these features. The size of the total data obtained from the Fourier Transform is 286592 × 180 for each image. Then, MS and LE size reduction methods were applied to these feature values which are applied Fourier transform. When these features are selected, the following numbers of features are taken into account: 5, 10, 15, 20, 25, 30, 35, 40, 45, and 50. These selected properties have been given to DT and DA classifiers.
As seen in and , the results obtained with FT-MS-DT in all specifications are higher than those obtained with FT-LE-DT. When five features were selected, the highest accuracy rate obtained with FT-MS-DT was 86.66%. However, when 45 features were selected, the highest accuracy result obtained with FT-LE-DT was 68.88%. In addition, when the performances of the DT classifier in are compared, it is seen that the SRF, BRISK, and MSER features have the highest result with SRF properties. As can be seen in and , the SRF features give better results than the BRISK and MSER features for recognition of the histopathological images of the gastric with DT classifier. In addition, it is understood that FT-MS method gives better results than FT-LE method.
Table 1. Accuracy result obtained with decision tree classifier according to selected features.
Figure 2. Compared of the accuracy result obtained with decision tree classifier.
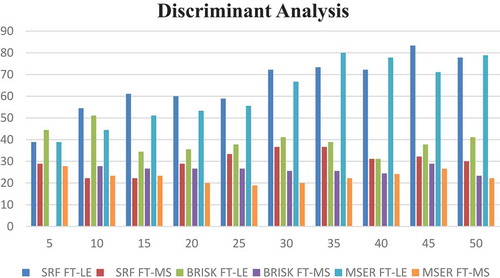
As seen in and , the results obtained with FT-LE-DA in all specifications are higher than those obtained with FT-MS-DA. If we compare the results according to the features, the highest result obtained with FT-LE-DA and selected 45 features is 83.33%. However, the highest accuracy result obtained with FT-MS-DA and selected 30 features is 36.66%. In addition, has the same situation as . When the performances of DA classifier are compared, it is seen that the highest result is obtained with SRF properties according to BRISK and MSER properties. As can be seen in and , the SRF features give better results than the BRISK and MSER features for recognition of the histopathological images of the gastric with DT classifier. It is evident that FT-LE method gives better results than FT-MS method.
Table 2. Accuracy result obtained with discriminant analysis classifier according to selected features.
Figure 3. Compared of the accuracy result obtained with discriminant analysis classifier.
In this article, machine-learning techniques were applied to gastric histopathological images. There are studies in the field of health done by using different classifiers. Also, there have been many studies done for the early diagnosis of different cancer types. Many studies have been done in the field of gastric. However, the number of patients who die from cancer is still present. New methods and applications are needed to increase the early detection rate. The purpose of this article is to provide a new computer-aided application with machine-learning techniques in order help to doctors for early diagnosis. In this article, 180 images taken from Fırat University Hospital were used. Ninety of them were used for testing purposes and 90 were used for testing purposes. No pre-processing has been applied to the images. First, MSER, SRF, and BRISK features were found for images. The dimensions of the obtained these properties are different. The Fourier transformations were applied to reduce the size of these features to the same size. MS and LE size reduction methods have been applied to the property values obtained after Fourier Transformation. 5, 10, 15, 20, 25, 30, 35, 40, 45, and 50 features were selected with MS and LE methods. These selected features have been given to DT and DA classifiers. Accuracy results were obtained for selected 5, 10, 15, 20, 25, 30, 35, 40, 45, and 50 features. The obtained highest accuracy result was found by using SRF features, FT, MS, and DT methods. In comparison, the highest accuracy result was found to be 86.66%. The fast and multimodality computerized decision support systems can be beneficial to patients for early detection of gastric diseases. It may facilitate early diagnosis of the disease.
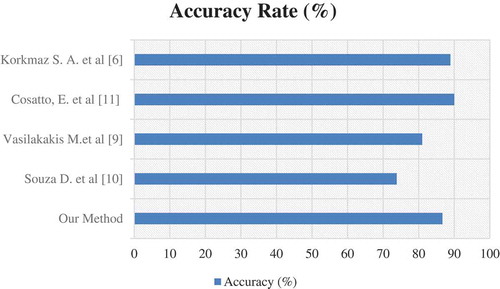
The following three highlights are obtained in this article: (1) the SRF features gave better results than the BRISK and MSER features. (2) Better performance results were obtained with the LE size reduction method in the DA classifier, while better performance results were obtained with the MS size reduction method in the DT classifier. (3) DT classifier showed better performance than DA classifier. In and , the accuracy of performance in studies performed by the Souza and Vasilakakis is found to be 73.8% and 81%. They worked on endoscopy images. The accuracy results found in these studies are lower than in our study. Histopathological images were used in our study. The accuracy performances were found to be 90% and 88.9% with the histopathological images in the study of Cosatto and Korkmaz, respectively. The accuracy results found in these studies are higher than in our study. However, SRF, BRISK, MSER, FT, MS, LE, DA, and DT methods were not used in these studies. For this reason, a new algorithm has been obtained to literature to help early diagnosis of gastric cancer with this study.
Table 3. Comparison of the accuracy results of our study with other methods.
Figure 4. Comparison with our article of studies in the literature.
Conclusion
Until today, many classification methods were used in the field of health (Das, Turkoglu, and Sengur Citation2009; Ergün Citation2009; Ergün et al. Citation2004; Hardalaç et al. Citation2004; Ozcift and Gulten Citation2011; Sengur Citation2012; Şengür Citation2008; Yildirim et al. Citation2004). This article presents the development and evaluation of a computerized Decision Support System (DSS), aiming to show the feasibility and potential toward maximizing the benefits of a new algorithm by combined the machine-learning techniques which are not used in the literature for automatic recognition of the gastric images. First, Speeded Up Robust Features (SRF), Maximally Stable Extremal Regions (MSER), and Binary Robust Invariant Scalable Keypoints (BRISK) features of histopathological gastric images have been performed. Then, FT was applied to these properties which were calculated to equalize the dimensions of the obtained features. In addition, MS and LE size reduction methods have been applied. Histopathological gastric images were classified using DT and DA classifiers. These classification results have been compared. The highest accuracy result obtained in this article has been found to be 86.66% with SRF_FT_MS_DT method. Fast and multimodality computerized decision support systems can be beneficial to patients for early detection of gastric diseases. It may facilitate early diagnosis of the disease. The success rate obtained with these methods is compared with other classification results in the literature. According to the other methods, success rate for gastric microscopic images is found to be higher. In future studies, an analysis will be performed by applying different methods to different type images.
Acknowledgments
The author thanks Prof. Dr İbrahim Hanifi ÖZERCAN in the pathology department of the Fırat University Hospital. The author also thanks Dr Hamidullah BINOL in the Florida International University.
Declaration of interest
Sevcan Aytaç Korkmaz declares that she has no funding and competing interests.
References
- Aki, M. O. 2017. Sürücü uykululuğunun gerçek Zamanlı Görüntü İşleme ve Makine Öğrenmesi Teknikleri ile Tespitine Yönelik Bir Sistem Tasarımı ve Uygulaması. Turkey: Trakya Üniversitesi, Fen Bilimleri Enstitüsü.
- Alpaydin, E. 2014. Introduction to machine learning. Microtome Publishing, MA:MIT press.
- Bengio, Y., et al. 2004. Out-of-sample extensions for lle, isomap, mds, eigenmaps, and spectral clustering. Advances in neural information processing systems, Montréal, Kanada, 177–84.
- Cosatto, E., Laquerre, P. F., Malon, C., Graf, H. P., Saito, A., Kiyuna, T., ... & Kamijo, K. I. 2013. Automated gastric cancer diagnosis on h&e-stained sections; ltraining a classifier on a large scale with multiple instance machine learning. In Medical Imaging 2013: Digital Pathology (Vol. 8676, p. 867605). International Society for Optics and Photonics.
- Das, R., I. Turkoglu, and A. Sengur. 2009. Diagnosis of valvular heart disease through neural networks ensembles. Computer Methods and Programs in Biomedicine 93 (2):185–91. doi:10.1016/j.cmpb.2008.09.005.
- De Souza, L. A., L. C. S. Afonso, C. Palm, and J. P. Papa 2017. Barrett’s esophagus identification using optimum-path forest. Graphics, Patterns and Images (SIBGRAPI), 2017 30th SIBGRAPI Conference on October, Niteroi, Brazil, 308–14. IEEE
- Ergün, U. 2009. The classification of obesity disease in logistic regression and neural network methods. Journal of Medical Systems 33 (1):67–72. doi:10.1007/s10916-008-9165-5.
- Ergün, U., S. Serhatlioğlu, F. Hardalaç, and I. Güler. 2004. Classification of carotid artery stenosis of patients with diabetes by neural network and logistic regression. Computers in Biology and Medicine 34 (5):389–405. doi:10.1016/S0010-4825(03)00085-4.
- Güney, M., and N. Arıca. 2009. Desen Tabanlı İlgi Bölgesi Tespiti. Journal of Naval Science and Engineering 5 (1):94–106.
- Hardalaç, F., A. T. Ozan, N. Barişçi, U. Ergün, S. Serhatlioğlu, and I. Güler. 2004. The examination of the effects of obesity on a number of arteries and body mass index by using expert systems. Journal of Medical Systems 28 (2):129–42.
- Işık, Ş. 2014. A comparative evaluation of well-known feature detectors and descriptors. International Journal of Applied Mathematics, Electronics and Computers 3 (1):1–6. doi:10.18100/ijamec.60004.
- Karakitsos, P., T. M. Megalopoulou, A. Pouliakis, M. Tzivras, A. Archimandritis, and A. Kyroudes. 2004. Application of discriminant analysis and quantitative cytologic examination to gastric lesions. Analytical and Quantitative Cytology and Histology/The International Academy of Cytology [And] American Society of Cytology 26 (6):314–22.
- Korkmaz, S. A., & Binol, H. (2018). Classification of molecular structure images by using ANN, RF, LBP, HOG, and size reduction methods for early gastric cancer detection. Journal of Molecular Structure, 1156, 255-263.
- Korkmaz, S. A, et al. 2017. A expert system for gastric cancer images with artificial neural network by using HOG features and linear discriminant analysis: HOG_LDA_ANN. Intelligent Systems and Informatics (SISY), 2017 IEEE 15th International Symposium on. IEEE, 000339–42
- Kourou, K., T. P. Exarchos, K. P. Exarchos, M. V. Karamouzis, and D. I. Fotiadis. 2015. Machine learning applications in cancer prognosis and prediction. Computational and Structural Biotechnology Journal 13:8–17. doi:10.1016/j.csbj.2014.11.005.
- Leutenegger, S., M. Chli, and R. Y. Siegwart. 2011. BRISK: Binary robust invariant scalable keypoints,” Computer Vision (ICCV), 2011 IEEE International Conference on, Barcelona, Spain. 2548–55
- Matas, J., O. Chum, M. Urban, and T. Pajdla 2002. Robust wide-baseline stereo from maximally stable extremal regions, British Machine Vision Conference, S.384–393
- Matas, J., O. Chum, M. Urban, and T. Pajdla. 2004. Robust wide-baseline stereo from maximally stable extremal regions. Image And Vision Computing 22 (10):761–67. doi:10.1016/j.imavis.2004.02.006.
- Ozcift, A., and A. Gulten. 2011. Classifier ensemble construction with rotation forest to improve medical diagnosis performance of machine learning algorithms. Computer Methods and Programs in Biomedicine 104 (3):443–51. doi:10.1016/j.cmpb.2011.03.018.
- Özkan, Y. 2008. Veri madenciliği yöntemleri. Turkey: Papatya Yayıncılık Eğitim.
- Şengür, A. 2008. An expert system based on principal component analysis, artificial immune system and fuzzy k-NN for diagnostic of valvular heart diseases. Computers in Biology and Medicine 38:329–38. doi:10.1016/j.compbiomed.2007.11.004.
- Sengur, A. 2012. Support vector machine ensembles for intelligent diagnosis of valvular heart disease. Journal of Medical Systems 36 (4):2649–55. doi:10.1007/s10916-011-9740-z.
- Shayan, Z., N. Mohammad Gholi Mezerji, L. Shayan, and P. Naseri. 2016. Prediction of depression in cancer patients with different classification criteria, linear discriminant analysis versus logistic regression. Global Journal of Health Science 8 (7):41. doi:10.5539/gjhs.v8n7p41.
- Van Der Maaten, L., E. Postma, and J. Van Den Herik. 2009. Dimensionality reduction: A comparative. Journal of Machine Learning Research 10:66–71.
- Vasilakakis, M., et al. 2016. Weakly-supervised lesion detection in video capsule endoscopy based on a bag-of-colour features model. International Workshop on Computer-Assisted and Robotic Endoscopy. Athens, Greece: Springer, Cham.
- Yildirim, H., H. B. Altýnsoy, N. Barýpçý, U. Ergün, E. Oğur, L. F. Hardalaç, and I. Güler. 2004. Classification of the frequency of carotid artery stenosis with MLP and RBF neural networks in patients with coroner artery disease. Journal of Medical Systems 28 (6):591–601.
- Yoshihiro, S., H. Ryukichi, Y. Tetsuro, H. Norihiro, M. Tatsuya, et al. 2010. Computer-aided estimation for the risk of development of gastric cancer by image processing. Artificial Intelligence in Theory and Practice III 331:197–204. 15.