
ABSTRACT
The main source of water in the Gaza Strip is the shallow aquifer which is part of the coastal aquifer. The quality of the groundwater is extremely deteriorated in terms of nitrates and salinity. The Gaza Strip is mostly in catastrophic conditions that desire imperative and great efforts to improve the water situation on conditions of both quality and quantity. In this study, performance of two artificial networks was evaluated to determine which one would have more efficiency in predicting nitrate concentrations of groundwater wells used for desalination purpose in the southern area of Gaza Strip. Multiple layer perceptron (MLP) and radial basis function (RBF) neural networks are trained and developed with reference to seven important variables including pH, EC, TDS, hardness, calcium, magnesium, and abstraction rate. These variables are considered as inputs of the network. The data sets used in this study consist of six months and collected from 15 groundwater wells in Khan Younis and Rafah area. The network performance has been tested with different data sets and the results showed satisfactory performance. The prediction results of the MLP neural network were found to be better than RBF. Prediction results prove that neural network approach has good and wide applicability for modeling nitrate in the groundwater wells of Gaza Strip coastal aquifer. We hope that the established model will help in assisting the local authorities in developing plans and policies to improve the water quality in the Gaza Strip to acceptable levels.
In the recent years, groundwater as one of the primary sources of drinking water is being exposed to a gradually severe contamination. Some studies have revealed that nitrate nitrogen (NO3-N) is the maximum common groundwater contaminant (Ehteshami and Biglarijoo Citation2014). The nitrate in drinking water can cause various types of cancer. Thus, the maximum permissible concentration for drinking water was determined below 10 ppm of NO3-N in USA, or 45 ppm according to the reference of the World Health Organization (WHO) as reported by Ehteshami, Sefidkar Langeroudi, and Tavassoli (Citation2013).
The main source of water in Gaza Strip is the shallow aquifer which is part of the coastal aquifer. The quality of the groundwater is enormously deteriorated in terms of nitrates and salinity (Al-Mahallawi et al. Citation2012). The Gaza Strip is mostly in catastrophic conditions that desire imperative and grave efforts to improve the water state on conditions of both quality and quantity. The Gaza Strip is suffering from shrink of obtainable clean water owing to the overpumping of the groundwater, which is the only resource for household uses. This crisis became more critical as a result of time due to seawater intrusion in the direction of the coastal aquifer, adding up to the infiltration of incompletely treated wastewater to the aquifer (Shomar et al. Citation2010). The high level of salinity and nitrate in the water and other pollutants and its bad health effect, as well as undesirable tastes are reasons to find out new supply source such as the desalination and quality enhancement technology adding together to their means. The concentration of chemical contaminants consisting of nitrate and chloride have exceeded the standards suggested by WHO (Al-Najar and Adeloyde Citation2005) from most of the municipal wells. Nitrate is soluble and negatively charged and consequently has a high movement and possible for loss from the unsaturated area by seepage process. Increased nitrate concentrations in drinking water can cause methemoglobinaemia in infants and stomach cancer in adults (Hall et al. Citation2001). Nitrate is the most common pollutant found in shallow aquifers due to both point and nonpoint sources (Postma et al. Citation1991). The extensive use of fertilizers is considered a main nonpoint source of the nitrate that leaches to groundwater (Chowdary, Rao, and Sarma Citation2005). Many studies have shown high concentrations of nitrate in areas with septic tanks (Amade Citation1999; Cantor and Knox Citation1984; Keeney Citation1986; MacQuarrie, Sudicky, and Robertson Citation2001). In the Gaza Strip, nitrate contamination of groundwater is caused by infiltration of fertilizers and raw sewage. Owing to the critical shortage of water and the poor quality of groundwater, desalination plants were established in the Gaza Strip.
An artificial neural network (ANN) is a computational model designed to mimic the human brain and nervous system. Contrasting many statistically based water quality models, which adopt that the relationships between response parameters and prediction parameters are linear and normally disseminated, ANNs can represent the nonlinear relationships among the parameters that are distinguishing of ecosystems (Kuo et al. Citation2006; Maier, Morgan, and Chow Citation2004). In recent years, a number of studies have focused on the use of ANN models for predicting river water quality (Khuan, Hamzh, and Jailani Citation2002; Lee et al. Citation2003; Diamantopoulou, Antonopoulos, and Papamichail Citation2005; Kuo et al. Citation2006; Najah et al. Citation2009; Salami and Ehteshami Citation2015;, Citation2016; Ehteshami, Dolatabadi, and Tavassoli Citation2016; Sarkar and Pandey Citation2015). The ANNs have been widely used in various studies on surface water pollution control for predicting stream nitrogen concentration (Lek, Maritxu, and Giraudel Citation1999), forecasting raw water quality parameters, prediction of water quality parameters, water quality management (Wen and Lee Citation1998), and identification of nonpoint sources of microbial contamination (Zaheer and Cui Citation2003). Due to increased agricultural activity which is necessary for enhanced food production and also due to industrial activity, there is an increasing evidence of nitrate pollution of groundwater (Prakasa Rao and Puttanna Citation2000). Very little work has been done so far in building stochastic models to predict nitrate concentration in groundwater using regression and neural networks. Ray and Klindworth (Citation2000) utilized ANNs to predict the pesticide and nitrate contamination in rural private wells. They used depth to aquifer materials from land surface, well depth and distance to cropland as input parameters and concentration of pesticides or nitrates were the outputs. Ramasamy et al. (Citation2003) used regression and neural networks to model nitrate concentration in groundwater. Almasri and Kaluarchchi (Citation2005) used modular neural networks (MNN) to simulate the nitrate concentration in an agriculture-dominated aquifer. Those MNN simulations are further analyzed and compared to obtain from a physically based fate and transport model to evaluate the overall applicability of MNN. Yesilnacar et al. (Citation2008) predicted nitrate concentration in groundwater using four parameters of temperature, electrical conductivity, groundwater level and pH as input parameters in the ANN. The Levenberg–Marquardt (LM) algorithm was selected as the best one within 12 back propagation (BP) algorithms and optimal neuron number was determined as 25. Zare Abyaneh et al. (Citation2010) used ANN and linear regression (LR) methods to relate groundwater nitrate concentration to other water quality parameter. Maedeh et al. (Citation2013) used ANN to predict total dissolved solids (TDSs) variations in groundwater of Tehran Plain, Iran. Cordoba (Citation2011) used multi linear regression and ANN models for the evaluation and prediction of some drinking water quality parameters within a water distribution system. Al-Mahallawi et al. (Citation2012) applied ANN technique as a new type of model to approximate the nitrate contamination of the Gaza Strip coastal aquifer. A set of six variables for 139 sampled wells was used and that have a significant influence were identified by using ANN model. Recently, one study has been conducted to predict nitrate concentration in the ground water aquifer of Gaza Strip. The ANN models were trained using water quality data from 22 municipal wells in Gaza coastal aquifer, for the period 2000–2009 (Alagha et al. Citation2013). It was expected that the ANN developed models can be used as a good option instead of the conventional method that used previously for calculating the water quality index. ANNs as a tool are still not widely used in the field of groundwater nitrate contamination prediction and forecasting.
The aim of this paper was to study of ANN modeling to predict nitrate concentration in 15 groundwater wells used for desalination purpose in the southern area of Gaza Strip (Khan Younis and Rafah areas). Two types of neural network models were used to measure the predictive performance efficiencies of each network. However, the results from two different neural network algorithms were compared and analyzed.
Material and methods
Study Area
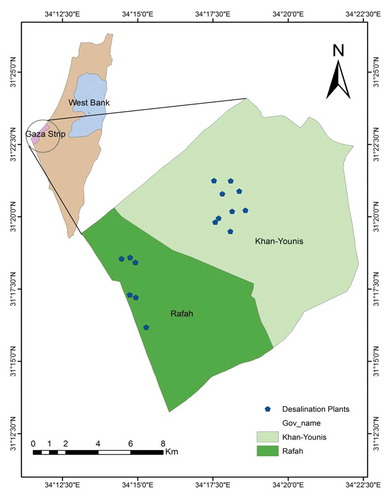
The Gaza Strip is a narrow strip of land on the eastern coast of the Mediterranean Sea. It is located in the southeastern coast of Palestine with longitudes of [34º 20’’ and 34º 25’’ E] and Latitudes of [31º 16’’ and 31º 45’’ N]. The total area of Gaza Strip is about 365 km2 with approximately 42 km long and between 6 and 12 kilometers wide in the south (Aish, Zaqoot, and Abdeljawad Citation2015). In order to investigate the possibility of ANN technology for predicting the nitrate concentration of underground water wells and have a clear and better picture of water wells pollution in the coastal aquifer of Gaza Strip, particularly in the southern area, Khan Younis and Rafah governorates are selected as sampling sites for this study. The selected underground water wells are shown in .
Figure 1. Map shows selected water wells in Khan Younis and Rafah.
Water Samples Collection and Analysis
The water samples were collected and analyzed using the international protocols. A 500-ml and one liter bottles were used for collecting water samples. All samples were refrigerated at a temperature of 1–4 ºC during transit to the laboratory. The water samples were analyzed next day of collection. The samples of water were collected once every month for a period of six months, the selected parameters including: abstraction rate, TDS, total hardness, pH, conductivity, calcium, magnesium, and nitrate. Samples were analyzed in laboratories of Palestinian Ministry of Health (Public Health Lab-Gaza) and Water and Environment institute at Al-Azhar University-Gaza, Palestine. Electrical conductivity and pH were measured directly in the field using a portable instrument called Electrochemistry made by CIBA-CORNING. The abstraction rate is a measure of how much water can be withdrawn from the well over a period of time and measured in m3/hour or m3/day. The abstraction rate was calculated on monthly basis for each well. The nitrate concentrations were measured by using ultraviolet spectrophotometer (company: Labomed–model: Spectro UV-Vis Auto 2602). The spectrophotometer was adjusted to wave length at 220 nm. The TDSs were measured by using the oven method. EDTA titration method was used to measure total hardness in water samples. The calculation method was used to measure the presence of magnesium in collected water samples using the following equation: Mg+2 ppm = {Hardness – (2.5* Ca+2 ppm)}/4.12. For measuring calcium concentration in water, EDTA titration method was used (APHA Citation2005). The equation used for calcium level calculation is given as follows:
ppm as Ca+ 2 = V2 (EDTA) * Factor; Factor = (N * 1000/V1) * 40; N: Normality of EDTA = 0.05N
Data Statistical Analysis
The water quality data is generated and being used to develop ANN predictive models to predict the water quality for assessing desalination plants performance in Khanyouins and Rafah governorates in the Gaza Strip. The generated data were entered as Microsoft Excel sheets, uploaded to Statistical Package for Social Sciences (SPSS) and analyzed using min, max, mean, standard deviation (SD), and coefficient of variation (CV) tools. In addition the Pearson correlation coefficient (a measure of linear association) is used to measure the linear association among the selected parameters in both training and testing data sets. The training and testing of the developed ANN predictive models were carried out using neural network toolbox in the language of technical computing (Matlab). Two types of feedforward networks are used. They are multilayer perceptron (MLP) and radial basis function (RBF) neural networks.
ANN Theories
The ANN models are increasingly being used for forecasting or simulating water resources variables because they are often capable to model complex systems with unknown or difficult behavioral rules or underlying physical processes. The ANN is a nonlinear modeling tool capable of handling a large number of inputs (independent variables) to determine one or more outputs-dependent variables (Fogelman et al. Citation2006). There are many types of neural networks for various applications available in researches. The MLP is a widely used ANN configuration and has been frequently applied in the field of hydrological modeling (Leahy, Kiely, and Corcoran Citation2008). This study evaluates the utility of MLP and RBF neural networks for estimating nitrate concentrations in underground water wells.
The MLP is the simplest and therefore most commonly used neural network architectures. provides an overview of the structure of this network. The MLP consists of three layers of neurons: (1) an input layer; (2) an output layer, and (3) intermediate (hidden) layer or layers. Each neuron has a number of inputs (from outside the network or the previous layer) and a number of outputs (leading to the subsequent layer or out of the network). A neuron computes its output response based on the weighted sum of all its inputs according to an activation function (Dawson et al. Citation2006). A simple MLP was used in this study. It is a network with seven input variables, a hidden layer with nine processing neurons, and one output variable nitrate. For a simple regression analysis, the units in the input layer introduce normalized or filtered values of each input variable into the network, then these values are transferred to all units of the hidden layer multiplied by a “weight” factor that is, in general, different for every connection, and its magnitude characterizes the importance of some connections (). In the present study, several training algorithms (i.e., Resilient backpropagation, LM, Variable learning rate backpropagation, Broyden Fletcher Goldfarb Shanno (BFGS) Qusai-Newton, Bayesian rule and Gradient descent) were applied to train the MLP network. Two different transfer functions (i.e., Sigmoid and Tanh) were also used to obtain the best results with respect to nonlinearity of this phenomenon. Finally, the best learning algorithm, activation function, and architecture of the network (the number of neurons in hidden layers) were determined by trial and error.
Figure 2. Architecture of MLP neural network model used in this study.
RBF neural network is a type of feedforward neural network that learns by using a supervised training method. One particular feature of RBF is that account decreases or increases with distance from a center point. Furthermore, it had seemed that RBF networks are able to estimate any practical continuous function mapping with acceptable degree of precision (Broomhead and Lowe Citation1988). The RBF network, which has three layers, can look as a special class of multilayer feedforward networks. Each neuron in the hidden layer employs a RBF, such as the Gaussian Kernel, as an activation function. The output neurons implement a weighted sum of hidden neuron outputs. The network is centered at the point specified by the weight vector associated with the unit. Both the centers and the widths of these functions are learnt from training patterns. Each output unit implements a linear combination of these RBFs. The method for training RBF networks can be made in two steps. The first step includes the determination of a proper set of centers and widths. The second step involves with the determination of the connection weights from the hidden layer to the output layer (Haykin Citation2007). Definitely, choice of RBF network centers is the most critical problem in constructing the network. These ought to be placed according to the difficulties of the data to be predicted. A number of different approaches have been suggested for the selection of proper RBF centers (Chen, Cowan, and Grant Citation1991).
Data Processing and Training
At initial step of the groundwater wells nitrate concentrations prediction, inlet water quality data of selected desalination plants in Khan Younis and Rafah governorates were taken, over a period of 6 months beginning from September 2013 to March 2014. A total of 15 wells are selected for the prediction purpose. The main chosen water quality variables include: pH, EC, TDS, total hardness, calcium, magnesium, nitrate, and abstraction rate. Because the input and output variables have very different orders of magnitude, it is recommended to rescale the data. In this way, more reliable predictions can be made. The normalization of data is usually done with {0, 1} (Saen Citation2009). However, in this study the variables are rescaled to be counted within the interval {0, 1} which could cover all differences of the data sets used for the construction of ANN predictive models. The objective of training process is to achieve accurate ANN model structure. In training process, the choice of the transfer function, learning rate, momentum, exit condition setting, root mean square error (RMSE), and validation of the model are needed. Network training can be carried out using local or global methods. Local methods include two classes: first-order and second-order techniques. First-order techniques are based on a linear model (gradient descent) while second-order techniques are based on a quadratic model such as Newton’s method. In both cases, iterative method is used to reduce the error task (Parisi, Ricci-Tersenghi, and Ruiz-Lorenzo Citation1996). The global techniques have capability to escape local minima in the error surface and also capable in finding optimal or near optimal weight measures. In the stochastic gradient algorithms, the error function does advantage the network to escape local minima in the error surface. During the training process, these supportive factors are slowly separated (Hassoun Citation1995).
In the present study, training and testing of the networks were accomplished on Matlab version 7.11 Release 2010b, Mathworks, Inc. In Matlab, the criteria used to evaluate the fitness of each potential solution are the lowest cost achieved during the training run. To avoid over training, early stopping technique was used in training (Erenturk and Erenturk Citation2007). This method is done automatically in Matlab software. So that, as soon as over training of ANN occur, then ANN training stops. The best MLP network was trained by using the backpropagation incorporated with LM algorithm. The tangent hyperbolic function was used as activation function in the hidden layer neurons. The linear activation function is used in the output layer neurons. The RBF network was trained by using the backpropagation incorporated with the Orthogonal Least Squares algorithm and the Gaussian RBF was used as activation function in the hidden layer. The linear activation function is used in the output layer.
Results and Discussion
The basic statistics analysis for groundwater samples are listed in . All values of pH for the groundwater wells were found to be within WHO and Palestinian standards (PS), and the values ranged between 6.40 and 8.35 with an average of 7.52. The EC, TDS, and nitrate concentration values (1277–5730 μS/cm; 791.7–3552.6 mg/l; 49–394.8 mg/l) were found to be exceeding the maximum concentrations allowed by WHO and PS for all water samples. The values of total hardness were ranged between 208.80 and 840.18 mg/l, where about 51% of the samples were found to be in compliance with WHO and PS standards. The values of calcium were ranged between 30.30 and 170.40 mg/l, where about 63% of the samples were found to be within WHO and PS. The values of magnesium were ranged between 21.50 and 125.81 mg/l, with an average of 71.21 mg/l. There were about 55% of magnesium values within WHO standards and about 80% within PS drinking water standards. The monthly average of abstraction rate was found to be 330–52440 m3/month. The statistical analysis of training and testing data sets showed that nitrate concentration values are ranged from 55.38–394.78 mg/l for training data set and from 49–387.37 mg/l for testing data set. The average value among all selected wells used for desalination purpose to both training and testing data sets is 220.66 and 199.38 mg/l, respectively.
Table 1. Descriptive statistics of the selected parameters.
The statistical study showed a negative strong correlation between nitrate and pH for both training and testing data sets whereas r values found to be −0.60 and −0.68, respectively. Moderate positive correlation found to be between nitrate and hardness, calcium and magnesium for both training and testing data sets, whereas the r values are found to be (0.48;0.52;0.40) and (0.62;0.61;0.58), respectively. A positive close to moderate correlation is found to be between nitrate and EC as well as TDS for both training and testing data sets, whereas the r values are (0.20;0.20) and (0.25;0.25), respectively. The correlation between nitrate and abstraction rate is found to be positive and poor for both training and testing data sets, whereas the r values are 0.13 and 0.18, respectively.
Because of the lack of theoretical foundations, training a neural network requires a long trial and error process, experimenting different combinations of learning rates, momentum terms, transfer functions, and network architectures. The determination of the learning rates and other network parameters is fundamental to train the network successfully. So as to overcome this difficulty, LM algorithm is used in this work to reduce the arbitrary nature of the determination of the training parameters, improving the training process, and, therefore, the predicting performance of the network. Using the above-mentioned neural network design and software setting, training of the models was performed. During training, the weights of the neural network were adjusted in order to minimize the error between the network output and the target value for all of the readings in the training set. To ensure that the network does not over-fit the training data (by learning patterns specific only to the training set), the performance of the network on the validation set was periodically evaluated. When performance on the validation set begins to degrade, training was stopped. For the nitrate ANN model training and testing process, 69 readings (76% of the data set) were used for training and 21 readings (24% of the data set) were used to test the model performance. Seven scenarios are used to train MLP and RBF networks to choose the best model for predicting nitrate concentrations. The used input parameters for the trained seven scenarios are shown in .
Table 2. Different combination of input parameters in MLP and RBF neural networks.
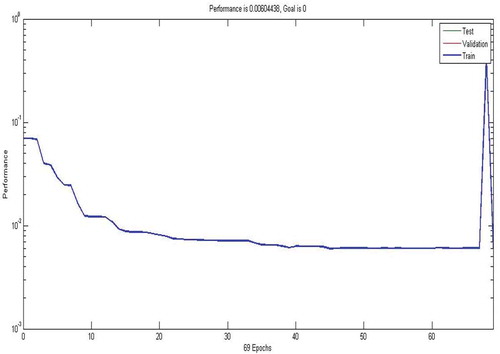
The MLP network training process started with using four neurons in the hidden layer, then the numbers of neurons were increased, and at nine neurons the performance of the developed network was good. The RBF network training was satisfactory at 69 neurons in the hidden layer. The best trained MLP and RBF networks performance is shown in and , respectively.
Figure 3. Nitrates MLP training model performance.
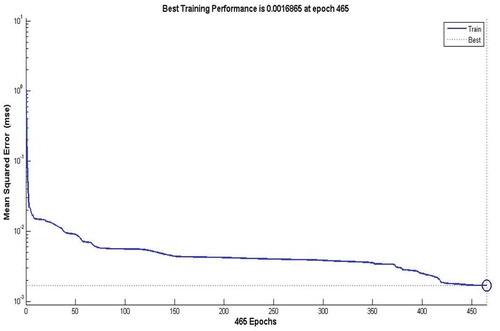
Figure 4. Nitrates RBF model training performance.
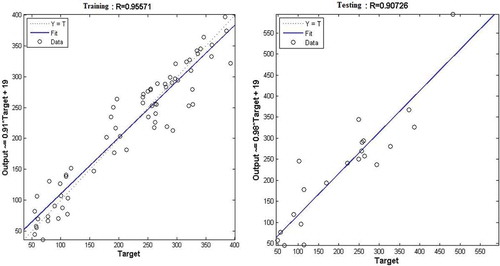
There are many statistical tools for model validation, but the principal tools for most procedure modeling presentations include root mean square error, correlation coefficient (r) and mean absolute error. Summary of these statistical tools used in the developed models result for training and testing data sets are given in . The results obtained from MLP used several different algorithms revealed that the created MLP network which trained with backpropagation incorporated with LM algorithm is the most fitting model for predicting nitrate concentration in the groundwater wells used in the desalination plants of Khan Younis and Rafah governorates in Gaza Strip. It can be seen from figures that the created MLP network performance is better than the RBF network. It is also understood from the results presented in , which shows the coefficient correlations between the observed and predicted values of nitrate using MLP and RBF for training and testing the developed models. It also can be seen from the table that the best performance for validating models for testing data sets was achieved at model-3. The correlations between the predicted nitrate and actual values for MLP model training and testing are found to be strong and slightly better than RBF model, whereas coefficient correlation values are [0.98–0.91] and [0.95–0.90], respectively, as shown in and . The MLP and RBF networks performances have been tested with different data sets and the obtained results show good performance. The results obtained prove that the developed MLP and RBF neural network models have high capability and accuracy in predicting nitrate concentrations in the groundwater wells used for desalination purpose in Khan Younis and Rafah of Gaza Strip as shown in .
Table 3. Evaluation of nitrate ANN developed models for testing data set.
Table 4. Summary of best developed ANN models results for predicting nitrate.
Figure 5. Nitrate MLP model regression for training and testing data.
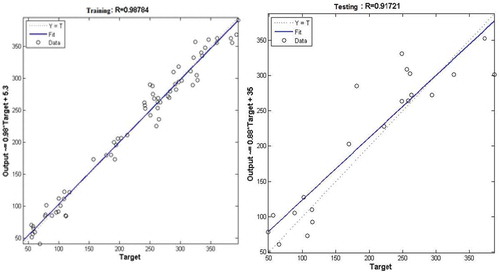
Figure 6. Nitrate RBF model regression for training and testing data.
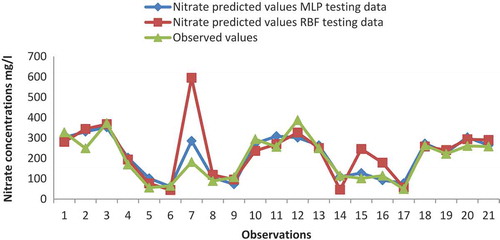
and illustrate the comparison of training and testing MLP model prediction results and RBF network with the real data. As can be seen from both figures, the MLP network performance is better than RBF network. Also we can see this result in , which shows the root mean square error between the predicted values of nitrate using both MLP (16.21–42.53 mg/l) and RBF (30.69–70.81 mg/l) for training and testing the developed models. The satisfactory prediction results verify that the investigated approach is acceptable for predicting nitrate contamination in the groundwater wells. As a first case study for predicting nitrate concentration in groundwater wells used for desalination purpose in Khan Younis and Rafah governorates of Gaza Strip, the simulation results prove that the ANNs are suitable and good for modeling the nitrate contamination in the groundwater wells of Gaza Strip.
Figure 7. Comparison between MLP and RBF prediction results (training data set).
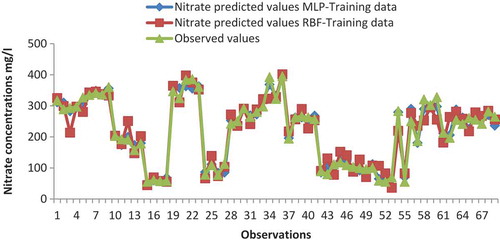
Figure 8. Comparison between MLP and RBF prediction results (testing data set).
Further analysis about the sensitivity of the results against the input factors are done on the results of ANN estimation for the best network. Therefore, to determine the sensitivity and impact of different input factors, MLP network with 1 hidden layer trained with backpropagation incorporated with LM algorithm. First, 7 parameters of water quality were used as a primary input of ANN. For the selection of the most important ANN input parameters the periodic remove method was used. Therefore, by eliminating any input parameter, the structure of optimized ANN was run. With comparing neural network output by eliminating any input parameter, the network sensitivity to any input parameter was calculated. Percentage of variation of estimated nitrate concentration was determined for each index. The importance of each input parameter is shown in . Abstraction rate has the highest influence on nitrate prediction. In contrast, TDS, TH, EC, pH, Mg2+, and Ca+2 have the least effects.
Figure 9. Sensitivity of each input index for prediction of nitrate concentration.
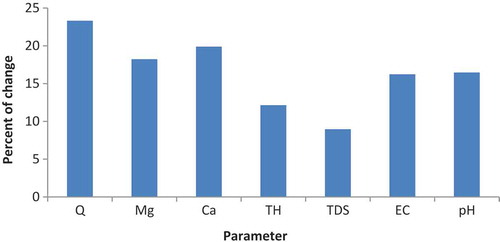
It can be concluded that ANN structure with 7 parameters in some places had a greater error than those of other structures, which means that increasing the number of input parameters is not always effective (Zare Abyaneh, Bayat Varkeshi, and Daneshkare Arasteh Citation2011).
Conclusion
Two types of neural networks; MLP neural network, and RBF were tested for prediction of nitrate in groundwater wells from analyzed groundwater nitrate concentration, pH, EC, TH, TDS, Ca, Mg, and abstraction rate as input data. Since sample collection, analysis, and re-sampling are expensive, only 90 samples from 15 wells were used for analyses in this study. Among the various structures of MLP and RBF networks employed for this study, MLP with five neurons in input layer and nine neurons in hidden layer was found to be superior to other structures. The prediction ability of the MLP neural network was found to be marginally better than RBF. and show the comparison between MLP and RBF in process of validation step. It shows MLP could differentiate the trend slightly more accurate than RBF. ANN models can predict nitrate contamination in groundwater with acceptable accuracy. However, the MLP model had a marginally better performance compared to the RBF by 36%. The achieved result suggests that the use of more input parameters will not necessarily lead to improvements of predicted results, but type of input parameters is more important than its number. The developed ANN model in this study may be used as a new predictive tool for assessing the significances of a number of water resources management scenarios. Utilizing the developed ANN model as a decision support tool could be very useful for preparing water management policies and setting up a suitable management scenario in the Gaza Strip.
Acknowledgments
The Authors would like to thank the higher authorities of Al-Azhar University of Gaza, Institute of Water and Environment and Ministry of Health (Public Health Laboratory) for making it convenient in various aspects to carry out this research.
References
- Aish, A. M., H. A. Zaqoot, and S. M. Abdeljawad. 2015. Artificial neural network approach for predicting reverse osmosis desalination plants performance in the Gaza Strip. Desalination 367 (2015):240–47. doi:10.1016/j.desal.2015.04.008.
- Alagha, J. S., M. A. Said, and M. Younis. 2013. Modelling of nitrate concentration in groundwater using artificial intelligence approach – a case study Gaza coastal aquifer. Environmental Monitoring and Assessment 186:35–45.
- Al-Mahallawi, K., J. Mania, A. Hani, and I. Shahrour. 2012. Using of neural networks for the prediction of nitrate groundwater contamination in rural and agricultural areas. Environment Earth Sciences 65:917–28.
- Almasri, M. N., and J. J. Kaluarchchi. 2005. Multi-criteria decision analysis for the optimal management of nitrate contamination of aquifers. Journal of Environmental Management 74:365–81.
- Al-Najar, H., and A. J. Adeloyde. 2005. The effect of urban expansion on groundwater redoge as renewable resource in Gaza Strip. RICS 5:7–21.
- Amade, L. J. 1999. Seasonal correlation of well contamination and septic tank distance. Ground Water 37 (6):920–23.
- American Public Health Association (APHA). 2005. Standard methods for the examination of water and wastewater. 21th ed. Washington, DC: American public health association.
- Broomhead, D. S., and D. C. Lowe. 1988. Multivariable functional interpolation and adaptive networks. Complex Syst 2:321–55.
- Cantor, L., and R. C. Knox. 1984. Evaluation of septic tank effects on groundwater quality. Washington: DC. U.S. Environmental Protection Agency. EPA-600/2-284-107.
- Chen, S., C. F. N. Cowan, and P. M. Grant. 1991. Orthogonal least squares learning algorithm for radial basis function networks. IEEE Transactions on Neural Networks 2 (2):302–09.
- Chowdary, V. M., N. H. Rao, and P. B. S. Sarma. 2005. Decision support framework for assessment of non-point-source pollution of groundwater in large irrigation projects. Agricultural Water Management 75:194–225.
- Cordoba, G. A. C. 2011. Using of artificial neural network for evaluation and prediction of some drinking water quality parameters within a water distribution system. JUNIORSTAV, 3. Water Management and Water Structures.
- Dawson, C. W., R. J. Abrahart, A. Y. Shamseldin, and R. L. Wilby. 2006. Flood estimation at ungauged sites using artificial neural networks. Journal Hydrol 319:391–409.
- Diamantopoulou, M. J., V. Z. Antonopoulos, and D. M. Papamichail. 2005. The use of a neural network technique for the prediction of water quality parameters. Operational Research an International Journal 5 (1):115–25.
- Ehteshami, M., and N. Biglarijoo. 2014. Determination of nitrate concentration in groundwater in agricultural area in Babol County. Iran Journal Health Sciences 2 (4):1–9.
- Ehteshami, M., N. F. Dolatabadi, and S. Tavassoli. 2016. Simulation of nitrate contamination in groundwater using artificial neural networks. Model Earth Systems Environment 2:28.
- Ehteshami, M., A. Sefidkar Langeroudi, and S. Tavassoli. 2013. Simulation of nitrate contamination in groundwater caused by livestock industry (case study: Rey). Journal Environment Protection 4 (7A):91–97.
- Erenturk, S., and K. Erenturk. 2007. Comparison of genetic algorithm and neural network approaches for the drying process of carrot. Journal Food Engineering 78:905–12.
- Fogelman, S., H. Zhao, M. Blumenstein, and S. Zhang. 2006. Estimation of oxygen demand levels using UV–Vis spectroscopy and artificial neural networks as an effective tool for real-time, wastewater treatment control. Sydney, Australia: 1st Australian Young Water Professionals Conference, Proceedings of the 1st Australian Young Water Professionals Conference; 2006:15–17.
- Hall, M. D., M. J. Shaffer, R. M. Waskom, and J. A. Delgado. 2001. Regional nitrate leaching variability: What makes a difference in northeastern Colorado. Journal of the American Water Resources Association 37 (1):139–408.
- Hassoun, M. H. 1995. Fundamentals of artificial neural networks. Cambridge: MIT Press.
- Haykin, S. 2007. Neural networks- A comprehensive foundation, 78. 3rd ed. upper Saddle River, NJ: prentice hall.
- Keeney, D. R. 1986. Sources of nitrate to ground water. CRC Critical Reviews in Environmental Control 16 (3):257–304.
- Khuan, L. Y., N. Hamzh, and R. Jailani. 2002. Prediction of water quality index (WQI) based on artificial neural network (ANN). 2002 Student conference on research and development proceedings, Shah Alam, Malaysia
- Kuo, J. T., M. H. Hsieh, W. S. Lung, and N. She. 2006. Using artificial neural network for reservoir eutrophication prediction. Ecology Modell 200 (1–2):171–77.
- Leahy, P., G. Kiely, and G. Corcoran. 2008. Structural optimisation and input selection of an artificial neural network for river level prediction. Journal Hydrol 355:192–201.
- Lee, J. H., Y. Huang, M. Dickman, and A. W. Jayavardena. 2003. Neural network modeling of coastal algal blooms. Ecology Model 159:179–201.
- Lek, S., G. Maritxu, and J. Giraudel. 1999. Prediction of stream nitrogen concentration from watershed features using neural networks. Wat Researcher 33 (16):3469–78.
- MacQuarrie, K. T., E. A. Sudicky, and W. D. Robertson. 2001. Multicomponent simulation of wastewater-derived nitrogen and carbon in shallow unconfined aquifers: II. Model application to a field site. Journal of Contaminant Hydrology 47 (1):85–104.
- Maedeh, P. A., N. Mehrdadi, G. R. Nabi Bidhendi, and H. Zare Abyaneh. 2013. Application of artificial neural network to predict total dissolved solids variations in groundwater of Tehran plain, Iran. International Journal of Environment and Sustainability 2 (1):10–20.
- Maier, H. R., N. Morgan, and C. W. K. Chow. 2004. Use of artificial neural networks for predicting optimal alum doses and treated water quality parameters. Environmental Modelling & Software 19:485–94.
- Najah, A., A. Elshafie, O. A. Karim, and O. Jaffar. 2009. Prediction of Johor River water quality parameters using artificial neural networks. European Journal of Scientific Research 28 (3):422–35.
- Parisi, G., F. Ricci-Tersenghi, and J. J. Ruiz-Lorenzo. 1996. Equilibrium and off equilibrium simulations of the Gaussian spin glass. Journal of Physics A-Mathematical and General 29 (24):7943–57.
- Postma, D., C. Boesen, H. Kristiansen, and F. Larsen. 1991. Nitrate reduction in an unconfined sandy aquifer; water chemistry, reduction processes, and geochemical modeling. Water Resources Research 27 (8):2027–45.
- Prakasa Rao, E. V. S., and K. Puttanna. 2000. Nitrates, agriculture and environment. Current Science 79 (9):1163–68.
- Ramasamy, N., P. Krishnan, J. B. Bernard, and W. F. Ritter. 2003. Modeling nitrate concentration in ground water using regression and neural networks. ORES SP03-01, Food and Resource Economics, Delaware Univ. Papers, Newark, DE, USA.
- Ray, C., and K. K. Klindworth. 2000. Neural networks for agrichemical vulnerability assessment of rural private wells. Journal Hydrol Engineering 5 (2):162–71.
- Saen, F. R. 2009. The use of artificial neural networks for technology selection in the presence of both continuous and categorical data. World Applied Sciences Journal 6:1177–89.
- Salami, E. S., and M. Ehteshami. 2015. Simulation, evaluation and prediction modeling of river water quality properties (case study: Ireland Rivers). International Journal Engineering Sciences Technological 12 (10):3235–42.
- Salami, E. S., and M. Ehteshami. 2016. Application of artificial neural networks to estimating DO and salinity in San Joaquin River basin. Desalin Water Treat 57 (11):4888–97.
- Sarkar, A., and P. Pandey. 2015. River water quality modelling using artificial neural network technique. International conference on water resources, coastal and ocean engineering (icwrcoe 2015). Aquatic Procedia 4 (2015):1070–77.
- Shomar, B., S. Fkher, and A. Yahya. 2010. Assessment of groundwater quality in the Gaza Strip, Palestine using GIS Mapping. Journal of Water Resource and Protection 2:93–104.
- Wen, C. G., and C. S. Lee. 1998. A neural network approach to multi-objective optimization for water quality management in a river basin. Water Resources Researcher 34 (3):427–36.
- Yesilnacar, M. I., E. Sahinkaya, M. Naz, and B. Ozkaya. 2008. Neural network prediction of nitrate in groundwater of Harran Plain, Turkey. Environment Geological 56:19–25.
- Zaheer, I., and G. Cui. 2003. Inverse modeling to identify nonpoint source pollution using a neural network, Taihu lake watershed, China. Journal Environment Hydrol 11:1–8.
- Zare Abyaneh, H., M. Bayat Varkeshi, and P. Daneshkare Arasteh. 2011. Forecasting nitrate concentration in groundwater using artificial neural network and linear regression models. International Agrophysics 25 (2):187–92.
- Zare Abyaneh, H., M. Bayat Varkeshi, S. Marofi, and R. Amiri Chayjan. 2010. Evaluation of artificial neural network and adaptive neuro fuzzy inference system in decreasing of reference evaporate transpiration Parameters. Journal of Water and Soil 24 (2):297–305.