
ABSTRACT
The portfolio optimization is a well-known problem in the areas of economy and finance. This problem has also become increasingly important in electrical power systems, particularly in the area of electricity markets, mostly due to the growing number of alternative/complementary market types that are being introduced to deal with important issues, such as the massive integration of renewable energy sources in power systems. The optimization of electricity market players’ participation portfolio comprises significant time constraints, which cannot be satisfied by the use of deterministic techniques. For this reason, meta-heuristic solutions are used, such as particle swarm optimization. The inertia is one of the most important parameter in this method, and it is the main focus of this paper. This paper studies 18 popular inertia calculation strategies, by comparing their performance in the portfolio optimization problem. A strategic methodology for the automatic selection of the best inertia calculation method for the needs of each optimization is also proposed. Results show that the proposed approach is able to automatically adapt the inertia parameter according to the needs in each execution.
Introduction
Worldwide electricity markets have experienced major changes with the restructuring of the power system, which has been largely potentiated by environmental and economic policies (Sioshansi Citation2013). At the same time, with the massive integration of renewable energy sources, characterized by a high associated variability, the uncertainty of electricity prices has also increased (Sharma, Bhakar, and Tiwari Citation2014). The need for the involved entities to understand and deal with this constantly changing environment has led to development of several simulation tools. The use of Artificial Intelligence (AI) methods, particularly multi-agent technology, has proven to be of crucial importance in this domain, by allowing the distributed modeling of complex and dynamic systems with a high level of interactions between the involved players (Velik and Nicolay Citation2014). Some of the most relevant electricity market simulators are the Electricity Market Complex Adaptive System (EMCAS) (Koritarov Citation2004), the Agent-based Modeling of Electricity Systems (AMES) (Li, Sun, and Tesfatsion Citation2011), and the Multi-Agent Simulator for Competitive Electricity Markets (MASCEM) (Santos et al. Citation2015).
MASCEM has been developed by the authors’ research team, and it facilitates the study of electricity markets by representing the entities that typically participate in electricity markets through software agents. Moreover, MASCEM is integrated with another multi-agent system, which detains the sole purpose of providing decision support to players’ actions in electricity market negotiations. The Adaptive Decision Support for Electricity Markets Negotiations (AiD-EM) system provides decision support to negotiations in auction-based markets (Pinto et al. Citation2014) and also for bilateral contract negotiations (Pinto et al. Citation2015b). Moreover, AiD-EM is equipped with a portfolio optimization methodology, which identifies the market opportunities in which market players should negotiate at each moment to maximize their outcomes from market participation (Pinto et al. Citation2015a).
The typical portfolio optimization problem consists in finding the optimum way of investing a particular amount of money in a given set of securities or assets (Fernández and Gómez Citation2007). Traditionally, the optimal management of a portfolio of assets is solved by minimizing the investment risk while guaranteeing a given level of returns. Markowitz (Citation1952) introduced this concept and formulated the fundamental theorem of a mean–variance portfolio framework, which explains the trade-off between mean and variance, representing the expected returns and risk of a portfolio, respectively. Risk refers to the possibility of suffering harm or loss, as result from uncertainty. However, there is a difference between risk and uncertainty: risk is something that usually can be controlled while uncertainty is beyond players’ control (Conejo, Carrión, and Morales Citation2010). The results of players in electricity markets are influenced by many uncertain factors, for example, other players’ bidding strategy, penetration of renewable energy sources, and change of demand. These uncertainties bring along risks in electricity pricing. The main reason for this may be attributed to the particular characteristic of non-mass storage of electricity (M. Liu and Wu Citation2007). Four different risk measures for the portfolio optimization problem in electricity markets are presented by Chang (Chang, Yang, and Chang Citation2009). This author considers the mean–variance model, semi-variance model, mean absolute deviation model, and variance with skewness. All these models are derived from the initial risk measure that was proposed by Markowitz for application in the financial markets. These models for risk minimization consider the history of the markets. The author used Genetic Algorithm (GA) to solve the portfolio optimization problem; Chang’s project concludes that GA is an effective method, for solving the portfolio optimization problem with different risk measures. Particle Swarm Optimization (PSO) is used in Cura (Citation2009) and Zhu et al. (Citation2011) as an alternative method to solve the portfolio optimization problem; the used risk measures are also derived from the Markowitz mean–variance model. Meta-heuristic techniques are, in fact, a common choice for the resolution of this optimization problem, as detailed in Ponsich, Jaimes, and Coello (Citation2013) where a rather complete survey on the use of evolutionary algorithms to handle with the portfolio optimization problem is presented. Additionally, variations using methods such as fuzzy logic also present promising solutions, for example, Liu and Zhang (Citation2015).
Different meta-heuristic algorithms have been applied to this problem by the authors, namely the PSO (Faia et al. Citation2015), GA (Faia, Pinto, and Vale Citation2017), and Simulated Annealing (SA) (Faia, Pinto, and Vale Citation2016a). Due to the results obtained in the aforementioned publications and to obtain better results in the problem of portfolio optimization in the electricity markets, the PSO is the one that presents the most promising results. Thus, it is the approach that is being optimized by this work, by exploring the PSO search parameters, namely the inertia calculation strategy. Thus, in this work, PSO is used, as it proves its advantage in solving the envisaged problem. As it is demonstrated in the experimental findings section, the deterministic methods have a very long execution time, which compromises the negotiation process. Thus, the use of the PSO is essential for the application in a real context.
PSO is a stochastic population-based algorithm that was originally introduced by Eberhart and Kennedy (Citation1995). This algorithm is motived by the intelligent behavior of some animals, for example, bird flocking and fish schooling in search of food. The PSO algorithm has been widely used, because of its easy implementation, high degree of flexibility in the used parameters, and computation efficiency compared to other heuristic algorithms. In PSO, the swarm consists of individuals, called particles, which change their position over time. Each particle represents a potential solution to the problem. During the optimization process, the particles fly around in a multi-dimensional search space. In the search process, each particle adjusts its position according to its own experience and the experience of its neighboring particles, making use of the best position encountered by itself and its neighbors.
When applying meta-heuristic optimization methods, however, equally importantly to the choice of the most appropriate method, is the selection of the parameters that provide the best chances for the success of the optimization problem in each different application context. This is essential to take advantage on the stochastic nature of meta-heuristic methods to reach an adequate balance between exploration (of the complete search space) and exploitation (of the most promising regions of the search space).
In the PSO algorithm, there are many parameters that can be modeled to obtain better results in the end. The term of inertia is one of them and will be explored throughout this work. Inertia in the PSO research is a mechanism that controls an exploration and exploitation of the swarm, working as a mechanism that does not allow the particle to settle in a position. The inertia defines a weight that controls the movement of the particle in the next iteration by the contribution of the previous solution. Large values of inertia will facilitate exploration; on the contrary, the smaller values will promote the exploitation (Rini, Shamsuddin, and Yuhaniz Citation2011).
This paper studies the influence of different inertia calculation strategies in the outcomes of the PSO process applied to the resolution of the market participation portfolio optimization problem. For this, 18 alternative inertia calculation methods are compared, and their advantages are evaluated. Additionally, a strategic methodology for the automatic selection of the best inertia calculation method for the needs of each optimization is also proposed. The proposed method uses a utility function that considers the influence of several factors in the decision process, namely: (i) the objective function results achieved by using each inertia calculation strategy, (ii) the number of iterations required to reach the final solution, and (iii) the execution time associated to the PSO approach when using each inertia calculation. By using the proposed methodology, it is possible to select the most appropriate inertia calculation strategy for each distinct optimization, considering the requirements in terms of execution time and quality of the final result. In addition, the proposed method presents an important contribution, as it will provide a greater variety of results, which may surpass those obtained in the previous works (Faia, Pinto, and Vale Citation2016a, Citation2016b; Faia et al. Citation2015). Thus, it is a benchmark in solving the problem of optimization of portfolios in the electric energy market.
After this introductory section, Section 2 presents the formulation of the considered portfolio optimization problem. Section 3 presents the proposed methodology, including the application of the PSO meta-heuristic, the different inertia calculation strategies, and the proposed adaptive inertia selection method. Section 4 presents the experimental findings achieved when using the proposed PSO approach with the different inertia calculation methods to solve the portfolio optimization problem, and a demonstration of the results achieved when using the proposed method for automatic selection of the inertia calculation strategy. Finally, Section 5 presents a discussion on the most relevant conclusions of this work.
Problem Formulation
This present section will be used to present the objective function of the problem as well as the restrictions applied to it.
Objective Function
Considering the expected production of a market player for each period of each day, the amount of power to be negotiated in each market is optimized to get the maximum income that can be achieved. Equation (1) is used to optimize players’ market participation portfolio, as proposed in Pinto et al. (Citation2015a).
In Equation (1), represents the weekday,
represents the number of days,
represents the negotiation period,
represents the number of negotiation periods,
and
are Boolean variables, indicating if this player can enter negotiations in each market type,
represents the referred market,
represents the number of markets,
represents a session of the balancing market, and
represents the number of sessions. Variables
and
represent the expected (forecasted) prices of selling and buying electricity in each session of each market type, in each period of each day. The outputs are
representing the amount of power to sell in market
, and
representing the amount of power to buy in session
.
This formulation considers the expected production of a market player for each period of each day. As explained before, the price of electricity in some market types depends on the power amount to trade. With the application of a clustering mechanism (Value function in Equation (1)), it is possible to apply a fuzzy approach to estimate the expected prices depending on the negotiated amount. Equation (2) defines this condition, where Data refers to the historical data that correlate the amount of transacted power, the day, period of the day, and the particular market session.
Constraints
Equation (3) represents the main constraint to be applied in this type of problems, and imposes that the total power that can be sold in the set of all markets is never higher than the total expect production (TEP) of the player, plus the total of purchased power (Pinto et al. Citation2015a). Further constrains depend on the nature of the problem itself, for example, type of each market, negotiation amount, type of supported player (renewable-based generation, cogeneration, etc.).
From the restrictions and considerations presented, we can see that the energy produced comes from renewable sources and non-renewable sources (thermoelectric) by Equation (4). If the player is a producer of thermoelectric power, you have to set your production at a minimum because it is not feasible to completely turn off the production plant, Equation (6). According to (5), the producer has to complywith a single constraint, which is the maximum generation capacity.
Proposed Methodology
This paper studies and compares different formulas for the calculation of PSO’s inertia parameter. The inertia weight is the PSO parameter that allows balancing the exploration and exploitation characteristics of PSO. Inertia is, thereby, one of the main characteristics that allow the algorithm to achieve good performances. The characteristics and particularities of each inertia calculation method lead to the need of developing an automatic methodology that is able to select the most appropriate calculation method given the needs of each optimization process (balance between the expected quality of results and the required execution time). Usually, in works done where the authors try to compare different methods in solving the same problem, they aim to analyze the value of the objective function and the value of number of iterations, as the number of iterations is proportional to the execution time and this can depend on the machine in question (Bansal et al. Citation2011). What is evaluated is the objective function value that can be obtained in a given number of iterations, because having a small number of measurements means that the method converges efficiently, that is, that it is really directing demand in the right direction. It can be said that the number of iterations is directly connected with the quality of the method in solving the problem.
Therefore, this paper also proposes a methodology that selects the best inertia weight calculation depending on the objective function value, convergence time, and number of iterations. The proposed methodology allows the user to choose the importance (weight) to give to each of the variables to achieve the solution that most fits the needs of each simulation.
PSO Approach
The two main equations that are used in PSO are the velocity update Equation (7) and position update Equation (8).
In PSO’s equation, the term represents the velocity of particle i, for variable d and iteration k,
is the position of particle i, for variable d and iteration k,
is the current iteration,
is the personal best,
is the global best,
is the inertia term,
is the local attraction term,
is the global attraction term, and
are random numbers between [0,1].
Parameters ,
, and
provide the flexibility to the algorithm toward a better performance in the search process. Section 3.2 presents an overview of several strategies that are found in the literature for the inertia parameter calculation.
Inertia Calculation Methods
The inertia parameter determines the contribution rate of a particle’s previous velocity to its velocity at the current time step. This parameter has been proposed in Shi and Eberhart (Citation1998) as an improvement of the standard PSO, presented by Eberhart and Kennedy in 1995 (Kennedy and Eberhart Citation1995). summarizes a total of 18 equations that allow calculating the inertia weight to be applied in PSO.
Table 1. Inertia calculation methods.
The several inertia calculation strategies presented in can be categorized into three classes, depending on the calculation nature. A brief discussion on the characteristics of each type of calculation is provided as follows.
Constant and random inertia weights
The first introduction of the inertia parameter in the PSO algorithm was in 1998 by Shi and Eberhart (Citation1998). The concept of Inertia is proposed by introducing a constant Inertia Weight (w1). In this first approach, the inertia value is constant throughout all iterations. The same characteristic is also verified in Equation (w2). In this Equation, the value of the inertia weight is a uniform random variable in the range [0.5 1], because variable rand() is a random number between [0 1] with uniform distribution.
Time varying inertia weights
Most of the PSO variants use time-varying inertia weight strategies, in which the value of the inertia weight is determined based on the iteration number. These methods can be either linear or non-linear and increasing or decreasing. Equations (w3) to (w14) are of this type. Equations (w3) to (w12) require the definition of the range in which the inertia weight will vary. This means that the inertia value is
at the beginning, and
Adaptive inertia weights
The adaptive inertia weight category tries to adapt the value of inertia based on parameters that provide status information of where the particles are in the search space at each time. Equations (w15) to (w18) are examples of adaptive inertia weight. In (w15), (w16), and (w17), the inertia weight is adapted to each particle; therefore, in each iteration, there are as many inertia values as particles in the swarm. This adaptation depends on the difference between particles’ current position, in each iteration, and the personal and global best positions. The inertia weight value in Equation (w18) is different for each variable, taking into account the global best position and the value of each specific variable in the personal best position of each particle.
Strategic Selection of the Inertia Calculation Method
Given the diversity of inertia calculation methods that are available in the literature, and the importance of the appropriate definition of this parameter to ensure the proper balance between exploration and exploitation of the search space, it becomes essential to develop a suitable methodology that allows the automatic definition of the best inertia calculation method to apply, given the needs of each optimization process.
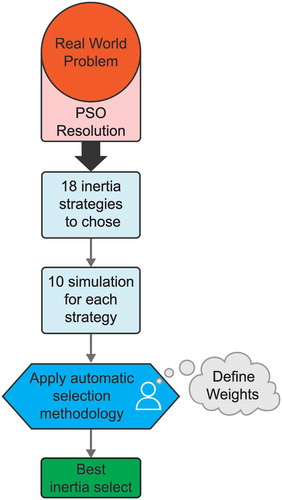
As mentioned before, the use of heuristics to solve optimization problems is crucial when a fast response is required and deterministic methods are not able to provide the optimal solution in an acceptable time frame. For this reason, the selection of the inertia calculation parameter must take into account the user’s needs in terms of required execution time of the optimization process, and also in what concerns the associated expected quality of results (objective function value). shows the flow chart of the proposed methodology. The methodology can be applied to problems of different natures, as it is not specific to the optimization of portfolio of electricity market participation. As already mentioned, the PSO is used as a resolution method. Following the flowchart, the methodology performs 10 simulations for each inertial strategy applied. As the methodology created is intended to be versatile, it can be applied to different types of inertia not being stuck to them. Another fact that can show a greater confidence in the choice is the times that each inertia is executed, and this step is at the discretion of the user. After completing the simulations of each inertia strategy, the values for the parameters are obtained.
Figure 1. Flowchart methodology.
With the results of the different strategies of inertia, it is possible to calculate the utility function U, as in (12), which maximizes the expected added value of each inertia calculation method, taking into account three parameters: the objective function value O (9), the execution time T (10), and the number of iterations I (11). This utility function enables the user to define the desired balance between the three parameters, by including weights that give more or less influence to each parameter in the definition of the best solution (inertia calculation method to be applied), namely the weight for the objective function wo, for the execution time wt, and for the number of iterations wi.
All the values in Equations (9–12) should be normalized in a scale between [0,1]. As the target problem (optimization of electricity market players’ participation portfolio) is a (profits) maximization problem, as presented in Equation (1), the goal of the proposed utility function is to achieve the maximum objective function value in the minimum amount of execution time and in as less iterations as possible. These three parameters are calculated taking into account historical values from previous executions of the PSO approach using each inertia calculation method. The variables that are taken into account for the definition of each of the three parameters, for each inertia calculation method, are as follows: the maximum achieved value (objective function, execution time, and number of iterations, respectively), the minimum value, the mean value, and the standard deviation. Although the maximum, minimum, and mean achieved values assume a positive contribution towards the definition of each parameter, the standard deviation assumes a negative value (a smaller variability represents a positive evidence). The weight values that are attributed to each parameter should be in the range between [0,1] and are subject to (13).
The definition of the weight values allows the user to give equal weight to the three variables, meaning that they all have the same importance in the choice of the best inertia calculation method. If a higher weight is given to one of the parameters, it means that this parameter is more important for the requirements of the current optimization, thereby, the corresponding inertia weight will be more suitable for results with that feature.
Experimental Findings
This section presents a case study with the goal of demonstrating the performance of the proposed methodology for the automatic selection of the best inertia calculation method. This is achieved through the application of the presented PSO approach to solve the portfolio optimization problem, as presented in Section 2. For the portfolio optimization problem, five different types of markets are considered: day-ahead spot market, balancing market, bilateral contracts, forwards market, and a smart grid market (Morais et al. Citation2012). The historic of real electricity market prices and amounts of transacted power from the Iberian Market—MIBEL (MIBEL Citation2007) is used, concerning the time range from January 2002 to October 2012. The used data are extracted from the MIBEL website (MIBEL Citation2007). The data used to model the smart grid market, including the historic log of negotiations, are based on previous works from the authors (Morais et al. Citation2012). Using this data, the PSO approach is executed considering the following parameterization: number of particles = 10; maximum number of iterations = 10,000; stopping criterion: Sum(var(Pbest)) = 1 x 10⁻⁸; c1 = c2 = 1.
Statistical Analysis
Sampling values are almost always somewhat different, and the problem is whether the different observed samples actually suggest differences between populations or whether they are just random variations that can be expected between random samples from the same population. When the assumptions of normality and homoscedasticity are violated, the result of a traditional analysis of variance cannot be relied upon. The nonparametric alternative for ANOVA at one criterion is the Kruscal–Wallis test.
The Kruscal–Wallis test is the nonparametric test used to compare three or more independent samples. It indicates if there is a difference between at least two of them. This is used to test the null hypothesis that all populations have equal distribution functions against the alternative hypothesis that at least two of the populations have different distribution functions. In this way, the equality of averages is assumed when there exists an equality of distributions (Theodorsson-Norheim Citation1986).
According to the Kruscal–Wallis test, it is possible to obtain the value of p = 0, which confirms the rejection of the null hypothesis that all 18 data samples have the same distribution, at a 1% significance level. Given the result of the test that gives the indication of the null hypothesis, the comparison between the pairs of groups is made to verify which of the samples differ from each other.
The Bonferroni procedure is performed to make the comparison in pairs. Through execution in Matlab, is obtained. In the graph, we have represented the 95% confidence interval for all sample groups (18 inertia calculation methods). By selecting each group, it is possible to see the groups that differ in the value of the average, using the Bonferroni procedure.
Figure 2. Bonferroni confidence interval by 95%.
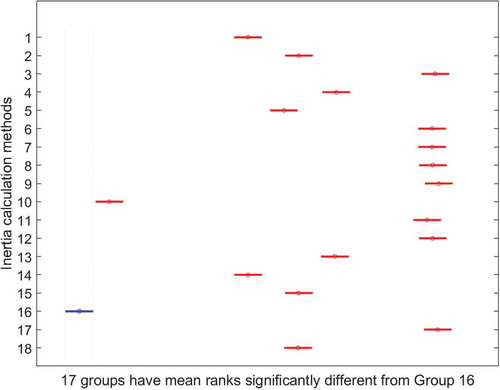
As we can see in this case, group 16 does not have any groups in which it can be said that the mean is equal, but we can say that there are 17 groups in which the mean differs significantly.
The analysis for group 3 results in .
Figure 3. Bonferroni procedure for group 3.
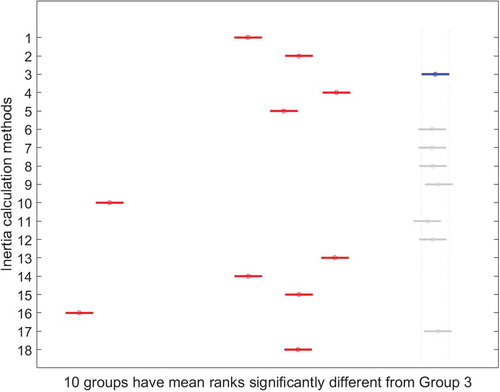
By analyzing the graph of , it is possible to observe that there are 10 groups with significantly different mean values. is constructed so as to uncover the results of this analysis.
Table 2. Bonferroni procedure.
As the p-value is equal to 1 in all these group tests, the null hypothesis where the groups are considered to have similar means with an error of 5% is accepted. Taking into account this analysis, it is concluded that the applied inertia strategies obtain different results of objective function value. We can conclude that there are similarity strategies when comparing the value of their objective function as in the case of the group (inertia strategies) 3, 6, 7, 8, 9, 11, 12, and 17, by the Bonferroni procedure.
PSO Results
In the first case, the initial methodology is used where the user has the possibility of defining a larger number of parameters. The case study presented is the results of the optimization for the first period of the day. Some total of 1000 simulations has been executed using each of the inertia calculation methods presented in Section 3.2.
presents the results of PSO for the different inertia calculation methods. The results are divided by three parameters: objective function value O, execution time T, and number of iterations I. For each of the parameters, the minimum, maximum, and mean values are presented, as well as the standard deviation (STD).
Table 3. Summary of PSO results with the alternative inertia calculation methods for the first period.
As can be observed by the analysis of , regarding O, inertia calculation method w17 presents the best solution for maximum, mean, and STD measures. However, this does not mean that, when applied, this methodology will reach the best solution, because the maximum value of min measure is achieved by w17. Analyzing T, it is not possible to identify the best solution; however, there are two methods that detach from the rest: w16 because it presents the lowest minimum average values, and w10 because it presents the lowest maximum and STD. As expected, the T and I are closely linked. By analyzing I, values indicate the same best solutions: w16 and w10.
presents a visual comparison of the results achieved by the different inertia calculation methods regarding the objective function results, including the mean, maximum, and STD values.
Figure 4. Objective function results of the alternative inertia calculation methods.
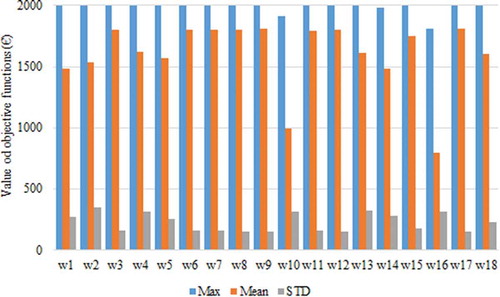
From it is visible that, when considering the objective function results by themselves, it is not easy to directly choose the best inertia calculation method, because the achieved results are similar when using several of the methods. However, some of the alternatives can be easily excluded, such as w2, w10, and w16, as they present high STD values and lower global objective function results.
presents the results of the proposed methodology for the automatic selection of the best inertia calculation method, with the maximum importance for the results of the objective function, by defining, and consequently only considering O, Equation (9). shows the best five solutions.
Table 4. Utility function results considering only the objective function parameter.
From , it is visible that when opting for a solution in which the most important is the value of the objective function, the best inertia calculation method to be used by PSO to solve the portfolio optimization problem is w12 (higher utility function value). However, it is also visible that the results achieved by the five best methods considering this parameter are very close to each other.
shows the results achieved by applying the different inertia calculation methods to the PSO approach, regarding their execution time, including the mean, minimum, and STD values.
Figure 5. Execution time results of the alternative inertia calculation methods.
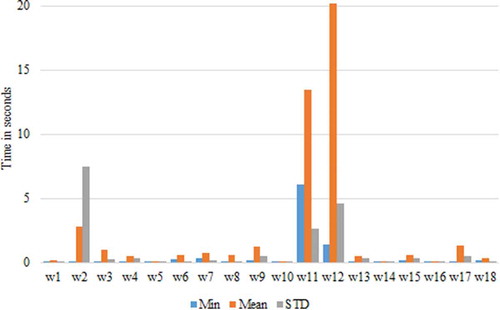
From it is visible that w2, w11, and w12 can be easily excluded, as these are, by far, the ones with the highest mean execution time. To be able to reach a solution for the best inertia calculation method to apply when considering only the execution time, the maximum importance is given to T, , thus applying only Equation (10) to define the results of U. The achieved results of the best five inertia calculation methods are presented in .
Table 5. Utility function results considering only the execution time parameter.
As can be seen by , w10 is the best inertia calculation method (reaches the higher U) when considering only T. The results achieved by applying the different inertia calculation methods to the PSO approach, regarding the number of iterations required to reach the solution, including the mean, minimum, and STD values, can be seen graphically in .
Figure 6. Number of iterations results of the alternative inertia calculation methods.
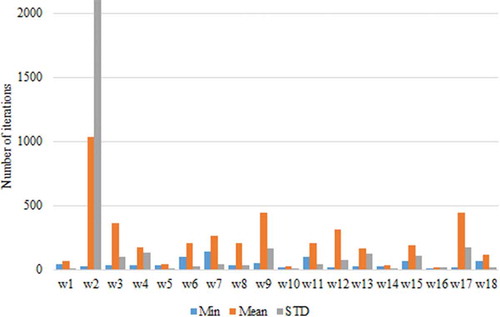
As can be seen by , w2, w3, w9, and w17 can be discarded, because they present quite high mean and STD values when compared to the other inertia calculation methods. presents the results of U of the best five inertia calculation methods regarding the best inertia calculation method to apply when considering only the number of iterations, that is, the maximum importance is given to the I, , thus applying only Equation (11) to define U.
Table 6. Utility function results considering only the number of iterations parameter.
From , it is visible that w14 is the best inertia calculation method to be applied when giving total preference for I. This result reinforces the idea of the relationship between execution time and number of iterations, because the best result from applying Equation (10) and Equation (11) is the same.
The combination of the three parameters is crucial to achieve a solution that most fits the user’s requirements regarding the balance between objective function results, execution time, and number of iterations. presents the U results for different combinations of these parameters.
Table 7. Utility function results for different combinations of weights for the first period.
Scenarios 1, 2, and 3 of are the ones that have been previously discussed, regarding the total preference for each of the parameters separately. In Scenario 4, the weight has been distributed equally by three parameters. In this case, the best inertia calculation method is w6. This inertia calculation has achieved very good results concerning the objective function results (second best, as shown by ), and has also required a relatively low execution time in a small number of iterations (as shown in and in , respectively). Thereby, w6 may be considered the most balanced inertia calculation method. Scenarios 5 and 6 consider a slightly larger weight for the objective function in comparison to the execution time and number of iterations parameters. The best inertia calculation method resulting from these two scenarios is also w6, because, in these cases, the very good results of w6 in terms of objective function results present an even larger influence over the utility function calculation. Finally, as can be seen by the results of Scenario 7, with the further increase of the weight for O, solutions tend to select w12, because this is the best inertia calculation method considering the objective function.
Conclusions
This paper presented a comparative study of the performance of different PSO inertia calculation methods and proposed an adaptive methodology for the selection of the most appropriate inertia calculation method for different optimization requirements. The proposed method uses a utility function, which considers three main parameters: the objective function results achieved by the PSO approach when using each inertia calculation method, the associated execution time, and the number of iterations.
In this sense, this work has considered different algorithms, because each strategy can be considered a different algorithm, and an automatic methodology was created to enable automatically selecting the best strategy for each specific instance of the problem. Results are evaluated concerning the application of the 18 considered alternative inertia calculation methods and of the proposed automatic inertia selection method to the problem of electricity market players’ participation portfolio optimization. The experimental findings, using real data from the Iberian electricity market operator—MIBEL, show that the proposed method is able to accomplish its purpose because it is able to identify the most suitable inertia calculation method depending on the defined preferences. Results show that, when the objective function result is the most important factor, the inertia that is able to achieve the better results is the one selected. On the other hand, when the preference is given to the minimization of the execution time and/or the number of iterations, the inertia calculation methods that allow the PSO approach to achieve the faster results are the chosen ones. For different combinations of parameters, the method has shown its ability to adapt its choice to meet the preference weight on the different parameters (e.g., by choosing inertia calculation methods that present slightly lower objective function results, but in a much faster execution time).
From the achieved results, it is also possible to conclude that the strategies belonging to the time varying group have showed better results. Additionally, it can be concluded that w6 (Oscillating Inertia Weight) is the more balanced inertia to be implemented in the PSO algorithm, because it is the one that is capable of providing PSO with the means of achieving the best objective function results in the least execution time and number of iterations.
By achieving its purpose, the proposed methodology also enables the adaption of the portfolio optimization process to the requirements of AiD-EM’s Efficiency and Effectiveness (2E) balance mechanism (Pinto et al. Citation2015a). This method automatically adapts the execution time of the decision-making process of the AiD-EM decision support system, depending on the user’s requirements in terms of balance between execution time and quality of results.
Conflict of interest
The author(s) declare(s) that there is no conflict of interest regarding the publication of this paper.
Additional information
Funding
Related Research Data
References
- Al-Hassan, W., M. B. Fayek, and S. I. Shaheen. 2006. “PSOSA: An Optimized Particle Swarm Technique for Solving the Urban Planning Problem,” 2006 International Conference on Computer Engineering and Systems. pp. 401–405. doi:10.1109/ICCES.2006.320481
- Arumugam, M. S., and M. V. C. Rao. 2008. “On the improved performances of the particle swarm optimization algorithms with adaptive parameters, cross-over operators and root mean square (RMS) variants for computing optimal control of a class of hybridsystems,” Applied Soft Computing, vol. 8, no. 1, pp. 324–336. doi:10.1016/j.asoc.2007.01.010
- Bansal, J. C., P. K. Singh, M. Saraswat, A. Verma, S. S. Jadon, and A. Abraham. 2011. Inertia weight strategies in particle swarm optimization. 2011 Third World Congress on Nature and Biologically Inspired Computing. doi:10.1109/NaBIC.2011.6089659.
- Chang, T.-J., S.-C. Yang, and K.-J. Chang. 2009. Portfolio optimization problems in different risk measures using genetic algorithm. Expert Systems with Applications 36 (7):10529–37.
- Chen, G., X. Huang, J. Jia, and Z. Min. 2006. “Natural Exponential Inertia Weight Strategy in Particle Swarm Optimization,” 2006 6th World Congress on Intelligent Control and Automation, vol. 1. pp. 3672– 3675.
- Conejo, A. J., M. Carrión, and J. M. Morales. 2010. Decision making under uncertainty in electricity markets. In Conejo, A. J., M. Carrión, and J. M. Morales (eds.), International series in operations research and management science. Vol. 153. International series in operations research & management science, Boston, MA: Springer US. doi:10.1007/978-1-4419-7421-1.
- Cura, T. 2009. Particle swarm optimization approach to portfolio optimization. Nonlinear Analysis: Real World Applications 10 (4):2396–406. doi:10.1016/j.nonrwa.2008.04.023.
- Eberhart, R., and J. Kennedy. 1995. A new optimizer using particle swarm theory. Micro Machine and Human Science, 1995. MHS 95., Proceedings of the Sixth International Symposium on. 10.1109/MHS.1995.494215.
- Eberhart, R., and Y. Shi. 2001. “Tracking and optimizing dynamic systems with particle swarms,” Evolutionary Computation, 2001. Proceedings of the 2001 Congress on, vol. 1. pp. 94–100.
- Faia, R., T. Pinto, and Z. Vale. 2016a. Optimization of electricity markets participation with simulated annealing. In Advances in Intelligent Systems and Computing, eds. F. De La Prieta, J. María Escalona, R. Corchuelo, P. Mathieu, Z. Vale, T. Andrew Campbell, S. Rossi, et al., Vol. 473, 27–39. Seville, Spain: Springer International Publishing. doi:10.1007/978-3-319-40159-1_3.
- Faia, R., T. Pinto, and Z. Vale. 2016b. Optimization of electricity markets participation with QPSO. In 2016 13th International conference on the European Energy Market (EEM), 1–5. IEEE. doi:10.1109/EEM.2016.7521214.
- Faia, R., T. Pinto, and Z. Vale. 2017. GA optimization technique for portfolio optimization of electricity market participation. In 2016 IEEE Symposium Series on Computational Intelligence, SSCI 2016, Athens, Greece: IEEE. doi:10.1109/SSCI.2016.7849858.
- Faia, R., T. Pinto, Z. Vale, and E. J. Solteiro Pires. 2015. Portfolio optimization for electricity market participation with particle swarm. In 2015 26th international workshop on Database and Expert Systems Applications (DEXA), 62–67. Valencia, Spain: IEEE. doi:10.1109/DEXA.2015.31.
- Feng, Y., G. F. Teng, A. X. Wang, and Y. M. Yao. 2007. “Chaotic Inertia weight in Particle Swarm Optimization,” Innovative Computing, Information and Control, 2007. ICICIC ’07. Second International Conference on. p. 475.
- Fernández, A., and G. Sergio. 2007. Portfolio selection using neural networks. Computers & Operations Research 34 (4):1177–91. doi:10.1016/j.cor.2005.06.017.
- Gao, Y. I, X. h. An, and J. M. Liu. 2008. “A Particle Swarm Optimization Algorithm with Logarithm Decreasing Inertia Weight and Chaos Mutation,” Computational Intelligence and Security, 2008. CIS ’08. International Conference on, vol. 1. pp. 61–65.
- Kennedy, J., and R. Eberhart. 1995. Particle swarm optimization. Neural Networks, 1995. Proceedings., IEEE International Conference on 4: 1942–48 vol.4.
- Kentzoglanakis, K., and M. Poole. 2009. “Particle Swarm Optimization with an Oscillating Inertia Weight,” in Proceedings of the 11th Annual Conference on Genetic and Evolutionary Computation, 2009, pp. 1749–1750. doi:10.1145/1569901
- Koritarov, V. S. 2004. Real-world market representation with agents. IEEE Power and Energy Magazine 2 (4):39–46. IEEE.
- Lei, K., Y. Qiu, and Y. He. 2006. “A new adaptive well-chosen inertia weight strategy to automatically harmonize global and local searchability in particle swarm optimization,” 2006 1st International Symposium on Systems and Control in Aerospace and Astronautics. p. 4 pp.-980.
- Li, H., J. Sun, and L. Tesfatsion. 2011. Testing institutional arrangements via agent-based modeling: A U.S. Electricity market application. In Computational Methods in Economic Dynamics, eds. H. Dawid, and W. Semmler, 135–58. Berlin, Heidelberg: Springer Berlin Heidelberg. doi:10.1007/978-3-642-16943-4_7.
- Li, H-R., and Y-L. Gao. 2009. “Particle Swarm Optimization Algorithm with Exponent Decreasing Inertia Weight and Stochastic Mutation,” 2009 Second International Conference on Information and Computing Science, vol. 1. pp. 66–69. doi:10.1109/ICIC.2009.24
- Liu, M., and F. F. Wu. 2007. Portfolio optimization in electricity markets. Electric Power Systems Research 77 (8):1000–09. doi:10.1016/j.epsr.2006.08.025.
- Liu, Y.-J., and W.-G. Zhang. 2015. A multi-period fuzzy portfolio optimization model with minimum transaction lots. European Journal of Operational Research 242 (3):933–41. doi:10.1016/j.ejor.2014.10.061.
- Malik, R. F., T. A. Rahman, S. Z. M. Hashim, and R. Ngah. 2007. New particle swarm optimizer with sigmoid increasing inertia weight. Int. J. Comput. Sci. Secur. 1 (2):35–44.
- Markowitz, H. 1952. Portfolio Selection. The Journal of Finance 7 (1):77. doi:10.2307/2975974.
- MIBEL. 2007. “Mercado Iberico de Eletrecidade.” Net2U. February 27, 2007. http://www.mibel.com/index.php?lang=pt.
- Morais, H., T. Pinto, Z. Vale, and P. Isabel. 2012. Multilevel negotiation in smart grids for VPP management of distributed resources. IEEE Intelligent Systems. doi:10.1109/MIS.2012.105.
- Panigrahi, B. K., V. Ravikumar Pandi, and S. Das. 2008. “Adaptive particle swarm optimization approach for static and dynamic economic loaddispatch,” Energy Conversion and Management, vol. 49, no. 6, pp.1407–1415. doi:10.1016/j.enconman.2007.12.023
- Pinto, T., H. Morais, T. M. Sousa, T. Sousa, Z. Vale, I. Praça, R. Faia, and E. J. S. Pires. 2015a. Adaptive portfolio optimization for multiple electricity markets participation. Neural Networks and Learning Systems, IEEE Transactions On 1:99. doi:10.1109/TNNLS.2015.2461491.
- Pinto, T., Z. Vale, I. Praça, E. J. Solteiro Pires, and F. Lopes. 2015b. Decision support for energy contracts negotiation with game theory and adaptive learning. Energies 8 (9):9817–42. Multidisciplinary Digital Publishing Institute.
- Pinto, T., Z. Vale, T. M. Sousa, I. Praça, G. Santos, and H. Morais. 2014. Adaptive learning in agents behaviour: A framework for electricity markets simulation. Integrative Comput.-Aided Engineering 21 (4):399–415. Amsterdam, The Netherlands, The Netherlands: IOS Press.
- Ponsich, A., A. L. Jaimes, and C. A. C. Coello. 2013. A survey on multiobjective evolutionary algorithms for the solution of the portfolio optimization problem and other finance and economics applications. IEEE Transactions on Evolutionary Computation. doi:10.1109/TEVC.2012.2196800.
- Qin, Z., F. Yu, Z. Shi, and Y. Wang. 2006. “Adaptive Inertia Weight Particle Swarm Optimization,” In Proceedings of the 8th International Conference on Artificial Intelligence and Soft Computing, 2006, pp. 450–459.
- Rini, D. P., S. M. Shamsuddin, and S. S. Yuhaniz. 2011. Particle swarm optimization: technique, system and challenges. International Journal of Computer Applications 14 (1):19–27. doi:10.5120/1810-2331.
- Santos, G., T. Pinto, T. M. Hugo Morais, I. F. Sousa, R. F. Pereira, I. Praça, and Z. Vale. 2015. Multi-agent simulation of competitive electricity markets: Autonomous systems cooperation for european market modeling. Energy Conversion and Management 99:387–99. doi:10.1016/j.enconman.2015.04.042.
- Sharma, K. C., R. Bhakar, and H. P. Tiwari. 2014. Strategic bidding for wind power producers in electricity markets. Energy Conversion and Management 86 (October):259–67.
- Shi, Y., and R. Eberhart. 1998. A modified particle swarm optimizer. Evolutionary Computation Proceedings, 1998. IEEE World Congress on Computational Intelligence., The 1998 IEEE International Conference on.
- Sioshansi, F. P. 2013. Evolution of global electricity markets: New Paradigms, New Challenges, New Approaches. 1sted. USA: Elsevier Science & Technology. https://books.google.pt/books/about/Evolution_of_Global_Electricity_Markets.html?id=xAJImAEACAAJ&pgis=1.
- Theodorsson-Norheim, E. 1986. Kruskal-Wallis Test: BASIC computer program to perform nonparametric one-way analysis of variance and multiple comparisons on ranks of several independent samples. Computer Methods and Programs in Biomedicine 23(1):57–62. Elsevier. doi:10.1016/0169-2607(86)90081-7.
- Velik, R., and P. Nicolay. 2014. A cognitive decision agent architecture for optimal energy management of microgrids. Energy Conversion and Management 86:831–47. doi:10.1016/j.enconman.2014.06.047.
- Xin, J., G. Chen, and Y. Hai 2009. “A Particle swarm optimizer with multistage linearly-decreasing inertia weight,” Computational Sciences and Optimization, 2009. CSO 2009. International Joint Conference on, vol. 1. pp.505–508.
- Zhu, H., Y. Wang, K. Wang, and Y. Chen. 2011. Particle Swarm Optimization (PSO) for the constrained portfolio optimization problem. Expert Systems with Applications 38 (8):10161–69. doi:10.1016/j.eswa.2011.02.075.