
 ?Mathematical formulae have been encoded as MathML and are displayed in this HTML version using MathJax in order to improve their display. Uncheck the box to turn MathJax off. This feature requires Javascript. Click on a formula to zoom.
ABSTRACT
Predicting customer decisions allows companies to obtain higher profits due to better resource management. The accuracy of those predictions can be currently boosted by the application of machine learning algorithms.
We propose a new method to predict a car driver’s decision about taking a replacement car after a vehicle accident happens. We use feature engineering to create attributes of high significance. The generated attributes are related to time (e.g., school holidays), place of collision (e.g., distance from home), time and conditions (e.g., weather), vehicles (e.g., vehicle value), addresses of both the victim and the perpetrator. Feature engineering involves external sources of data.
Five machine learning methods of classification are considered: decision trees, multi-layer perceptrons, AdaBoost, logistic regression and gradient boosting. Algorithms are tested on real data from a Polish insurance company. Over 80% accuracy of prediction is achieved. Significance of the attributes is calculated using the linear vector quantization method.
Presented work shows the applicability of machine learning in the car insurance market.
Introduction
In many countries, after a traffic incident, the victim calls an insurance company of the perpetrator and submits compensation claims. In the process of receiving and satisfying these claims, insurance companies in Poland are obliged to ask the claimant whether or not their vehicle needs to be repaired and if so, the company must offer a means of temporary transportation. The claimant chooses one of the four options: (i) take a cash compensation, (ii) rent a car offered by the insurer, (iii) rent a car on the market and submit the invoice to the insurer, and (iv) not to take anything. If the insurer is able to predict victim’s decision with high accuracy right at the beginning of the process, its costs may be reduced significantly due to faster and more profitable agreement between the claimant and the insurer. Moreover, the knowledge of an uncertainty level of the injured party’s decision makes the negotiations more efficient; therefore, the costs are reduced even more.
The claimant’s choice has significant business implications for the insurer.
The costs of the replacement vehicle are covered by the insurance company – either by covering the bill from a rental company from which the victim rented the car, or by offering a vehicle from a rental company that has an ongoing negotiated agreement with the insurer, the latter option being cheaper.
Usually the amount of the agreed cash compensation is significantly lower than the cost of replacement car rental, which means that phone consultants presenting the choice to the claimant will try to persuade them to choose cash over replacement car.
While presenting the choice to the injured party and subsequently negotiating on the phone, consultant consumes his time and increases costs of the insurer. Importantly, sometimes such negotiations are a complete waste of consultant’s time, especially if they try to persuade the claimant to make a decision, which is highly unlikely for the person.
It is reasonable to suspect that from the decision-maker’s (claimant) point of view, the choice between a replacement car and cash may depend on many external factors:
whether or not the claimant is able to continue their everyday routine using public transportation;
weather conditions outside;
a distance between claimant’s home and the place of the accident.
to name a few.
As the claimant does not usually have any record in the insurer’s databases (but the perpetrator obviously does), only basic data describing the person making the decision is available. However, we speculate that it is possible to develop a system that will provide the most likely decision and the level of uncertainty. The decision factors can be measured, and we assume that at least some of them can be gathered by the insurance company.
Machine learning is widely used to solve specific problems that insurance companies face. For example, there are at least several dozens of ML-based approaches to detect insurance fraud (Ngai et al. Citation2011). On the other hand, we were unable to find any articles regarding improvement of the victim’s compensation process via machine learning-based methods. The goal of this research is to create a machine learning approach for claimants’ decisions prediction. We use the data gathered by Aspartus Ltd. which provides information systems for leading insurance companies in Poland.
The remaining part of the paper is organized as follows: Section 2 presents the data on the incidence of car accidents and their participants gathered by the insurer; Section 3 presents new features, devised within the project, which can be created on the basis of data given and data publicly available; Section 4 presents the classifier and analyzes its performance. A concluding section follows.
The Insurance Database
The dataset used in the research contains the data gathered throughout six months. It contains only 1% of records with complete attributes, even if the set of attributes was limited to 20. After completing the process of feature engineering and filling the missing values, the final dataset contained 44 543 records, which were described by 57 features. Twenty-two of the features were categorical, 35 of them were continuous.
The target class for the decision of the claimant takes four values:
N/A – no information about replacement car/cash compensation, or victim’s refusal to take any form of compensation;
CASH – compensation chosen;
RENTAL_INS – a replacement car provided by the insurance company;
RENTAL_EXT – a replacement car which was not provided by the insurance company.
The distribution of the target attribute is described in .
Table 1. Distribution of target attribute.
Due to the fact that the records with N/A value may describe the records where the information on a customer’s decision is unavailable, we decided not to use these records.
The features provided by the insurance company contained unprocessed data referring to some aspects of the accident. At the beginning of the project, they were insufficient for a reliable classification process. In order to improve classification results, the team suggested several ways of enhancing the dataset with new features, based on existing attributes, and filling the missing data in original ones.
The original dataset contained 73 attributes. Amongst them, only 26 were later used in the classification process, and further 22 allowed to generate new 63 attributes. Twenty-five other attributes present in the original dataset were rejected in the beginning, as experts considered them unreliable or meaningless for further experiments.
Features which were involved in later classification can be categorized into three groups, as depicted in .
Table 2. Features used in presented approach.
We rejected the possibility of using information about specific vehicle model in classification due to a wide variety of different models in the dataset, and many different errors in that field.
The original dataset contained many missing attributes’ values (later referred to as ‘gaps’), which needed to be filled before starting the classification process. It caused the need to establish some assumptions about the data and rules of filling the gaps. The following rules were established after consulting experts in the field of car insurances:
Gaps in age attribute – filled with an average across all the dataset.
Gaps in attribute describing a number of cars owned – it was assumed that claimant has only one vehicle with TPO and only one vehicle with Comprehensive Insurance.
Gaps in attribute describing a desire to repair damage – it was assumed that the claimant intends to repair car damage.
Next, collision town names needed to undergo corrections, because they contained many misspellings. This was performed in a two-step process. First, each name underwent standardization procedure (i.e., removal of Polish characters, reformatting to standard capitalization, etc.); then for each name not existing in the dictionary, Levenshtein (Levenshtein Citation1966) distances from every known Polish town name were calculated. From these, all names below set threshold (3) were chosen and the name with the lowest distance substituted original. If more than one name had the lowest distance then such city was marked as unknown.
Feature Engineering
Attributes related to time, vehicles involved, place of accident and addresses of both victim and perpetrator were used to generate further features.
The estimation of vehicle’s value was obtained with the aid of a vehicle’s model Eurotax (Author, 0000) identifier and estimated mileage. In order to estimate the mileage, which was not available in the dataset, the following equation was used:
where:
For vehicles with no Eurotax identifier available, the value was calculated with relation to current market scrap prices, where car weight is correlated with car value, as follows:
The attributes that describe the place of accident and addresses of people involved allowed to calculate (using postal codes) geographical coordinates, which further allow to generate attributes relating to distances, e.g., distance between perpetrator’s and victim’s addresses, the distance between perpetrator’s address and the accident place. We calculated geographical distances using Vincenty’s formulae.
Geographical coordinates also allowed to download the data about weather circumstances at the date of accident and at the date of filling report on damages, which formed 13 new attributes. Having the data about the weather, we calculated estimation of the weather forecast in upcoming days after the day of filling the report on damages. Unfortunately, the real data about the forecast were unavailable, which is why it was estimated using actual weather description in following 5 days, as depicted in Eq. (1), where daily_weather is calculated from weather description using Equation (2).
The data obtained from Insurance Guarantee Fund allowed for creation of a numerical feature describing the claimant’s knowledge about a possibility of obtaining a replacement vehicle. We use the previous accident dates as depicted in Equation (3).
– number of previous victim’s accidents
– number of days between date of latest accident and
-th previous accident
– empirical parameter.
Finally, the information of day type (weekends, school holidays, bank holidays, etc.) was added.
Classification
Feature Selection
The learning vector quantization (LVQ) (Kohonen, Schroeder, and Huang Citation2001) was used to find the most important attributes, using Gevrey’s ‘weights’ method (Gevrey, Dimopoulos, and Lek Citation2003). We chose this method because its output is easily interpretable by human experts. We checked all features, both original and engineered, and 57 most important were further used in the classification. The attribute importance order was much different from the one previously created by human experts, e.g., 20 most important attributes contained only 6 attributes from the original dataset.
Binary Classification
Machine learning classification algorithms were used to predict a victim’s decision about a replacement vehicle. We did not use records with N/A value depicted in . Moreover, we merged RENTAL_INS and RENTAL_EXT, such that we did not differentiate between renting a car from the insurance company and from the car rental market. After this process, two decision classes had been defined: CASH and RENTAL.
As the data had been collected over several different time periods, between which the business processes had changed and samples varied significantly, it was crucial to shuffle the data prior to validation. When the shuffled data is used in the process of k-fold cross-validation its likely that samples from each time period could be found in each split. We used 10-fold stratified cross-validation to evaluate different machine learning models. Furthermore, to fully account for the time periods problem we evaluated the best model found (Gradient Boosting) using leave-one-out cross-validation and compared results between two validation procedures. This allowed us to validate our shuffled k-fold approach, without carrying out time-consuming computations for each tested model.
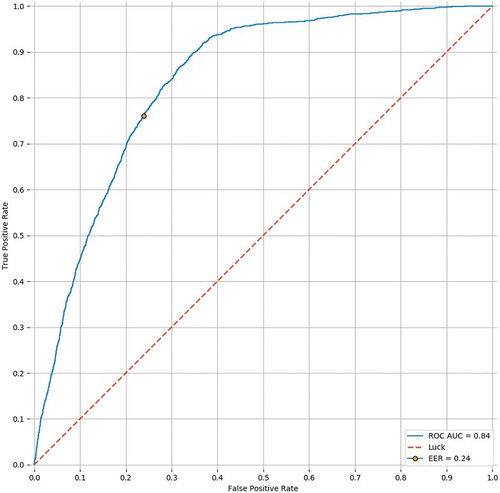
Cross-validation results are presented as receiver operating characteristic (ROC) curves in and , respectively, for 10-fold and leave-one-out cross-validation. Comparison between these two validation strategies indicates that usage of 10-fold stratified cross-validation is viable for this research, as obtained results are almost identical (0.83 vs 0.84 AUC, respectively).
Figure 1. ROC for 10-fold cross-validation for binary classification (cash or rental car).
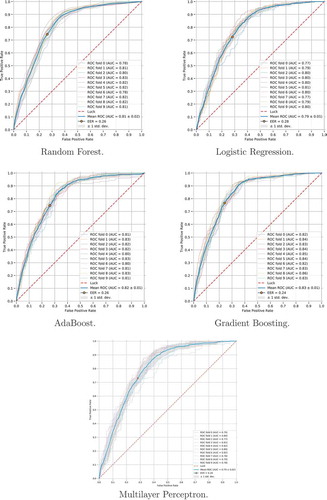
Figure 2. Results of leave-one-out cross-validation for the gradient boosting method.
As summarized in , where we depict area under ROC curve (AUC) as well as equal error rate (ERR) for each classifier, classifiers achieved similar results, with Gradient Boosting being the best of them.
Table 3. Synthetic results of 10-fold stratified cross-validation for binary classification.
Based on similarities between ROC curves, as well as AUC and EER values, we can argue that our model generalizes well on the given dataset and its results are repeatable.
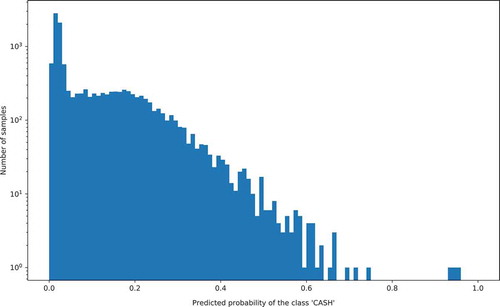
Additionally, predictions acquired via leave-one-out cross-validation were used to create histograms of probability of ‘CASH’ class, which are illustrated in . These histograms indicate a small number of samples for the ‘CASH’ class, for which probability of the ‘CASH’ decision class is high. This could be caused by problems such as missing attribute values, the lack of strongly correlated attributes or high decision class imbalance in the provided dataset.
Figure 3. Histogram of probabilities of the ‘CASH’ class for the gradient boosting method.
Multi-Class Classification
We use dataset where records with N/A attributes (depicted in ) were removed. The logistic regression model yields confusion matrix depicted in .
Figure 4. Confusion matrix.
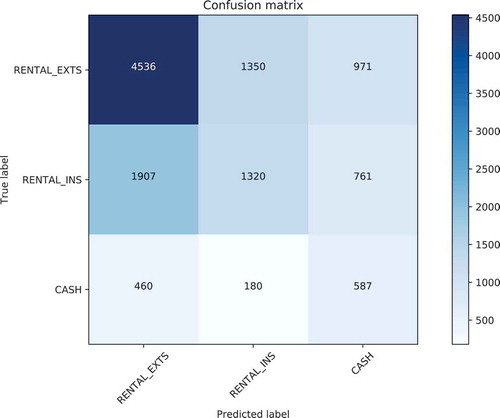
The results of experiments for the multi-class classification show that such classification problem is harder to model in comparison to the binary one. The reason for this difficulty partially stems from the high decision class imbalance and partially from the fact that two classes describing car rental (RENTAL_INS and RENTAL_EXT) show great similarity.
Software
We performed all calculations on a PC computer with 64-bit Ubuntu 17.04. We use Python 3.5 and machine learning algorithms from scikit-learn (Pedregosa et al. Citation2011).
Discussion
The project allowed us to obtain satisfying results in predicting the claimant’s decision on taking a replacement car. We were able to achieve 80% classification accuracy in a binary setting. Unfortunately, due to the poor quality of the whole dataset, the results were unsatisfactory for 3-classes problem. This was caused by the following facts:
a vast majority of target attributes’ values were not available – possibly hindering proper classification of two similar RENTAL classes,
it was impossible to distinguish between situations where the victim did not use their rights to obtain a replacement vehicle, and where there was no information regarding their decision – this effectively reduced the dataset by two-thirds.
However, the outcome on reduced dataset proves, that it is worth trying to further develop the system and later evaluate it on bigger and more complete dataset. The further works shall include the development of prototype system, the definition of new attributes, redefining some attributes in the dataset and examining classification accuracy by means of algorithms for balancing highly imbalanced dataset, like SMOTE (Chawla et al. Citation2002). Poor results arising from multi-class experiment prove that there is a need to define attributes which would allow distinction between the possibility of renting a car from the insurance company and from the market. Further development of the system, as well as enlarging the dataset with new reliable values may lead to significant progress in classification accuracy.
Acknowledgments
The paper is the result of cooperation with Aspartus Ltd. on predicting user decision in car insurance. We would like to thank Marcin Wójciuk, Adam Smółkowski and Robert Kluz for all their support in our experiments. Data used in this study are the property of Aspartus Ltd. To inquire about obtaining the dataset please contact the company.
References
- “Eurotax web page.” 2018. Autovista Polska sp. z o.o. http://www.eurotax.pl/en
- Chawla, N. V., K. W. Bowyer, L. O. Hall, and W. P. Kegelmeyer. 2002. Smote: Synthetic minority over-sampling technique. Journal of Artificial Intelligence Research 16:321–57. June. doi: 10.1613/jair.953.
- Gevrey, M., Y. Dimopoulos, and S. Lek. 2003. Review and comparison of methods to study the contribution of variables in artificial neural networks models. Ecological Modelling 160 (03):249–64. doi:10.1016/S0304-3800(02)00257-0.
- Kohonen, T., M. R. Schroeder, and T. S. Huang, eds. 2001. Self-organizing maps. 3rd ed. Berlin, Heidelberg: Springer-Verlag.
- Levenshtein, V. I. 1966. Binary codes capable of correcting deletions, insertions and reversals. Soviet Physics Doklady 10:707. Feb.
- Ngai, E., Y. Hu, Y. Wong, Y. Chen, and X. Sun. 2011. The application of data mining techniques in financial fraud detection: A classification framework and an academic review of literature. Decision Support Systems 50 (3):559–69. On quantitative methods for detection of financial fraud. doi:10.1016/j.dss.2010.08.006.
- Pedregosa, F., G. Varoquaux, A. Gramfort, V. Michel, B. Thirion, O. Grisel, M. Blondel, P. Prettenhofer, R. Weiss, V. Dubourg, et al. 2011. Scikit-learn: Machine learning in python. Journal of Machine Learning Research 12:2825–30.