
 ?Mathematical formulae have been encoded as MathML and are displayed in this HTML version using MathJax in order to improve their display. Uncheck the box to turn MathJax off. This feature requires Javascript. Click on a formula to zoom.
ABSTRACT
Handwritten digit classification is a well-known and important problem in the field of optical character recognition (OCR). The primary challenge is correctly classifying digits which are highly varied in their visual characteristics primarily due to the writing styles of different individuals. In this paper, we propose the use of Convolutional Neural Networks (CNN) for the purpose of classifying handwritten Bangla and Hindi numerals. The major advantage that we face by using a CNN-based classifier is that no prior hand-crafted feature needs to be extracted from the images for efficient and accurate classification. An added benefit of a CNN classifier is that it provides translational invariance and a certain extent of rotational invariance during recognition. Applications can be found in real-time OCR systems where input images are often not perfectly oriented along a vertical axis. In this work, we use modified versions of the well-known LeNet CNN architecture. Extensive experiments have revealed a best-case classification accuracy of 98.2% for Bangla and 98.8% for Hindi numerals outperforming competitive models in the literature.
Introduction
Optical Character Recognition (OCR) is the process by which images of handwritten or machine-printed text are electronically encoded into machine-readable form. Applications of OCR systems include the conversion of text available in different non-editable formats into a form, which can be easily manipulated by general purpose text editors. Without OCR systems, the conversion of such non-editable formats would have to be carried out manually, a time consuming and laborious job. One of the challenging tasks of OCR is the recognition of handwritten characters (Cheriet et al. Citation2009). Much of the most challenging material requiring recognition is obtained from handwritten sources like forms, bank cheques, handwritten mailing addresses and others. The main difficulty is dealing with a variety of writing styles of different individuals. Even a single individual can write in different styles depending on the environment or task. Hence, correct recognition of a character amidst thousands of such handwritten styles requires an OCR system with robust and agile algorithms, which in turn introduces the necessity for innovation, creativity, and development in this field, thus making it interesting to the researchers.
In this paper, we address handwritten digit recognition, a special case of the general handwritten character classification problem. Classification necessitates the extraction of features, which are optimized to recognize the discriminatory patterns that separate one image class from others. At the same time, these extracted features should be less sensitive to extraneous distortions that may produce visual differences between images belonging to the same pattern class. The primitive set of features is the set of pixel intensities describing an image, where each pixel in a size-normalized image is considered as a feature, hence, the number of features is equal to the number of pixels in the image. This approach, however, has a number of disadvantages. One is that an image can contain thousands of pixels giving rise to a very high dimensional feature space. Construction of optimal decision boundaries in such a feature space requires a large number of training samples for any pattern classifier. Furthermore, the discriminatory information required for differentiating between image classes is often found in spatially localized regions of the image. The approach of training a classifier with pixel intensities ignores these localized pattern differences and is relatively inefficient. An approach to deal with this problem is to extract features from an image which can effectively convey the differences in spatially localized patterns while simultaneously reducing the dimensionality of the feature-space. Several innovative ideas have been proposed in this direction that are worth mentioning.
Cao, Ahmadi, and Shridhar (Citation1995) proposed a zone-based feature extraction method using directional histograms and multiple neural classifiers for the recognition of handwritten Roman numerals. In their work, the use of more than one expert system has been suggested for better classification accuracy. Park, Govindaraju, and Srihari (Citation2000) presented a classification mechanism using a hierarchical feature space and tested it on the NIST digit database. Given an input image of a character, the initial step involves extraction of coarse-resolution features from the image. The image is then divided into sub-images and the same procedure is recursively carried out at finer levels of resolution. The recursion ends when the given classification criterion is satisfied. The sub-images are chosen adaptively based on the level of discriminatory information that they contain.
Basu et al. (Citation2005a) proposed a method to classify handwritten Bangla numerals by dividing the image into a fixed number of equal-sized regions. A combination of shadow features, centroid features and longest-run features is then extracted from the image to train a Multi-Layer Perceptron (MLP) for distinguishing pattern classes. Another work is presented by Rajashekararadhya et al (Citation2008), where a given image of a handwritten character is divided into zones and the extracted features are based on image centroids as well as zone centroids. For each zone in the image, the mean distance between the image centroid and every pixel in the zone is computed. The same metric is also computed with respect to the zone centroid. In this way, the authors extract 2 n features where n is the total number of zones. These features are then used to train nearest neighbor classifiers and feed-forward neural networks for the classification of handwritten numerals in Kannada, Telugu, Tamil, and Malayalam scripts. Other notable works in this field include the application of genetic algorithms (Das et al. Citation2007), (Das et al. Citation2012b), fuzzy-geno approaches (Basu et al. Citation2006), quad-tree-based longest run feature extractors (Das et al. Citation2012a), MLP based classifiers (Basu et al. Citation2009a), (Basu et al. Citation2005b), Support Vector Machines (SVM) (Das et al. Citation2009), (Basu et al. Citation2010), script-based classifiers (Basu et al. Citation2009b) and others.
It should be noted that all the works mentioned above focus primarily on features extracted from an image based on human intuition. The performance of such hand-crafted heuristics is, thus, heavily dependent on how well they have been designed to capture the shape characteristics. Moreover, the feature extractors are often optimized to solve a particular problem. This problem-specific approach to manually designing features leads to a loss of generality in the models. In our work, we use a method, which can integrate the automated extraction of features from a given image with its subsequent classification, convolutional neural networks (CNNs) (LeCun et al. Citation1989). Their architecture can be specially tailored for the task of 2D image recognition.
CNNs represent an image as an agglomeration of sub-patterns of lower dimensions. These sub-patterns are the learnable features for a CNN and the location of such features with respect to one another is used as the discriminatory information for distinguishing pattern classes. An additional benefit of convolutional networks is their tolerance for geometric transformations including translation and rotation that may affect the classification result. In other words, CNNs can effectively recognize an object in a 2D image even when the object is shifted from the center of the image or rotated by a relatively small angle about its center. These advantages have made CNNs, the classifier of choice for our study. In fact, CNN-based classifiers have been applied to various problems including 2D face detection (Lawrence et al. Citation1997), handwritten character recognition (LeCun et al. Citation1998), time-series modeling and speech recognition (LeCun et al. Citation1995) and others (Cecotti et al. Citation2011), (Perlin et al. Citation2015), (Antipov, Berrani, and Dugelay Citation2016), (Zhu et al. Citation2015). In this paper, we apply convolutional networks for classification of handwritten numerals in Bangla and Hindi, two of the most popular languages in India.
Extensive experiments have been carried out to test three areas of performance for CNN-based classifiers: a) the dependence of classification accuracy on the size of the training set, b) the changes in classification accuracy obtained by applying cross-validation schemes for training and c) the effect of inducing rotated images in the training set in order to achieve rotational invariance for large angles of rotation. In the experiments, we use customized versions of the well-known LeNet (LeCun et al. Citation1998) architecture. The results of our experiments reveal a best-case classification accuracy of 98.2% for Bangla and 98.8% for Hindi numerals, outperforming competitive models by a significant margin. With the high classification performance, the experiments indicate the applicability of CNNs for the task of handwritten digit recognition in Bangla and Hindi.
The remainder of this paper is organized as follows. Section 2 provides a detailed description of the general architecture of a CNN along with the modified versions of LeNet used in our experiments. Section 3 deals with experiments and performance analysis of the CNN models. Conclusion is reported in Section 4.
Convolutional Neural Networks (CNN) and LeNet: An Overview
The working principles of a CNN (LeCun et al. Citation1989) are primarily two-fold. Firstly, an image is viewed as a composite collection of patterns or sub-images. The network identifies such patterns as visual features in a hierarchical bottom-up fashion depending on the network’s depth. The lower order features detected in the initial hidden layers of a CNN include elementary patterns like edges and corners. These features are further combined to form higher order features, which are identified at deeper layers of the network. Finally, the location of each detected feature with respect to other features is used by the network to differentiate among pattern classes.
Convolutional Neural Networks (CNN)
A CNN is a deep learning (Schmidhuber Citation2015) architecture specialized for the task of image recognition and classification. The input instances for a CNN include the pixel intensities of an image arranged in the form of a 2D array. Each input unit corresponds to a single pixel intensity in the image. Multiple such input planes may be required for color images (such as RGB images). The output of the CNN is a vector of length k as given below
where k is the number of pattern classes and the element indicates the confidence of the given image belonging to the ith pattern class. There are three main types of layers in a typical CNN architecture, which map the input to the output: i) the convolution layer, ii) the pooling or sub-sampling layer and iii) the fully connected layer.
The convolution layer is responsible for the detection and extraction of visual features from spatially localized neighborhoods of the image. Let a grayscale image of dimensions be represented as an
matrix
of real numbers, where the element
corresponds to the pixel intensity of the (i,j)th pixel in the image at the ith row and jth column. For the sake of simplicity, we assume the image to be grayscale so that a single matrix of pixel intensities suffices to describe the image. Each element in the matrix
is an input for the CNN. In order to detect localized features, the image is first partitioned into a number of small partially overlapping windows. These windows are also known as local receptive fields in the literature. Let the dimensions of each window be
where
and let the window be indexed according to the location of its top left pixel. Thus, a window
corresponds to a square region of pixels with
at the top left and
at the bottom right. It should also be noted that the row-wise adjacent windows of
are
(left) and
(right) whereas the column-wise adjacent windows are
(above) and
(below). This indicates that two consecutive windows represent local regions of the image, which are overlapping except for two rows or two columns of pixels.
The job of the convolution layer is to recognize the presence of one or more visual patterns or features in each local receptive field of the image i.e., from to
Clearly, the detection of a single feature, for example feature A, in a given window
is in itself, a full-fledged computational task. Hence, it is sensible for the convolution layer to allocate a hidden neuron for identifying feature A in the window
However, the same feature may appear in other local regions or windows of the image as well. Each such window should be allotted its own feature A detector. This calls for a set of hidden neurons, one for each window, performing the task of detecting the presence of feature A in their respective windows. The replication of the same operation over a set of multiple neurons requires each of them to possess an identical set of
trainable weights and a single trainable bias. Such a set of neurons in the convolution layer is called a feature map. Let the output of the convolution neuron connected to the window
be
as given below
where w represents the dimensionality of the window
is the weight corresponding to the (i,j)th pixel intensity
in the window
b denotes the bias and
is the activation function of the neuron. Common candidates for the activation function include the sigmoid and the hyperbolic tangent functions. It is worth noting that in Equationequation (2)
(2)
(2) , the weights and the bias are independent of the location (p,q) of the window, indicating that they are replicated over all the neurons in a feature map. A generic convolution layer possesses multiple such feature maps, representing multiple learnable visual features where all hidden neurons in a feature map share the same set of weights and bias.
A pooling or sub-sampling layer is used to create compressed versions of the feature maps produced by the convolution layer. The objective of pooling is to lower the resolution of the feature maps by discarding the knowledge about the exact positions of features detected in an image. Lowering the dimension of the feature maps reduces the computational load for later layers along the network. This can be compensated for by increasing the number of feature maps in deeper convolution layers, providing a rich representation of visual features. Two common pooling strategies employed in our work are max pooling and the average pooling. Let a feature map from the convolution layer be represented as a matrix where the element
corresponding to the pth row and qth column is given by Equationequation (2)
(2)
(2) . The matrix
is divided into disjoint
regions and for each such region, a hidden neuron is allocated in the pooling layer, thereby downscaling the feature map
by a factor of 4 (both the width and the height are reduced by a factor of 2). In the max pooling scheme, the neuron outputs the maximum activation in the region and in the average pooling scheme, it outputs the mean activation in the region. Let a region
be represented by the values
and
The output of the max pooling and average pooling neuron corresponding to the region
a
and
respectively as follows:
With our pooling strategies, given that there are h feature maps in the convolution layer each with dimensions the output of the pooling layer is a set of h compressed feature maps with dimensions
The final hidden layer in a typical CNN architecture is a fully connected layer. Each neuron of the previous layer (generally a pooling layer) is connected to all the neurons of a fully connected layer. The main purpose of this layer is to learn the relative positions of different sub-patterns or features with respect to one another that can serve as the discriminatory information to identify a pattern class. A schematic diagram of a simplified CNN architecture is illustrated in . The input is a grayscale image of dimensions The image is partitioned into
local receptive fields and connected to a convolution layer having two feature maps, A and B, respectively. The feature maps are then condensed using a pooling layer which finally leads to a fully connected output layer having four neurons representative of four pattern classes.
Figure 1. A simple CNN architecture for solving a 4-class classification problem
The LeNet Architecture
In our work, we make use of the well-known LeNet (LeCun et al. Citation1998) CNN architecture for all our experiments. The input is a 32 × 32 grayscale image with each input neuron representing a pixel intensity. There are 5 main hidden layers and a single output layer in the concerned CNN architecture. The structure of the LeNet CNN is illustrated in . The first hidden layer C1, is a convolution layer mapping each receptive field from the input layer to a single neuron in each feature map. There are a total of 20 feature maps in this layer, each having dimensions
The convolution layer C1 is followed by the pooling layer P2 which is also the second hidden layer in the network. The layer P2 produces 20 condensed feature maps from the 20 feature maps in C1. This is done by connecting each disjoint 2 × 2 region in a convolution feature map to a single neuron in the corresponding condensed feature map, thereby downscaling the dimensions of each convolution feature map by a factor of 4 (each dimension by a factor of 2). Naturally, the condensed feature maps have a dimension of 14 × 14. The pooling neuron produces either the maximum or the average of its four inputs depending on the pooling scheme used.
Figure 2. Architecture of the LeNet CNN used in the experiments
The hidden layer C3 is a convolution layer, which maps 5 × 5 receptive fields in each of the condensed feature maps from layer P2 to a single neuron in a feature map. There are a total of 50 feature maps in this layer. The reason behind an increase in the number of feature maps is that the reduction of the dimensionality of the image facilitates a larger number of feature maps, thereby leading to a comparatively richer representation of visual patterns or features in the image. Each convolution layer uses the sigmoid function as its activation function. It should be noted that a neuron in a feature map of layer C3 is connected to 20 receptive fields in the previous layer. Clearly, with 14 × 14 condensed feature maps in P2 being sampled using 5 × 5 receptive fields, the dimension of each feature map in C3 is 10 × 10. Each of the 50 feature maps in C3 is further compressed using a second pooling layer P4 to half of its dimensions (i.e., 5 × 5). In our experiments, we employ the same pooling scheme (either max pooling or average pooling) in both the pooling layers. Hence, the pooling layer P4 also uses either the max or average pooling method. The condensed feature maps of layer P4 are fully connected to 500 neurons in the fully connected layer F5. This layer leads up to the output layer containing 10 neurons corresponding to the 10 digits (pattern classes). The softmax loss function (Lee et al. Citation2015) is used for computing error during training and the well-known backpropagation algorithm (LeCun et al. Citation1998) is used to train the weights and biases of the network.
Experiments and Results
In this section, we discuss the experiments undertaken on images of handwritten digits belonging to the Bangla and Hindi scripts.
Datasets
The datasets used for our experiments are as follows:
Dataset 1: The dataset consists of 6000 images of Bangla handwritten digits. In order to construct this dataset, a larger database of 10,000 sample images was used, from which 600 images per digit were randomly selected. This larger database was created by the combined efforts of CVPR, Indian Statistical Institute (ISI), Kolkata and CMATER, Jadavpur University. The dataset (CMATER Dataset Citation2012) has been made freely downloadable to the research community. Each sample in the dataset is a grayscale image. A few sample images of this dataset are shown in .
Figure 3. Sample handwritten numerals from datasets: (a) Dataset 1 (Bangla numerals), (b) Dataset 2 (Hindi numerals)
Dataset 2: The dataset comprises 3000 bitmap images of Hindi handwritten numerals where each sample image has dimensions The process of construction of the dataset is similar to Dataset 1 and it is also freely available online. A few sample images of this dataset are shown in .
Experimental Protocol
With these datasets, the following experiments were carried out to determine the classification performance of the LeNet (LeCun et al. Citation1998) CNN architecture.
Experiment 1: A comparison of the classification accuracy levels of the well-known Max pooling and Average pooling (Scherer, Muller, and Behnke Citation2010) schemes have been performed on both Dataset 1 and Dataset 2 by dividing them into a training set of variable size and a test set of fixed size. This experiment also measures the variation of classification accuracy with change in number of training samples.
Experiment 2: A 10-fold cross-validation scheme for testing classification accuracy is employed to detect possible improvements in classification performance by the LeNet CNN. For this experiment, both Dataset 1 and Dataset 2 have been divided into fixed size training and test sets where, the test set is chosen as a variable subset of the given dataset.
Experiment 3: This experiment tests the effectiveness of the rotational invariance property of the LeNet architecture when applied to the classification of handwritten numerals in Datasets 1 and 2. The experiment is carried out in three primary steps to measure classification accuracy in the following scenarios: i) presence of images rotated clockwise by either 90 degrees or 180 degrees in both training and test sets, ii) presence of images rotated clockwise by both 90 and 180 degrees in training and test sets, iii) presence of images rotated clockwise by either 30 degrees or 45 degrees in just the test set.
All experiments have been carried out using the Caffe (Jia Citation2013) deep learning framework with Nvidia Digits as the interactive GUI on an Intel core i7 processor with 4 GB of RAM. The maximum number of iterations for training the CNN was 10000. The initial learning rate was 0.01 and it was reduced by 10% after every 500th iteration. A detailed analysis of the experimental results obtained is provided in the subsequent sections.
Experimental Results
In the following sub-sections, we discuss and analyze the results of each of our experiments.
Experiment 1: Comparison of Pooling Schemes
The primary motivation behind the experiment detailed out in this section is to compare the relative performance of two well-known pooling schemes, Max pooling, and Average pooling. The experiment also tests the variation of classification accuracy with the size of the training set. The following steps are involved for the experiment:
Step 1. A training set and a test set are constructed from the given dataset, where the size of the training set is varied from 500 to 5500 images for Dataset 1 and from 500 to 2500 images for Dataset 2. The size of the test set is kept constant at 500 images. A fixed number of images (i.e., 500) is kept aside for testing and a random sampling from the remaining images is used for training set construction.
Step 2. With each of the dataset configurations, the LeNet CNN is trained with two variations in its structure. In the first run, the network is configured with max pooling in both its pooling layers and in the second run, mean pooling or average pooling is employed in both the pooling layers. The results are summarized in for Dataset 1 and in for Dataset 2. The change in classification accuracy with the training set size for this experiment is plotted in . The feature map weights corresponding to the first convolution layer for each run of the experiment are illustrated in where, higher weight values are represented by darker shades.
Table 1. Percentage accuracy for Max and Average pooling schemes for Dataset 1 (Best case accuracy values are given in bold)
Table 2. Percentage accuracy for Max and Average pooling schemes for Dataset 2. (Best case accuracy values are given in bold)
Figure 4. Variation of classification accuracy with size of training set for (a) Dataset 1 and (b) Dataset 2
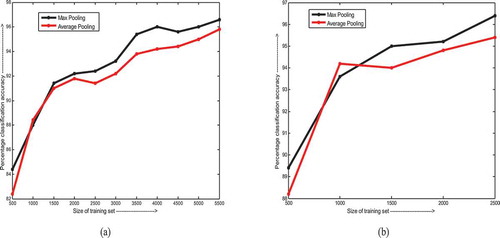
Figure 5. Feature map weights for the first convolution layer for the experimental setups: (a) Bangla dataset with max pooling scheme, (b) Bangla dataset with average pooling scheme, (c) Hindi dataset with max pooling scheme, (d) Hindi dataset with average pooling scheme
It is evident from , and , that the classification accuracy shows a general rise with increase in training set size. The max pooling method outperforms average pooling by a considerable margin for both the languages, Bangla, and Hindi. The max pooling scheme considers the largest activation value of the pooled neurons whereas the average pooling scheme considers the mean activation value of the same. Consequently, if very few of the pooled neurons fire (or have high activation values indicating the presence of a certain feature in the corresponding spatial region of the image), the max pooling scheme would detect the existence of the feature whereas the average pooling scheme might fail.
Experiment 2: Cross-validation
In this experiment, we perform a 10-fold cross-validation on the datasets with the objective of improving classification accuracy. The max pooling scheme is employed for both the Bangla and Hindi scripts due to its relatively high classification accuracy as seen from the previous experiment. For this experiment, we carry out the following steps:
Step 1. The dataset is divided into a training set and a test set in a way so as to implement a 10-fold cross-validation. The size of the test set is set to a tenth the size of the entire dataset. The test set is shifted as a fixed size sliding-window along the dataset where two consecutive test sets chosen from the dataset are contiguous and disjoint. For Dataset 1, the training set consists of 5400 images and the test set contains 600 images. For Dataset 2, the training set comprises 2700 sample images and the test set has 300 images.
Step 2. For each of the above-mentioned training configurations, the LeNet CNN is trained and the test phase classification accuracy is noted. The accuracies are summarized in for Dataset 1 and for Dataset 2. The activation values for the convolutional layers and the pooling layers are illustrated for a correctly classified and a misclassified sample in and respectively. In and , there are 20 feature maps in the first two hidden layers and 50 feature maps in the third and fourth hidden layers following the LeNet architecture illustrated in .
Table 3. Percentage accuracy for 10-fold cross-validation on Dataset 1. (Best case accuracy values are given in bold)
Table 4. Percentage accuracy for 10-fold cross-validation on Dataset 2. (Best case accuracy values are given in bold)
Figure 6. Activation values of different layers for a correctly classified sample image representing the numeral 1 belonging to Dataset 1. The output layer confidence values are also shown
Figure 7. Activation values of different layers for an incorrectly classified sample image representing the numeral 9 belonging to Dataset 1. The output layer confidence values are also shown
As is seen from and , the best case classification accuracy is quite high with 98.2% for Dataset 1 and 98.8 % for Dataset 2 which are significantly higher than the classification accuracy results obtained from Experiment 1. The misclassification however often occurs due to the inherent similarity in the visual characteristics of certain numerals. For instance, in , the Bangla numeral 1 is correctly classified but as shown in , the Bangla numeral 9 is misclassified as 1. It can be seen that the shapes of the two numerals are quite similar even from the point of view of unbiased human judgment. A few examples of such similar characters for Datasets 1 and 2 are shown in .
Figure 8. Pairs of Bangla and Hindi numerals having high structural similarity which may lead to a misclassification in the CNN
Experiment 3: Tests of Rotational Invariance
One of the most significant advantages of a CNN in the field of object recognition is its ability for partial rotational invariance. In the field of OCR of which digit recognition is a part, it is often required to develop models, which provide rotational invariance. In this experiment, we carry out extensive tests on the effectiveness of rotational invariance of a CNN when applied to images of Bangla and Hindi numerals. The experiment has three phases as follows:
Phase 1: In the first phase, we perform two tests. The first test is done by rotating a number of images in both the training and test sets by 90 degrees in the clockwise direction. The second test is carried out by rotating a number of images in both the training and test sets by 180 degrees. The number of images rotated in the training set is a small portion of the total number of training images, thereby making it difficult for the CNN to learn the parameters. The details of the first phase of this experiment are as follows:
Dataset 1 (Bangla Numerals): We divide the dataset of 6000 images into a training set of 4000 and a test set of 2000 images with the purpose of implementing a 3-fold cross-validation scheme. There are four major steps involved for Dataset 1. In the first step, we rotate 500 images in the training set and 100 images in the test set by 90 degrees in the clockwise direction. In the second step, we rotate 1000 images in the training set and 200 images in the test set by 90 degrees clockwise. The third and fourth steps are similar to the first two, the only difference being that the angle of rotation is 180 degrees instead of 90 degrees. The classification accuracies obtained for the above-mentioned tests are summarized in . We also present the confusion matrices corresponding to each of the above tests in .
Table 5. Results of rotational invariance tests (Phase 1) for Dataset 1. (Best case accuracy value is shown in bold)
Figure 9. Confusion matrices corresponding to each experimental setup of Phase 1 of the experiment on Dataset 1. Matrices (a) to (f) correspond to experiments where 500 training images and 100 test images are rotated by 90 degrees clockwise in (a)-(c) and 180 degrees in (d)-(f). Matrices (g) to (l) correspond to experiments where 1000 training images and 200 test images are rotated by 90 degrees clockwise in (g)-(i) and 180 degrees in (j)-(l)
Dataset 2 (Hindi Numerals): The dataset of 3000 images is divided into a training set of 2000 and a test set of 1000 images, for 3-fold cross-validation. We perform two steps similar to the first two steps carried out for Dataset 1. In the first step, we rotate 500 images in the training set and 100 images in the test set by an angle of 90 degrees in the clockwise direction. The second step is identical to the first except for the angle of rotation being 180 degrees. summarizes the obtained classification accuracies corresponding to each test for Dataset 2. The corresponding confusion matrices are presented in .
Table 6. Results of rotational invariance tests (Phase 1) for Dataset 2. (Best case accuracy value is shown in bold)
Figure 10. Confusion matrices corresponding to each experimental setup of Phase 1 of the experiment on Dataset 2. All the matrices correspond to experiments where 500 training images and 100 test images are rotated. In matrices (a)-(c), the angle of rotation is 90 degrees clockwise and in (d)-(f), the angle of rotation is 180 degrees
It should be noted that the training and test sets are not augmented by inserting rotated versions of images in them. Instead, a portion of the existing images are rotated with the overall number of training and test images remaining same.
With a best-case accuracy of 97% for Bangla and 94.2% for Hindi, it is quite apparent from and that the classification accuracy remains relatively high even after a large number of images in the training set have undergone a rotational transformation. The performance is, however, low compared to that obtained in Experiment 2. This can be attributed to two main reasons. First, in this experiment we perform a 3-fold cross-validation as opposed to a 10-fold cross-validation in Experiment 2. Naturally, the reduction in size of the training set could have lowered the performance of the classifier. Moreover, it may also happen that the rotated version of a certain numeral X bears a close resemblance to the non-rotated version of another numeral Y. For instance, the Bangla numeral 8, when rotated by 180 degrees looks quite like the non-rotated version of the Bangla number 7 as shown in . Such inherent similarities may have a detrimental effect on the performance of the CNN classifier.
Figure 11. Visual similarity between two images. The image to the right represents the Bangla numeral 7 and the image to the left is that of the Bangla numeral 8 rotated by 180 degrees

It is also interesting to observe the classification accuracies for the rotated images as seen from the set of confusion matrices in and . The best case accuracy for rotated numerals in Bangla is 96% and for Hindi, it is 91%. As stated before, some of the misclassified cases are due to the innate visual similarity between the shapes of different numerals. For instance, the Bangla numeral 9 has been misclassified as 1, 3 has been misclassified as both 0 and 6, 0 has been misclassified as both 3 and 5. Similarly, Hindi numerals 0 and 9 have been wrongly classified as 8 and 1, respectively. However, even with a relatively small number of training samples, the classification performance on rotated images is quite high. In the next phase of the experiment, we introduce a mixture of images rotated by large angles in both training and test images to check classification performance in such scenarios.
Phase 2: The second phase of the experiment is similar to the first phase except for the fact that among the images rotated in both the training and test sets, half of the images are rotated by 90 degrees clockwise and the other half by 180 degrees. Dataset 1 is divided into a training set of 4000 images and a test set of 2000 images. A total of 1000 images in the training set are rotated out of which 500 images are rotated by 90 degrees clockwise and the other 500, by 180 degrees. In the test set, we randomly choose 200 images and rotate half of them by 90 degrees clockwise and the other half by 180 degrees.
We divide Dataset 2 into a training set of 2000 images and a test set of 1000 images. A total of 500 images in the training set are selected out of which 250 images are rotated by 90 degrees clockwise and the other 250 are rotated by 180 degrees. In the test set, we select 100 images and rotate 50 of them by 90 degrees in the clockwise direction and the other 50 by 180 degrees. For both the datasets, we implement a 3-fold cross-validation. The results for Dataset 1 and Dataset 2 are presented in and respectively and the corresponding confusion matrices are illustrated in and respectively.
Table 7. Results of rotational invariance tests (Phase 2) for Dataset 1. (Best case accuracy value is shown in bold)
Table 8. Results of rotational invariance tests (Phase 2) for Dataset 2. (Best case accuracy value is shown in bold)
Figure 12. Confusion matrices corresponding to each experimental setup of Phase 2 of the experiment on Dataset 1. Each setup involves clockwise rotation of 1000 images in the training set (500 rotated by 90 degrees and 500 rotated by 180 degrees) and 200 images in the test set (100 images rotated by 90 degrees and 100 images by 180 degrees)
Figure 13. Confusion matrices corresponding to each experimental setup of Phase 2 of the experiment on Dataset 2. Each setup involves clockwise rotation of 500 images in the training set (250 rotated by 90 degrees and 250 rotated by 180 degrees) and 100 images in the test set (50 images rotated by 90 degrees and 50 images by 180 degrees)
As seen from and , insertion of images rotated by multiple distinct angles in a training set does lead to an overall deterioration in performance. The primary reason behind this is the presence of visually different training images labeled to the same pattern class. Clearly, in such a scenario, the learning of visual features and motifs becomes rather difficult. However, the best-case classification accuracy for the rotated images is 92.5% for Bangla and 93% for Hindi. This indicates the robustness of the CNN architecture to rotational transformation in general. It can thus be concluded from Phases 1 and 2 of the experiment that the introduction of rotated images in the training set for a CNN, can lead to a satisfactory level of performance even for very large angles of rotation. In the next phase, we test the extent of rotational invariance provided by the LeNet CNN when trained without rotated images.
Phase 3: In the third phase of the experiment, we do not rotate any image in the training set. However, we rotate a certain number of images in the test set by 30 degrees clockwise in the first test and by 45 degrees clockwise in the second test. Given that there are no rotated images in the training set, these tests approximate the amount of rotation that can be induced in a given image provided that there remains a high chance for it to be correctly classified.
In this phase, there are two main steps performed for both Datasets 1 and 2. First, the datasets are divided into a training set and a test set in the ratio of 2:1 for the purpose of 3-fold cross-validation. Next, we rotate 100 images in the test set by 30 degrees clockwise in the first step and by 45 degrees clockwise in the second step. The results of this experiment are shown in and for Datasets 1 and 2, respectively and the related confusion matrices are presented in and respectively.
Table 9. Results of rotational invariance tests (Phase 3) for Dataset 1. (Best case accuracy value is shown in bold)
Table 10. Results of rotational invariance tests (Phase 3) for Dataset 2. (Best case accuracy value is shown in bold)
Figure 14. Confusion matrices corresponding to each experimental setup of Phase 3 of the experiment on Dataset 1. In all cases, a total of 100 test images are rotated clockwise by 30 degrees in (a), (b) and (c) and 45 degrees in (d), (e) and (f)
Figure 15. Confusion matrices corresponding to each experimental setup of Phase 3 of the experiment on Dataset 2. In all cases, a total of 100 test images are rotated clockwise by 30 degrees in (a), (b) and (c) and 45 degrees in (d), (e) and (f)
The confusion matrices convey a few interesting observations. If we factor in the complete absence of transformed images in the training set, the classification performance on rotated test images is quite satisfactory with a best case accuracy of 87% for Bangla numerals and 88% for Hindi numerals, where both of the best case scenarios occur when the angle of rotation is 30 degrees clockwise for test images. However, the experimental runs with test images rotated by 45 degrees clockwise indicate a lower performance with best case classification accuracy being 78% for Bangla numerals and 79% for Hindi numerals. The reasons behind these results are primarily two-fold. Firstly, rotation of an image by relatively low angles does not change its constituent visual features beyond the recognition capacity for a CNN. Since the features are successfully detected and the location of visual features with respect to one another remains almost the same even after rotation, a CNN can effectively recognize the image. However, in case of large angles of rotation, the individual features themselves become distorted enough to not be correctly recognized by the feature maps in a CNN, thereby leading to a concomitant decrease in classification accuracy. This is clearly reflected in the results obtained from Phase 3 of our experiment. We can conclude that the rotation of images by a maximum of approximately 30 degrees does not reduce the classification accuracy of a CNN below satisfactory levels. In , we present a comparative overview of the best-case performance of various zone or region-based handcrafted feature extraction and classification mechanisms with that of our proposed approach of CNN classifiers for the task of classifying Bangla numerals. Due to the unavailability of significant works on Hindi handwritten numeral classification, we could not provide the comparative study on the same.
Table 11. Comparative overview of various region based handcrafted feature extraction and classification methods with proposed approach on Dataset 1
Conclusions
In this paper, we have demonstrated the use of CNNs for the classification of handwritten digits in Bangla and Hindi scripts. CNNs provide a compact architecture which, by the virtue of its design, automates the extraction of spatially localized visual features. The relative locations of each detected feature provides the discriminatory information used to differentiate among image classes or pattern classes.
Extensive experiments carried out on standard datasets indicate that the CNN can outperform most of the traditional classifiers. The experimental results yield a best case classification accuracy of 98.2% for Bangla and 98.8% for Hindi which are significantly better than most of the existing models in the literature. It is also observed that a satisfactory amount of invariance to rotation for large angles can be obtained by inserting a relatively small number of rotated images in the training set. Furthermore, the CNN can properly classify most images rotated by angles of approximately 30 degrees without needing any rotated images in its training set. We also noted that quite a few of the misclassifications were due to the inherent visual similarity between the actual pattern class and the classified pattern class.
Our experiments provide conclusive evidence of the usefulness and efficacy of CNNs for the recognition of handwritten digits in Bangla and Hindi. In the future, we intend to remodel the architecture of the CNN for handling images rotated by large angles without any prior training on such rotated images.
References
- Antipov, G., S. A. Berrani, and J. L. Dugelay. 2016. Minimalistic CNN-based ensemble model for gender prediction from face images. Pattern Recognition Letters 70:59–65. doi:10.1016/j.patrec.2015.11.011.
- Basu, S., N. Das, R. Sarkar, M. Kundu, M. Nasipuri, and D. K. Basu. 2005a. An MLP based approach for recognition of handwritten ‘Bangla’ numerals. In B. Prasad (Ed.), 2nd Indian International Conference on Artificial Intelligence, Pune, India, 407–17.
- Basu, S., R. Sarkar, N. Das, M. Kundu, M. Nasipuri, and D. K. Basu. 2005b. Handwritten Bangla digit recognition using classifier combination through DS technique. In Pattern recognition and machine intelligence, ed. S. Pal, S. Bandyopadhyay, and S. Biswas, 236–41. Berlin/Heidelberg: Springer.
- Basu, S., N. Das, R. Sarkar, M. Kundu, M. Nasipuri, and D. K. Basu. 2009b. Recognition of numeric postal codes from multi-script postal address blocks. In Pattern recognition and machine intelligence, ed. S. Chaudhury, S. Mitra, C. Murthy, P. Sastry, and S. Pal, 381–86. Berlin/Heidelberg: Springer.
- Basu, S., M. Kundu, M. Nasipuri, and D. K. Basu. 2006. A two-pass fuzzy-geno approach to pattern classification. In International Conference on Computer Processing of Bangla, Dhaka, Bangladesh, 130–34.
- Basu, S., N. Das, R. Sarkar, M. Kundu, M. Nasipuri, and D. K. Basu. 2009a. A hierarchical approach to recognition of handwritten Bangla characters. Pattern Recognition 42 (7):1467–84. doi:10.1016/j.patcog.2009.01.008.
- Basu, S., N. Das, R. Sarkar, M. Kundu, M. Nasipuri, and D. K. Basu. 2010. A novel framework for automatic sorting of postal documents with multi-script address blocks. Pattern Recognition 43 (10):3507–21. doi:10.1016/j.patcog.2010.05.018.
- Cao, J., M. Ahmadi, and M. Shridhar. 1995. Recognition of handwritten numerals with multiple feature and multistage classifier. Pattern Recognition 28 (2):153–60. doi:10.1016/0031-3203(94)00094-3.
- Cecotti, H. 2011. A time-frequency convolutional neural network for the offline classification of steady-state visual evoked potential responses. Pattern Recognition Letters 32 (8):1145–53. doi:10.1016/j.patrec.2011.02.022.
- Cheriet, M., H. Bunke, J. Hu, F. Kimura, and C. Y. Suen. 2009. New frontiers in handwriting recognition. Pattern Recognition 42 (12):3129–30. doi:10.1016/j.patcog.2009.03.013.
- CMATER Dataset. https://code.google.com/archive/p/cmaterdb/downloads
- Das, N., B. Mandal, S. Basu, R. Sarkar, M. Kundu, and M. Nasipuri. 2009. An SVM-MLP classifier combination scheme for recognition of handwritten Bangla digits. In 2nd international conference on advances in computer vision and information technology, ed. K. V. Kale, S. C. Malhrota, and R. R. Manza., vol. I, 615–23. Aurangabad, India: K. International Publishing House Pvt. Ltd.
- Das, N., J. M. Reddy, R. Sarkar, S. Basu, M. Kundu, M. Nasipuri, and D. K. Basu. 2012a. A statistical-topological feature combination for recognition of handwritten numerals. Applied Soft Computing 12 (8):2486–95. doi:10.1016/j.asoc.2012.03.039.
- Das, N., R. Sarkar, S. Basu, M. Kundu, M. Nasipuri, and D. K. Basu. 2012b. A genetic algorithm based region sampling for selection of local features in handwritten digit recognition application. Applied Soft Computing 12 (5):1592–606. doi:10.1016/j.asoc.2011.11.030.
- Das, N., S. Basu, R. Sarkar, M. Kundu, M. Nasipuri, and D. K. Basu. 2007. A soft computing paradigm for handwritten digit recognition with application to Bangla digits. In International Conference on Modeling and Simulation, MS-07, Kolkata, India, 771–74.
- Jia, Y. 2013. Caffe: An open source convolutional architecture for fast feature embedding, http://caffe.berkeleyvision.org/.
- Lawrence, S., C. L. Giles, A. C. Tsoi, and A. D. Back. 1997. Face recognition: A convolutional neural-network approach. IEEE Transactions on Neural Networks 8 (1):98–113. doi:10.1109/72.554195.
- LeCun, Y., B. Boser, J. S. Denker, D. Henderson, R. E. Howard, W. Hubbard, and L. D. Jackel. 1989. Backpropagation applied to handwritten zip code recognition. Neural Computation 1 (4):541–51. doi:10.1162/neco.1989.1.4.541.
- LeCun, Y., L. Bottou, Y. Bengio, and P. Haffner. 1998. Gradient-based learning applied to document recognition. Proceedings of the IEEE 86 (11):2278–324. doi:10.1109/5.726791.
- LeCun, Y., and Y. Bengio. 1995. Convolutional networks for images, speech, and time series. In The handbook of brain theory and neural networks, ed. M. A. Arbib, 255–58. Cambridge, MA: MIT Press.
- Lee, C. Y., S. Xie, P. Gallagher, Z. Zhang, and Z. Tu. 2015. Deeply-supervised nets. Artificial Intelligence and Statistics 562–70.
- Park, J., V. Govindaraju, and S. N. Srihari. 2000. OCR in a hierarchical feature space. IEEE Transactions on Pattern Analysis and Machine Intelligence 22 (4):400–07. doi:10.1109/34.845383.
- Perlin, H. A., and H. S. Lopes. 2015. Extracting human attributes using a convolutional neural network approach. Pattern Recognition Letters 68:250–59. doi:10.1016/j.patrec.2015.07.012.
- Rajashekararadhya, S. V., and P. V. Ranjan. 2008. Efficient zone based feature extraction algorithm for handwritten numeral recognition of four popular South Indian scripts. Journal of Theoretical and Applied Information Technology 4:1171–81.
- Scherer, D., A. Muller, and S. Behnke. 2010. Evaluation of pooling operations in convolutional architectures for object recognition. International Conference on Artificial Neural Networks. Berlin, Heidelberg: Springer.
- Schmidhuber, J. 2015. Deep learning in neural networks: An overview. Elsevier Neural Networks 61:85–117. doi:10.1016/j.neunet.2014.09.003.
- Zhu, S., Z. Shi, C. Sun, and S. Shen. 2015. Deep neural network based image annotation. Pattern Recognition Letters 65:103–08. doi:10.1016/j.patrec.2015.07.037.