
ABSTRACT
The lifecycle of COVID-19 pandemic curves requires timely decisions to protect public health while minimizing the impact to global economy. New models are necessary to predict the effect of mobility suppression/reactivation decisions at a global scale. This research presents an approach to understand such tensions by modeling air travel restrictions during the new coronavirus outbreak. The paper begins with an updated review on the impact of air mobility in infectious disease progression, followed by the adoption of complex networks based on semi-supervised statistical learning. The model can be used to (1) determine the early identification of infectious disease spread via air travel and (2) align the need to keep the economy working with open connections and the different dynamic of national pandemic curves. The approach takes advantage of open data and machine self-supervised statistical learning to develop knowledge networks visualization. Test cases using Hong Kong and Wuhan aerial mobility are discussed in the decisions to (1) restrict and (2) increase mobility. The approach may also be of governments use in their international cooperation policy and commercial companies that need to choose how to prioritize the re-opening of international trade routes.
Introduction
The new coronavirus SARS-COV-2 and its associated disease (COVID-19) have increasingly become one of the most important research topics in intelligent systems. The pandemic officially declared on 30th January 2020 is not comparable to any other event in the previous decades, mobilizing academy and industry in search of new solutions.
The growing body of knowledge started in medicine and public health, for example, by identifying the association of mortality and national healthcare systems (Ji et al. Citation2020), the preparation of countries to deal with the phenomena (Gilbert et al. Citation2020), or the significant under detection that affected existing models and statistics worldwide (Rene Niehus, De Salazar, and Taylor Citation2020). Another line of research aimed to identify the origins of the pandemic propagation in each location. For example, associating the two initial cases in Italy with Chinese tourists (Giovanetti et al. Citation2020) and proving the impact of air travels on viral propagation.
It is now clear that understanding and dealing with COVID-19 pandemic goes beyond the clinical practice and healthcare resources, in fact, the “impact of pandemics is beyond imagination and not limited to the loss of human lives but can threaten the economic stability and existence of affected countries” (Bobdey and Ray Citation2020). It is now crucial to create decision support models to prevent or control the evolution of virus propagation and, simultaneously, provide evidence on the significant interdependence between economic mobility and pandemic control. New models are needed to deal with hypermobility and its notable effect on disease spread and management during a pandemic (Musselwhite, Avineri, and Susilo Citation2020). Artificial intelligence (AI) is a very powerful tool to include in the toolbox and the examples are vast, including predicting the location of future outbreaks, generating new molecules, “understanding of transmissibility and risk populations; establishing the natural history of infection, including incubation period and mortality rate; identifying and characterizing the causative organism; and, in some instances, epidemiological modeling to suggest effective prevention and control measures” (McCall Citation2020).
How can open data related to air mobility be used to semantically evaluate virus propagation and assist with economic decisions? This is the fundamental question upon which this paper has written – one that leads us to reevaluate existing literature on the topic and propose a complex network assessment on air mobility using open-access data. User-friendliness to non-experts and the capacity to provide quick results with few amounts of data are essential ingredients for success.
The remaining structure of this paper is presented as follows: The subsequent section presents background literature related to the link between air travel and virus spread. The review includes AI models already proposed to deal with the phenomena and the existing opportunities to extend existing work. Next, the design science research method is explained (Hevner et al. Citation2004; Peffers et al. Citation2007), followed by the model design and development. Afterward, the results are evaluated using open data of airline travel within Wuhan and Hong Kong followed by design guidelines for future model developments. In closing, notable conclusions, limitations, and opportunities for future research are discussed.
Background
Pandemic Progression: Establishing the Air Mobility Link
Travelers Give Wings to Novel Coronavirus (2019-nCoV) is the title of the paper authored by Wilson and Chen (Citation2020) revealing a deadly combination of intense air traffic and high infectious disease vulnerability index (IDVI). Therefore, heavy air travel restrictions have been imposed to mitigate virus transmission, as presented in .
Figure 1. Global Impact of travel restrictions (27Jan-25 April, source: Flightradar)
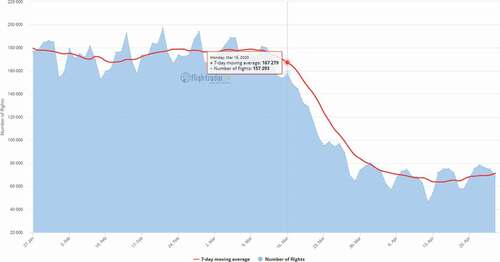
Air travel data provides evidence of the significance interdependence of political and corporate decisions. At the same time, aggregating this source of data “can help refine interventions by providing near real time information about changes in patterns of human movement” (Buckee et al. Citation2020). For example, Bogoch et al. (Citation2020) analyzed data obtained from the International Air Transport Association (IATA) and found a high number of passengers traveling from top Chinese airports to Taipei (1 359 253), Bangkok (1 232 307), or Tokyo (1 086) showing a interdependence between air travel from China to several neighboring countries with a high IDVI, such as Thailand and Japan. Both, import and export cases of infected travelers must be taken into consideration in travel restrictions, as illustrated in .
Figure 2. Impact of travel restrictions to China (30Dec-23 March, source: Flightradar)
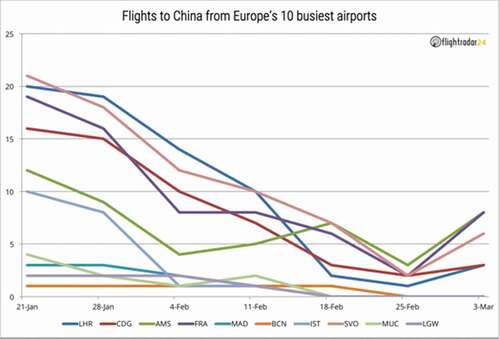
shows a steady decrease in departures from Europe’s top 10 busiest airports to China. The chart also reveals a turning point, which must be carefully managed to avoid a secondary wave of COVID-19 infections. Applied artificial intelligence models can assist decision-making when a reduction or cancellation of flights are necessary and when a recovery is essential to the survival of the global economy during the management of a pandemic (depending on region), whilst also maintaining sufficient health care (Ji et al. Citation2020) and limiting economic damage. Balancing health-care resources (e.g., beds available for intensive care) and economic sustainability (reopening the economy with acceptable levels of virus propagation over time) is the intelligent systems fundamental question, until a safe and effective vaccine or treatment appears. Moreover, a new virus will surely appear in the future, making AI-based models a necessity for the present and future of global economies.
What We Should Know Already
The first SARS (severe acute respiratory syndrome) was discovered in China (Guangdong) by late 2002. The virus revealed a longer incubation period when compared to the well-known influenza virus (sometimes 14 days) and symptoms that last for 10 to 15 days. Several tests have shown a relation between the virus and weather variations (temperature) (Tan et al. Citation2005), later confirmed by the work of Brenner, Marwan, and Hoffmann (Citation2017) using network structures, and Rees et al. (Citation2019) for risk assessment strategies. These results are not yet conclusive for the recent SARS-COV2, but there are also other similar aspects, for example, Low and McGeer (Citation2003) stated that “the disease is milder in children than in adults, and the viral load and the degree of infectivity in children also appear to be lower.” The authors pointed to many cases of transmissions in hospitals and the challenge of early detection in case of reoccurring, since “it may be easy to transport this virus from a wild animal sold in a market in one country to humans in another country” (Low and McGeer Citation2003).
The first cases of SARS in France are reported in Desenclos, J-C. et al. (Citation2004.) demonstrating the relation with an Hanoi-Paris flight in March 2003. Consequently, a close collaboration between health entities and airline companies was suggested over 15 years ago (Breugelmans et al. Citation2004).
Other types of viruses are also candidates for air transmission, for example, Dengue and the most common H1N1. Artificial intelligence was also applied in these cases, as happened with Salami (Citation2020) using machine learning to predict an importation of Dengue cases to Europe, while Chang et al. (Citation2010) found that “a solid relationship between H1N1 and air travel exists, and predictions could be made based on these findings.” A model for H1N1 spreading using three data inputs (demographic, air mobility, and epidemic) was also proposed, supporting its feasibility to forecast and perform scenario analysis of major outbreaks (Tizzoni et al. Citation2012). Recently, population dynamics have played an important role in disease intervention strategies (Wang and Li Citation2014). However, studies have also found partial mobility restrictions to be of limited effect when considering the time necessary to develop a vaccine, with a delay of only a few weeks in the virus propagation (Chang et al. Citation2010).
Airline traffic data was used in the past SARS pandemic. For example, Bowen and Laroe (Citation2006) concluded “that airline network accessibility was an especially influential variable but also that the importance of this variable diminished in the latter weeks of the outbreak.” Interestingly, Marcelino and Kaiser (Citation2009) suggest that flight cancelation can be more efficient than shutting down an entire airport, therefore, new models are necessary to identify priorities for balancing air traffic and pandemic progressions, according to the characteristics of each connection. Moreover, long-range traffic is responsible for global spreading of infectious diseases but there are also local conditions that need a detailed level of analysis, namely, the case of subpopulations near the main hubs (Balcan et al. Citation2009).
Some regions may exhibit a delayed reaction, warned since 2003 that “the diffusion of SARS into the interior of China was less rapid than its spread overseas … [and that] the propensity for infected persons to exhibit symptoms only some days after infection, made even infrared thermal screening at airports relatively ineffective” (Bowen and Laroe Citation2006). Nevertheless, the most important is to learn from the errors of the past and improve decision-making in real-life complex problems.
Airports and Air Travel in Pandemic Management
The impact of disruptions in airport operation vary in different regions of the globe. The recent study presented by Sun, Wandelt, and Zhang (Citation2020) shows precisely those differences using network science in open access data. In some cases, closing an airport has less effect if the passengers are able to use tools (online or otherwise) to identify alternative airports, particularly in the United States, China, and European countries more affected by the new coronavirus. Understanding its importance in mitigating virus spread, many airports integrated screening technologies, however, “46% (95% confidence interval: 36 to 58) of infected travellers would not be detected, depending on incubation period, sensitivity of exit and entry screening, and proportion of asymptomatic cases” (Quilty, Clifford, and Eggo Citation2020). Moreover, these authors concluded that the world “was ill-prepared to mitigate the diffusion of SARS via international air transport.” Information evolves side by side with mobility strategies to contain epidemic spreading (Wang, Han, and Tanaka Citation2017).
Several studies addressed the spreading of infectious diseases and air travel in the 2 years preceding COVID-19 (between 2018 and 2019), five are highlighted. Two reviews, one presented by Findlater and Bogoch (Citation2018) illustrating how rapid movement around the globe facilitate epidemics in different viruses (e.g., Zika, SARS, Dengue) and the other by Desai et al. (Citation2019) evidencing the role of forecasting methodologies and the importance of data in outbreak events. Unfortunately, most of the aviation data is not public, having implications in reproducibility and extension of the use of these models in global disasters faced today (Li and Ryerson Citation2019; Meslé et al. Citation2019).
Aggregating data about human mobility can help in this fight but it is also necessary to ensure the protection of individual rights and balance the different interests involved (Buckee et al. Citation2020). Moreover, strengthening air routes to locations with higher levels of infection, lower healthcare resource availability, and high vulnerability indexes of infectious diseases, must be avoided (Gilbert et al. Citation2020; Ji et al. Citation2020).
Mobility in the COVID-19 Era: A Review of Recent Contributions
Several recent studies addressed the virus spread via air (Craig, Heywood, and Hall Citation2020; Gilbert et al. Citation2020; Li et al. Citation2020) and the most unanimous conclusion is that “the virus can fly” with the wings provided by human travelers (Wilson and Chen Citation2020). The risk of the novel coronavirus transmission from China “was highest to neighbouring countries in Asia (Thailand, Cambodia, Malaysia), followed by Europe (UK, France, Russia and Germany), Oceania (Australia and New Zealand) and North America (USA and Canada)” (Haider et al. Citation2020).
Travel restrictions are important but are not the only solution and must be carefully managed over time (Aleta et al. Citation2020). For example, the model presented by Chinazzi et al. (Citation2020) reveals that travel restrictions have more effect in the initial weeks. Therefore, the “decision to control travel volume through restrictions on freedom of movement should be balanced between the resulting estimated epidemiological impact and predicted economic fallout“ (Anzai et al. Citation2020). Considering the undetected cases that may reach two-thirds of the cases imported from China (Bhatia et al. Citation2020) and the undetected travelers (Chinazzi et al. Citation2020), it is also possible that the import/export scenarios identified in recent studies do not consider these variables. Therefore, restrictions on international flights should be combined with other measures (Chinazzi et al. Citation2020) such as the testing and isolation of cases, “and social distancing with at least 80%–90% compliance and a duration of 91 days (13 weeks)” (S. L. Chang et al. Citation2020).
Recent models have been proposed to identify the risk of spreading the COVID-19 disease. For example, Craig, Heywood, and Hall (Citation2020) to the pacific islands; the high risk in the United States based on Wuhan direct flights (Li et al. Citation2020); and the prevision of lower risks in Africa and South America regions (Haider et al. Citation2020). The work of Lai et al. (Citation2020) proposes a comprehensive model to identify risks of importing the virus from Wuhan and other main cities in China. Using inter-city mobility data from 2019, Wu, Leung, and Leung (Citation2020) also presents a model to evaluate the current and future evolution of the disease. The methodology used by Nikolaou and Dimitriou (Citation2020) to identify critical European airports for controlling the spread of infectious diseases adopts several centrality metrics (e.g., betweenness and closeness) and stress-test scenarios, strengthening the evidence about the crucial role of air mobility in pandemic control.
There are important studies using mathematical models to predict virus transmission patterns based on air mobility, uncovering the potential of social sensing of transport data to deal with disruptive events (Yu et al. Citation2020). However, most of these models require a significant amount of data to predict the development of the pandemics (Bai et al. Citation2020).
More recently, Prasse et al. (Citation2020) used a complex network approach to model the epidemic in Hubei province using traffic data, suggesting, at a local scale, “that network-based modelling is beneficial for an accurate forecast of the epidemic outbreak.” A different example of using complex networks (not related with mobility data but revealing the potential of the approach) is presented by Luczak-Roesch (Citation2020) to identify clusters of viral genetic spread.
However, few models reveal the possibility to evolve and learn with new data to assist decision makers when trying to limit virus transmission (imposing chirurgical restrictions as situation evolves) or reopening crucial trade routes to ensure economic survival. Machine learning techniques are included in the vast portfolio of AI solutions that do not require specific instructions to perform a task, as shown in the context of outbreak response by Rees et al. (Citation2019) or Salami (Citation2020) addressing Dengue. Moreover, there is an opportunity and a vital necessity to test simplified methods for initial assessment of COVID-19 related decisions using reliable, but unfortunately, sometimes limited open access data.
Methods
Design science research (DSR) is the selected approach. Having its foundations in the work of Simon (Citation1996), the research evolves according to seven key guidelines with the purpose to create a viable artifact (a model in this research) that is both relevant and rigorously created (Peffers et al. Citation2007) suggests specific activities for DSR starting with the problem definition and the complete understanding of the context, followed by the definition of solution objectives.
Afterward, researchers must design and develop the proposed solutions, demonstrate results, whilst also evaluating and communicating any findings (Hevner et al. Citation2004; Peffers et al. Citation2007). DSR was considered suitable for our purpose to use complex network toolbox in machine learning algorithms that use air traffic (open) data to identify patterns and support the decisions about restricted mobility. The next subsection presents the foundations of complex networks and self-supervised statistical learning used in the design and development stages of DSR (Peffers et al. Citation2007).
Machine Self-supervised Statistical Learning for Knowledge Model Generation
There is an interdependence between technology, work, and organizations – this is something uniquely visible today with the “work from home” adoption in response to the COVID-19 lockdown. The study of interdependence grounds on socio-technical complex adaptive systems (CAS) (Vespignani Citation2009) and describes systems acting together as an entanglement acquiring its form and attributes only from the evolving interdependence. CAS are complex systems where criticality lies not with the number of its parts but on the capabilities to develop adaptability. This adaptability happens in an emergent and self-organizing behavior within a self-supervised learning process (Sermanet et al. Citation2017). Modeling such a sociometrical complex system comprises of the capability to learn from data within the same system (self data) and to model and visualize its significant interdependences. Networks are a key part of the solution to address this problem (Mitchell Citation2006). A complex network is a system of connected (linked) elements (nodes) that allows “true predictive power of the behaviour of techno-social systems” (Vespignani Citation2009).
Machine learning is the tool of choice to learn from data (Ghahramani Citation2015). However, socio-technical CAS has characteristics that are difficult to handle with a machine learning normalized approach of training and validation, as happens with the case of deep learning (Chen and Liu Citation2016). Hence, we introduce a machine self-supervised statistical learning algorithm to approach the use of system own data, to perform statistical learning relying on data abstractions and its visualization as models of semantic knowledge.
Modeling COVID-19 Wings with Open Data
The approach that we used in this research develops in three stages represented in .
Figure 3. The machine self-supervised statistical learning architecture
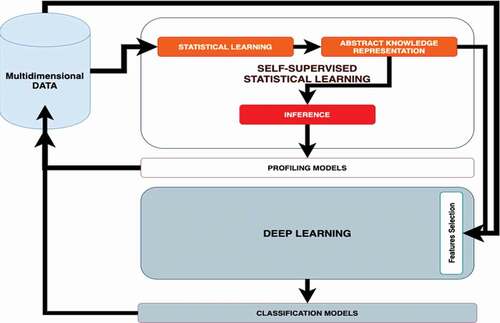
The machine self-supervised statistical learning stage addresses the learning uncertainty and reasoning using statistical learning. Also, within this stage, abstract semantic knowledge representation and inference to develop a profiling model of the mobility context. This approach extends the capability of features selection used in deep learning (Lecun, Bengio, and Hinton Citation2015). The statistical learning stage starts with the data ETL to develop data abstractions as pair of connected nodes (adjacency list). The adjacency list is then modeled through complex network tool in an abstract knowledge representation at the next stage, resulting in a semantic network representing the self-data emergent and self-organized knowledge. The node significance is determined through betweenness (the bigger the node more significant it is) (Albert, Jeong, and Barabási Citation1999; Newman Citation2001; Newman, Barabási, and Watts Citation2006; Pincus Citation1991) and communities – the colors represented in the semantic networks represent different communities, defining nodes with more commonalities. The interdependence is modeled by measuring the weight of each connected (linked) pair of nodes (the thicker the line more significant it is) and the node size determines its significance as a measure of betweenness (the bigger the node, more interdependent it is). The communities’ aggregate nodes are part of the same pattern.
Finally, on the last stage, it produces inference by measuring entropy (Pincus Citation1991) to determine the level of system change. Information entropy can be used to measure real-world complex data, with the advantage of low computational necessities and the possibility to adopt the algorithms in large networks (Guo et al. Citation2020).
The data used in the self-supervised learning process were collected from public data sources – namely, Wikipedia and research data available from scientific papers. The data sources that will be referenced when discussing the models and results are publicly available .
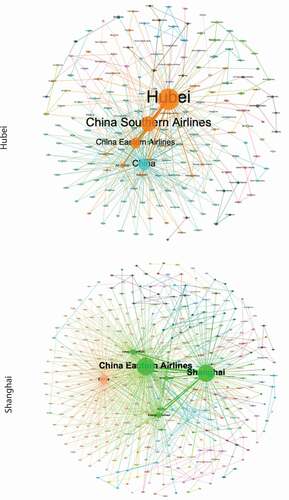
The semantic network shows the nodes that are more significant to develop Hubei connectivity, revealing more interdependence (thickness of the line between the two nodes) with China Southern Airlines (see – Hubei). – Shanghai, points to a prevalent significance on China Eastern Airlines node and also the higher interdependence. These initial models were used to test the proposed approach and are useful to identify the companies with higher impact in pandemic management in each of the regions. However, DSR requires a deeper evaluation of the approach with other sources of data, as we present in the next section.
Figure 4. Aerial connectivity modeled from data collected from Wikipedia on 21st March 2020
Evaluation of the Model
We adopted the guidelines suggested by the FEDS framework to evaluate design science research projects (Venable, Pries-Heje, and Baskerville Citation2016), requiring to identify the goals of the evaluation, the strategy, and the properties to evaluate. The main goals are to test the approach using data available in other sources, contrasting the findings with the authors conclusions (e.g., the work of Zhao et al. (Citation2020)) and with the public available data of pandemic evolution over time (e.g., Hong Kong). The selected strategy is the technical risk and efficacy (Venable, Pries-Heje, and Baskerville Citation2016), relevant to understand “whether a specific technology may work as perceived in the design” (Venable, Pries-Heje, and Baskerville Citation2016).
Finally, the properties selected for evaluation were the mobility index (World Economic Forum Citation2020) and the mobility patterns in pandemic progression (). The data used in the models of was published by Zhao et al. (Citation2020).
Figure 5. Modeling China mobility index
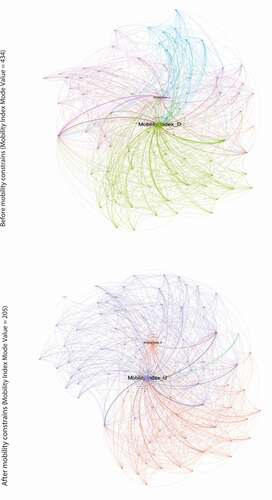
The measures adopted to constrain the flights reduced the mobility index mode value by more than 50% () with an effect on the node significance quantified in –1 and –2. quantifies the effect of flights constrains on the interdependence and significance of the semantic models of .
Figure 6. Measurements of betweenness and entropy to model the significance and interdependence of change. The labels on 1 and 2 represent the mobility index and the associated cities
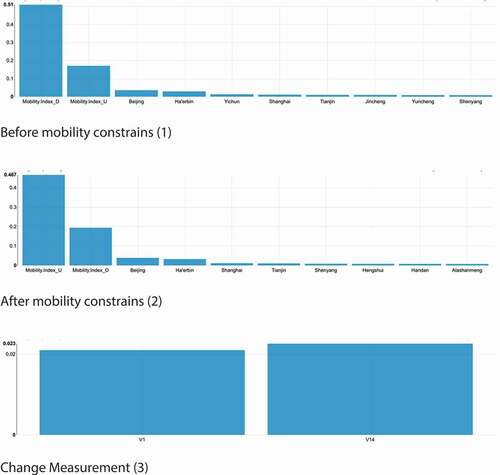
Before a reduction in airline travel, the node Mobility.Index_D (0.51) (–1) was the most significant but, after the introduction of travel constrains it changed to Mobility.Index_U (0.467) (–2). These constrains changed the mobility index of cities – something that was expected as the constrain goal was to change it and that is visible on different labels on –1 and –2. The quantification of the nodes allows us to identify that a reduction in flights had a higher effect on less connected nodes, while Beijing, Ha’erbin and Shanghai proportionally maintained the same level of mobility. Harbin (Ha’erbin) arose in March 2020 as a new focus of the disease, although it is not possible to conclude a causality effect. The main conclusion is the effectiveness of air mobility restrictions and patterns of mobility that deserve more attention from the public authorities.
–3 quantifies the effect of the air travel constrains by measuring the entropy on the semantic knowledge network – here we can observe an increase of 0,003. In the second evaluation case, Hong Kong data was selected due to the high connectivity with Beijing and Shanghai – cities with prevalent mobility index in previous models ().
Figure 7. Hong Kong air connectivity modeled considering the closeness and the betweenness (Node “1” refers to Hong Kong; strong connectivity identified to London; source dataset: Department of Health (Citation2020)
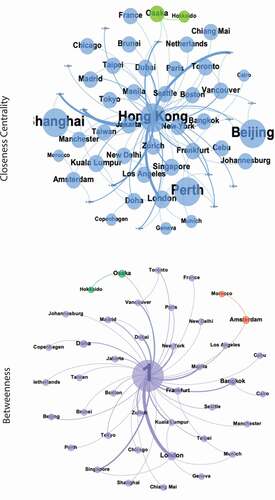
Hong Kong connectiveness is described by closeness centrality. The emergent nodes are known places of early disease outbreaks, namely Shanghai, Beijing, Perth (Australia). However, closeness and betweenness are not sufficient to provide a comprehensive vision of airline mobility because there are multiple hubs and connection points between two cities. This effect is visible in describing the interdependence for the 10 pairs of nodes with the highest connectivity (interdependence – measured as the weight of each connectivity).
Table 1. The interdependence results for the Hong Kong node (source: (https://www.chp.gov.hk/files/misc/)
The results presented in are complementary to the previous model and consistent with what is currently known about the disease spreading. London emerges with the higher level of interdependence (22).
Discussion
Managing COVID-19 progression relies on the capability to understand human connectivity. Forecasting and modeling connectivity becomes an essential risk assessment model that is useful to mitigate the effect of new outbreaks (quick warnings and traveling restrictions to the most relevant nodes, particularly those with lower margin to absorb the impact of more transmissions in its pandemic curve) and evaluate indirect transmissions chains (). For example, we can observe in that closing all connections between Wuhan and Europe would not be sufficient to contain the transmission and could even provide a false sense of security.
Implementing machine self-supervised statistical learning provided us with a way to develop models from different types of data. This capability led us to produce semantic knowledge, representing emerging and self-organizing complex adaptive systems, further allowing the development and inference of intelligent systems. Lastly, during evaluation, a correlation was found between the model connections showing locations of major possible COVID-19 hotspots and emergent outbreaks in the world.
Our results suggest that this approach can support learning from different data sets and may be used as a tool to make better informed decisions related to travel restrictions during a pandemic scenario.
reveals connectivity and viral propagation risk through flights from Hubei and Shanghai, which supports previous research in this area (Zhao et al. Citation2020). The results from models in and quantified in define the understanding of mobility and its central role in any decisions made during lockdowns discussed by Kraemer et al. (Citation2020) and provide evidence for the implantation of any travel restrictions. can provide more details to understand possible new focus of infection in China.
shows the flow for the progression of the disease and is consistent with the knowledge described in Wilson and Chen (Citation2020), Rodríguez-Morales et al. (Citation2020), and Li et al. (Citation2020), supporting the timeline of the outbreaks occurring in Canada, US, and UK where the coronavirus had arrived earlier than detected and propagated without control as much of the carriers were asymptomatic.
Existing lockdown strategies are temporary measures to prevent health-care systems from being overwhelmed and flatten pandemic curves. Lockdowns are constantly reviewed, and our model provides evidence and learning to support these important strategic decisions.
Once restrictions start to ease and movement of people increases, it would be beneficial if relevant compiled information was released, such as information from mobile networks. This information could then be overlaid with models of symptom progression and intensive care capacity, to assist with risk assessment planning for future health-care needs. Our modeling technics have a similar background to those used by other researchers working on the identification of virus biological dynamics. Common self-supervised machine learning relies on previous classified knowledge and a modeling distributed by training and validation even when using advanced tools as deep learning networks (Lecun, Bengio, and Hinton Citation2015). Our proposed approach to machine learning expands the self-supervising machine learning capability by developing a statistical learning approach from the systems data through the use of complex networks as a semantic knowledge network capable to be measured by entropy. It follows the path of creating self-supervising learning approach that is efficient for generalizing (Zhang et al. Citation2016).
Study Limitations
The development of new models to address the challenges of pandemic events is a societal priority. However, several limitations must be considered.
First, our approach uses open data, which is an advantage for availability but also raises more concerns about its quality. The proposed models must be interpreted as a rough calculation to assist in the early evaluation of travel decisions.
Second, the models only consider the dimension of mobility using direct flight data from China. In this case, the advantage of model simplicity must be balanced with other factors that we did not include, for example, social proximity, and other local initiatives.
Third, air mobility is particularly relevant for the initial stages of an outbreak (or to the later stages of reopening the economy). Therefore, the proposed approach is not a complete solution to the problem and must be complemented with other techniques to provide more robust insights for decision-making.
Fourth, the visualization of complex networks is more appealing to the global population, as showed by the direct connections presented in , providing an immediate notion of the risks. However, the details of all calculations are not evident, as happens in usual mathematical models.
Lastly, there are still many uncertainties around 2019-nCOV. For example, we used data from researchers that also identified limitations in their findings. The paper published by Zhao et al. (Citation2020) pointed to the insufficient data available. Therefore, all models that aim to assist in governmental (e.g., balance the economy needs and the particular pandemic curve of the country and its external connections) or companies’ decisions (e.g., limit, close, or reopen airline routes) must be constantly updated and are part of a society-wide learning process.
Conclusion
This paper presented a self-supervised machine learning approach to model mobility based on open access data. The results are promising to evaluate the impact of airline routes in pandemic progression, assisting in the economic decisions that must balance two crucial values: human health and economic health. Both are essential to the progress of the society. The main contributions can be summarized as (1) an updated review of the airline connection impact in the new coronavirus progression, (2) the identification of recent trends in artificial intelligence to support intelligent mobility that adhere to the needs of health-care systems and the economy, and (3) a complex network approach supported in open data that uses statistical learning techniques to inform public and private entities about any adverse effect of air travel. The decisions to reopen airline connections must carefully evaluate both, direct and indirect mobility channels made possible by a global economy. Combining measures of centrality and entropy can provide more robust results in the predictions.
Important future work opportunities are identified. First, training the model with more data recently collected in different locations and including additional parameters, namely, the high infectious disease vulnerability index and the efficacy of local measures to control the pandemic. Second, comparing the model with other proposals that use raw data, strengthening our conviction that the approximation proposed in this paper can inform companies and public health organizations to make better global-wide movement decisions.
Correction Statement
This article has been republished with minor changes. These changes do not impact the academic content of the article.
Additional information
Funding
References
- Albert, R., H. Jeong, and A. L. Barabási. 1999. Diameter of the World-Wide Web. Nature 401 (6749):130–31. doi:https://doi.org/10.1038/43601.
- Aleta, A., H. Qitong, Y. Jiachen, J. Peng, and Y. Moreno. 2020. A data-driven assessment of early travel restrictions related to the spreading of the Novel COVID-19 within Mainland China. Chaos, Solitons & Fractals 139. doi:https://doi.org/10.1016/j.chaos.2020.110068.
- Anzai, A., T. Kobayashi, N. M. Linton, R. Kinoshita, K. Hayashi, A. Suzuki, Y. Yang, S.-M. Jung, T. Miyama, A. R. Akhmetzhanov, et al. 2020. Assessing the impact of reduced travel on exportation dynamics of Novel Coronavirus infection (COVID-19). Journal of Clinical Medicine 9 (2):601. doi:https://doi.org/10.3390/jcm9020601.
- Bai, Z., Y. Gong, X. Tian, Y. Cao, W. Liu, and L. Jing. 2020. The rapid assessment and early warning models for COVID-19. Virologica Sinica 12250. doi:https://doi.org/10.1007/s12250-020-00219-0.
- Balcan, D., V. Colizza, B. Gonçalves, H. Hud, J. J. Ramasco, and A. Vespignani. 2009. Multiscale mobility networks and the spatial spreading of infectious diseases. Proceedings of the National Academy of Sciences of the United States of America 106 (51):21484–89. doi:https://doi.org/10.1073/pnas.0906910106.
- Bhatia, S., N. Imai, G. Cuomo-dannenburg, M. Baguelin, A. Boonyasiri, A. Cori, I. Dorigatti, et al. 2020. Report 6: relative sensitivity of international surveillance. MRC Centre for Global Infectious Disease Analysis.
- Bobdey, S., and S. Ray. 2020. Going Viral – Covid-19 impact assessment: A perspective beyond clinical practice. Journal of Marine Medical Society 22 (1):9. doi:https://doi.org/10.4103/jmms.jmms_12_20.
- Bogoch, I. I., A. Watts, A. Thomas-Bachli, C. Huber, M. U. G. Kraemer, and K. Khan. 2020. Potential for global spread of a Novel Coronavirus from China. Journal of Travel Medicine 1–3. doi:https://doi.org/10.1093/jtm/taaa011.
- Bowen, J. T., and C. Laroe. 2006. Airline networks and the international diffusion of Severe Acute Respiratory Syndrome (SARS). Geographical Journal 172 (2):130–44. doi:https://doi.org/10.1111/j.1475-4959.2006.00196.x.
- Brenner, F., N. Marwan, and P. Hoffmann. 2017. Climate impact on spreading of airborne infectious diseases: Complex network based modeling of climate influences on influenza like illnesses. European Physical Journal: Special Topics 226 (9):1845–56. doi:https://doi.org/10.1140/epjst/e2017-70028-2.
- Breugelmans, J. G., P. Zucs, K. Porten, S. Broll, M. Niedrig, A. Ammon, and G. Krause. 2004. SARS transmission and commercial aircraft. Emerging Infectious Diseases 10 (8):1502–03. doi:https://doi.org/10.3201/eid1008.040093.
- Buckee, C. O., S. Balsari, J. Chan, M. Crosas, F. Dominici, U. Gasser, Y. H. Grad, B. Grenfell, M. Elizabeth Halloran, M. Kraemer, et al. 2020. Aggregated mobility data could help fight COVID-19. Science 8021 (March):19–20. doi:https://doi.org/10.1126/science.abb8021.
- Chang, C. Y., C. X. Cao, Q. Wang, Y. Chen, Z. D. Cao, H. Zhang, L. Dong, J. Zhao, M. Xu, M. Gao, et al. 2010. The Novel H1N1 Influenza A Global Airline Transmission and early warning without travel containments. Chinese Science Bulletin 55 (26):3030–36. doi:https://doi.org/10.1007/s11434-010-3180-x.
- Chang, S. L., N. Harding, C. Zachreson, O. M. Cliff, and M. Prokopenko. 2020. Modelling transmission and control of the COVID-19 pandemic in Australia. http://arxiv.org/abs/2003.10218.
- Chen, Z., and B. Liu. 2016. Lifelong machine learning. Synthesis Lectures on Artificial Intelligence and Machine Learning 10 (3):1–27. doi:https://doi.org/10.2200/S00737ED1V01Y201610AIM033.
- Chinazzi, M., J. T. Davis, M. Ajelli, C. Gioannini, M. Litvinova, S. Merler, Y. P. Ana Pastore, Piontti, K. Mu, L. Rossi, K. Sun, et al. 2020. The effect of travel restrictions on the spread of the 2019 Novel Coronavirus (COVID-19) outbreak. Science 368(6489):395–400. doi:https://doi.org/10.1126/science.aba9757.
- Craig, A. T., A. E. Heywood, and J. Hall. 2020. Risk of COVID-19 Importation to the Pacific Islands through Global Air Travel. Epidemiology and Infection 148:1–16. doi:https://doi.org/10.1017/S0950268820000710.
- Department of Health. 2020. List of Flights/Trains/Ships/Cars Taken by Probable/Confirmed Cases of COVID-19 during the symptomatic phase in the past 14 days. 2020. https://data.gov.hk/en-data/dataset/hk-dh-chpsebcddr-novel-infectious-agent/resource/1bda2bd2-8c00-4379-8ed9-e0afb495d5de.
- Desai, A. N., M. U. G. Kraemer, S. Bhatia, A. Cori, P. Nouvellet, M. Herringer, E. L. Cohn, M. Carrion, J. S. Brownstein, L. C. Madoff, et al. 2019. Real-time epidemic forecasting: Challenges and opportunities. Health Security 17 (4):268–75. doi:https://doi.org/10.1089/hs.2019.0022.
- Desenclos, J-C., S. van der Werf, I. Bonmarin, D. Levy-Bruhl, Y. Yazdanpanah, B. Hoen, J. Emmanuelli, O. Lesens, M. Dupon, F. Natali, et al.2004. Introduction of SARS in France, March–April, 2003. Emerging Infectious Diseases 10 (2): 195–200. doi. https://doi.org/10.3201/eid1002.030351.
- Findlater, A., and I. I. Bogoch. 2018. Human mobility and the global spread of infectious diseases: A focus on air travel. Trends in Parasitology 34 (9):772–83. doi:https://doi.org/10.1016/j.pt.2018.07.004.
- Ghahramani, Z. 2015. Probabilistic machine learning and artificial intelligence. Nature 521 (7553):452–59. doi:https://doi.org/10.1038/nature14541.
- Gilbert, M., G. Pullano, F. Pinotti, E. Valdano, C. Poletto, P. Y. Boëlle, E. D’Ortenzio, Y. Yazdanpanah, S. P. Eholie, M. Altmann, et al. 2020. Preparedness and vulnerability of African Countries against importations of COVID-19: A modelling study. The Lancet 395 (10227):871–77. doi:https://doi.org/10.1016/S0140-6736(20)30411-6.
- Giovanetti, M., D. Benvenuto, S. Angeletti, and M. Ciccozzi. 2020. The first two cases of 2019-NCoV in Italy: Where they come from? Journal of Medical Virology 92 (February):518–21. doi:https://doi.org/10.1002/jmv.25699.
- Guo, C., L. Yang, X. Chen, D. Chen, H. Gao, and M. Jing. 2020. Influential nodes identification in complex networks via information entropy. Entropy 22 (2):1–19. doi:https://doi.org/10.3390/e22020242.
- Haider, N., A. Yavlinsky, D. Simons, A. Y. Osman, F. Ntoumi, A. Zumla, and R. Kock. 2020. Passengers’ destinations from China: Low risk of Novel Coronavirus (2019-NCoV) transmission into Africa and South America. Epidemiology and Infection 148 (February):e41. doi:https://doi.org/10.1017/S0950268820000424.
- Hevner, A. R., S. T. March, J. Park, and S. Ram. 2004. Design science in information systems research. MIS Quarterly 28 (1):75–105. doi:https://doi.org/10.2307/25148625.
- Ji, Y., M. Zhongren, M. P. Peppelenbosch, and Q. Pan. 2020. Potential association between COVID-19 mortality and health-care resource availability. The Lancet Global Health 8 (4):e480. doi:https://doi.org/10.1016/S2214-109X(20)30068-1.
- Kraemer, M. U. G., C.-H. Yang, B. Gutierrez, C.-H. Wu, B. Klein, D. M. Pigott, Open COVID-19 Data Working Group, L. Du Plessis, N. Faria, R. Li, et al. 2020. The effect of human mobility and control measures on the COVID-19 epidemic in China. Science 368(6490):493–497. doi:https://doi.org/10.1126/science.abb4218
- Lai, S., I. Bogoch, N. Ruktanonchai, A. Watts, X. Lu, W. Yang, H. Yu, K. Khan, A. Tatem. 2020. Assessing spread risk of Wuhan Novel Coronavirus within and beyond China, January-April 2020: A travel network-based modelling study. MedRxiv (April). 2020.02.04.20020479. doi:https://doi.org/10.1101/2020.02.04.20020479
- Lecun, Y., Y. Bengio, and G. Hinton. 2015. Deep Learning. Nature 521 (7553):436–44. doi:https://doi.org/10.1038/nature14539.
- Li, D., L. Jun, G. Botwin, J. Braun, W. Cao, L. Liming, and P. B. M. Dermot. 2020a. Estimating the scale of COVID-19 epidemic in the United States: Simulations based on air traffic directly from Wuhan, China. MedRxiv 043:2020.03.06.20031880. doi:https://doi.org/10.1101/2020.03.06.20031880.
- Li, M. Z., and M. S. Ryerson. 2019. Reviewing the DATAS of aviation research data: Diversity, availability, tractability, applicability, and sources. Journal of Air Transport Management 75 (September 2018):111–30. doi:https://doi.org/10.1016/j.jairtraman.2018.12.004.
- Li, R., S. Pei, B. Chen, Y. Song, T. Zhang, W. Yang, and J. Shaman. 2020b March. Substantial undocumented infection facilitates the rapid dissemination of Novel Coronavirus (SARS-CoV2). Science eabb3221. doi:https://doi.org/10.1126/science.abb3221.
- Low, D. E., and A. McGeer. 2003. SARS — One Year Later. New England Journal of Medicine 349 (25):2381–82. doi:https://doi.org/10.1056/NEJMp038203.
- Luczak-Roesch, M. 2020. Networks of information token recurrences derived from genomic sequences may reveal hidden patterns in epidemic outbreaks: A case study of the 2019-NCoV Coronavirus. MedRxiv 2020 (2):07.20021139. doi:https://doi.org/10.1101/2020.02.07.20021139.
- Marcelino, J., and M. Kaiser. 2009. Reducing Influenza Spreading over the Airline Network. PLoS Currents (August). doi:https://doi.org/10.1371/currents.RRN1005.
- McCall, B. 2020. COVID-19 and artificial intelligence: protecting health-care workers and curbing the spread. The Lancet Digital Health 2 (4):e166–67. doi:https://doi.org/10.1016/S2589-7500(20)30054-6.
- Meslé, M., M. Isabelle, I. M. Hall, R. M. Christley, S. Leach, and J. M. Read. 2019. The use and reporting of airline passenger data for infectious disease modelling: A systematic review. Eurosurveillance 24 (31):1–18. doi:https://doi.org/10.2807/1560-7917.ES.2019.24.31.1800216.
- Mitchell, M. 2006. Complex systems: Network thinking. Artificial Intelligence 170 (18):1194–212. doi:https://doi.org/10.1016/j.artint.2006.10.002.
- Musselwhite, C., E. Avineri, and Y. Susilo. 2020. Editorial JTH 16 – The Coronavirus Disease COVID-19 and implications for transport and health. Journal of Transport & Health 16 (16):100853. doi:https://doi.org/10.1016/j.jth.2020.100853.
- Newman, M., A.-L. Barabási, and D. J. Watts. 2006. The structure and dynamics of networks. Princeton, New Jersey: Princeton University Press.
- Newman, M. E. J. 2001. Clustering and preferential attachment in growing networks. Physical Review E - Statistical Physics, Plasmas, Fluids, and Related Interdisciplinary Topics 64 (2):4. doi:https://doi.org/10.1103/PhysRevE.64.025102.
- Nikolaou, P., and L. Dimitriou. 2020. Identification of critical airports for controlling global infectious disease outbreaks: Stress-tests focusing in Europe. Journal of Air Transport Management 85 (April):101819. doi:https://doi.org/10.1016/j.jairtraman.2020.101819.
- Peffers, K., T. Tuunanen, M. A. Rothenberger, and S. Chatterjee. 2007. A design science research methodology for information systems research. Journal of Management Information Systems 24 (3):45–78. doi:https://doi.org/10.2753/MIS0742-1222240302.
- Pincus, S. M. 1991. Approximate entropy as a measure of system complexity. Proceedings of the National Academy of Sciences of the United States of America 88 (6):2297–301. doi:https://doi.org/10.1073/pnas.88.6.2297.
- Prasse, B., M. A. Achterberg, M. Long, and P. Van Mieghem. 2020. Network-based prediction of the 2019-NCoV epidemic outbreak in the Chinese Province Hubei. ArXiv, 1–17. http://arxiv.org/abs/2002.04482.
- Quilty, B. J., S. Clifford, and R. M. Eggo,, . 2020. Effectiveness of airport screening at detecting travellers infected with Novel Coronavirus (2019-NCoV). Euro Surveillance 25 (5):1–6. doi:https://doi.org/10.2807/1560-7917.ES.2020.25.5.2000080.
- Rees, E. E., V. Ng, P. Gachon, A. Mawudeku, D. McKenney, J. Pedlar, D. Yemshanov, J. Parmely, and J. Knox. 2019. Risk assessment strategies for early detection and prediction of infectious disease outbreaks associated with climate change. Canada Communicable Disease Report 45 (5):119–26. doi:https://doi.org/10.14745/ccdr.v45i05a02.
- Rene Niehus, P. M., A. R. De Salazar, and M. L. Taylor. 2020. Estimating underdetection of internationally imported COVID-19 cases. MedRxiv, 1–9.
- Rodríguez-Morales, A. J., K. MacGregor, S. Kanagarajah, D. Patel, and P. Schlagenhauf. 2020. Going Global – Travel and the 2019 Novel Coronavirus. Travel Medicine and Infectious Disease 33 (January):101578. doi:https://doi.org/10.1016/j.tmaid.2020.101578.
- Salami, D., C. Sousa, M. Martins, and C. Capinha. 2020. Predicting dengue importation into europe, using machine learning and model-agnostic methods. Scientific Reports 10:9689. doi:https://doi.org/10.1038/s41598-020-66650-1
- Sermanet, P., C. Lynch, J. Hsu, and S. Levine. 2017. Time-contrastive networks: Self-supervised learning from multi-view observation. In 2017 IEEE Conference on Computer Vision and Pattern Recognition Workshops (CVPRW), 486–87. IEEE. doi:https://doi.org/10.1109/CVPRW.2017.69.
- Simon, H. 1996. The Sciences of the Artificial. 3rd ed. Cambridge, Massachusetts: MIT Press.
- Sun, X., S. Wandelt, and A. Zhang. 2020. Resilience of cities towards airport disruptions at global scale. Research in Transportation Business & Management 34(March):100452. doi:https://doi.org/10.1016/j.rtbm.2020.100452.
- Tan, J., M. Lina, J. Huang, Y. Shunzhang, B. Chen, and J. Yin. 2005. An initial investigation of the association between the SARS outbreak and weather: With the view of the environmental temperature and its variation. Journal of Epidemiology and Community Health 59 (3):186–92. doi:https://doi.org/10.1136/jech.2004.020180.
- Tizzoni, M., P. Bajardi, J. J. Chiara Poletto, D. B. Ramasco, B. Gonçalves, N. Perra, V. Colizza, and A. Vespignani. 2012. Real-time numerical forecast of global epidemic spreading: Case study of 2009 A/H1N1pdm. BMC Medicine 10. doi:https://doi.org/10.1186/1741-7015-10-165.
- Venable, J., J. Pries-Heje, and R. Baskerville. 2016. FEDS: A framework for evaluation in design science research. European Journal of Information Systems 25 (1):77–89. doi:https://doi.org/10.1057/ejis.2014.36.
- Vespignani, A. 2009. Predicting the behavior of techno-social systems. Science 325 (5939):425–28. doi:https://doi.org/10.1126/science.1171990.
- Wang, B., Y. Han, and G. Tanaka. 2017. Interplay between epidemic spread and information propagation on metapopulation networks. Journal of Theoretical Biology 420 (February):18–25. doi:https://doi.org/10.1016/j.jtbi.2017.02.020.
- Wang, L., and X. Li. 2014. Spatial epidemiology of networked metapopulation: An overview. Chinese Science Bulletin 59 (28):3511–22. doi:https://doi.org/10.1007/s11434-014-0499-8.
- Wilson, M. E., and L. H. Chen. 2020. Travelers give wings to Novel Coronavirus (2019-NCoV). Journal of Travel Medicine 27 (2):1–3. doi:https://doi.org/10.1093/jtm/taaa015.
- World Economic Forum. 2020. The Global Social Mobility Report 2020 Equality, Opportunity and a New Economic Imperative. http://www3.weforum.org/docs/Global_Social_Mobility_Report.pdf.
- Wu, J. T., K. Leung, and G. M. Leung. 2020. Nowcasting and Forecasting the potential domestic and international spread of the 2019-NCoV outbreak originating in Wuhan, China: A modelling study. The Lancet 395 (10225):689–97. doi:https://doi.org/10.1016/S0140-6736(20)30260-9.
- Yu, M., M. Bambacus, G. Cervone, K. Clarke, D. Duffy, Q. Huang, L. Jing, W. Li, Z. Li, Q. Liu, et al. 2020. Spatiotemporal event detection: A review. International Journal of Digital Earth 1–27. doi:https://doi.org/10.1080/17538947.2020.1738569.
- Zhang, C., B. Recht, S. Bengio, M. Hardt, and O. Vinyals. 2016. Understanding deep learning requires rethinking generalization. ArXiv preprint arXiv:1611.03530.
- Zhao, S., Z. Zhuang, P. Cao, J. Ran, D. Gao, Y. Lou, L. Yang, Y. Cai, W. Wang, D. He, et al. 2020. Quantifying the Association between Domestic Travel and the Exportation of Novel Coronavirus (2019-NCoV) Cases from Wuhan, China in 2020: A Correlational Analysis. Journal of Travel Medicine 27 (2):1–3. doi:https://doi.org/10.1093/jtm/taaa022.