
 ?Mathematical formulae have been encoded as MathML and are displayed in this HTML version using MathJax in order to improve their display. Uncheck the box to turn MathJax off. This feature requires Javascript. Click on a formula to zoom.
ABSTRACT
More and more people are entering the cryptocurrency market after Bitcoin (BTC) soared to nearly USD 20,000 in 2017. To promote the development of information technology and cryptocurrency marketing, various computerized systems integrating information technology with investment and financing are innovated continuously. In this study, the daily cryptocurrency prices were input to Recurrent Neural Network (RNN) and Long Short-Term Memory (LSTM); and the developing trend plots were drawn to predict and analyze the future cryptocurrency prices through deep learning. Finally, the business practices of cryptocurrency investment were modularized based on High-Level Fuzzy Petri Nets (HLFPNs) to make a better investment decision so that all investors can use this decision system to quickly understand the future cryptocurrency trend. The experimental results have shown that this decision system can provide effective investment information to achieve investors’ personal financial goals with the expectation of improving financial situations.
Introduction
Since Satoshi Nakamoto published his article entitled “Bitcoin: A Peer-to-Peer Electronic Cash System on the Internet” in 2008 (Nakamoto Citation2009), the advent of the era of cryptocurrency has become. In recent years, thanks to the dramatic increase of Bitcoin, people have begun to note the existence of cryptocurrency and its underlying technology that could change the world in the future, especially in the blockchain. Due to the characteristics of blockchain with open sources, one can create one’s own cryptocurrencies (Bitcoin Citation2020a; Bitcoin Citation2020b). Therefore, in the next few years, the world will enter a cryptocurrency boom, and now there are more than 6,000 cryptocurrencies around the world (Lansky Citation2018). However, a Temporal Mixture Ensemble (TME) was constructed to provide predictive uncertainty of the target volume by using the Stochastic Gradient Descent based technique (Huang et al. Citation2021). Although the mixture models have been widely used in machine learning and deep learning, they are hardly explored for prediction tasks in cryptocurrency markets (Cherfi et al. Citation2018; Guo et al. Citation2018).
In a broad sense, investment refers to the fact that people pay for things they think are valuable and expect to get more valuable returns on them in the future. However, in a narrow sense, investment refers to buying assets with money in the hope of getting more assets in the future (Krafft, Penna, and Pentland Citation2018). There are many advantages of cryptocurrency in the blockchain, namely, digital currency, real-time transfer, decentralized feature and transparency, and so on. At present, cryptocurrency is considered as attractive investments (Gupta et al. Citation2020). Many people hope to make fortunes, so they may make heavy investments in cryptocurrency (Brito, Shadab, and Castillo Citation2014). A few people have been among millionaires by investments in cryptocurrency and reached the peak through the shortcut.
Investment may amass wealth, but it may lose more money, which is full of uncertainty. Therefore, all investors often use various investment tools as an aid, which not only reduces risks but also makes it easier to find ways to make more money (Alam, Li, and Patidar Citation2015; Buterin et al. Citation2020; Jozefowicz, Zaremba, and Sutskever Citation2015). Many people consider cryptocurrency transaction as a gamble because they have no way to estimate the future rise or fall of the currency values (Jondri, et al. Citation2018; Hochreiter et al. Citation1997; Wirawan et al. Citation2019; Jang et al. Citation2017; Saad et al. Citation2020; Bohme et al. Citation2015; Kosba et al. Citation2016).
Nevertheless, many scholars have already proposed several methods, such as trend following (Huang, Jeng, and Chen Citation2008; Karasu et al. Citation2018), technical index strategies (Lin and Chiang Lin Citation2009; Shen et al. Citation2018) and fuzzy reasoning (Arora, Singh, and Gupta Citation2021; Inder et al. Citation2021; Li and Jeng Citation2010; Li et al. Citation2019; Yu and Kuo Citation2004), in their studies. But it is usually hard to generate buying signals in trend following and technical index strategies. Moreover, trend following has poor predictability in continuous rises and falls. On the other hand, in the studies on fuzzy reasoning, the system calculation becomes large and complex when multiple rules are triggered simultaneously (Istrat et al. Citation2017; Jain, Walia, and Gupta Citation2020; Jain et al. Citation2021). The main purpose of this paper is to make investment decisions on the cryptocurrency marketing. First, Recurrent Neural Network (RNN) and Long Short-Term memory (LSTM) aim to perform data preprocessing for deep learning. Then an HLFPN model with fuzzy reasoning is designed to process a knowledge-based system and make an appropriate decision on the investment (Robidoux et al., Citation2010).
In Section 2, the applications of RNN and LSTM to price prediction, as well as the definition of technical indices are discussed; and the HLFPN theory and its basic properties are reviewed. Section 3 presents the system structure and investment model based on HLFPN. Section 4 shows the experimental results and discussion of the HLFPN-based investment model. Finally, Section 5 remarks the conclusion and future work.
Literature Review
This Section discusses the literature required. First, cryptocurrency principles and popular currencies are introduced. Second, the RNN and LSTM are introduced. And then the technical analysis methods are presented. Also, some basic definitions of the HLFPN model are stated. Finally, the related works are discussed.
Cryptocurrency
Cryptocurrency is a medium of money exchange created to ensure secure transactions and control transaction units by using cryptography principles. Just like the ordinary currencies which require an anti-counterfeiting design, in terms of cryptocurrency, the digital and virtual currencies are made up of cryptography and digital hashing; and achieve the anti-counterfeit effect by Smart Contracts (Alam, Li, and Patidar Citation2015; Brito, Shadab, and Castillo Citation2014; Krafft, Penna, and Pentland Citation2018; Lansky Citation2018).
Bitcoin
Created by Mr. Satoshi Nakamoto, Bitcoin (BTC) is the first cryptocurrency in the world and currently the most valuable currency (Bitcoin Citation2020a; Bitcoin Citation2020b; Guo, Bifet, and Antulov-Fantulin Citation2018; Nakamoto Citation2009), (Alam, Li, and Patidar Citation2015; Brito, Shadab, and Castillo Citation2014). The BTC white paper was published in November 2008 and officially issued in January 2009.
Ethereum
As the currently second-largest cryptocurrency by market value launched in 2015, in addition to using Ether for peer-to-peer currency transactions, Ethereum (ETH) aims to build a decentralized multi-application platform, namely, establishing self-governing organizations, launching project ICOs and providing DApps (Decentralized applications) (Ethereum Citation2020; Buterin et al. Citation2020).
Recurrent Neural Network
Recurrent Neural Network (RNN) is a neural network for processing data sequences. Compared to common neural networks, it can process the changing data sequences, such as the texts which are sequences of letters and words, the voices which are sequences of syllables, the videos which are sequences of images, meteorological observation data and stock transaction data. RNN can well solve such problems (Jozefowicz, Zaremba, and Sutskever Citation2015; Jondri et al. Citation2018). The simple RNN cannot solve those problems regarding recursion, weighted exponential explosion or gradient vanishing, so it is difficult to capture the long-term time correlation.
Long Short-Term Memory
First published in 1997, Long Short-Term Memory (LSTM) is a variant of RNN. Due to its unique design structure, it is suitable for processing and predicting important events with long intervals and delays in time series (Hochreiter and Schmidhuber Citation1997; Huang et al. Citation2021).
Technical Analysis
Technical analysis is used to determine the past and present trends of stock/cryptocurrency prices by charts, which estimates the developing trends in the future. It develops the objective and scientific marketing status with statistical data as a tool to help all investors. With the specific values and transaction signals, it is possible to determine the transaction timing and seek for significant indices to predict stock/cryptocurrency exchange points. Technical analysis is a widely used analytical tool in the stock/cryptocurrency market because the technical analysts consider that all investors will repeat the behaviors of previous investors collectively, and the market prices will reflect all related information (Shen et al. Citation2018; Singh et al. Citation2021; Yu and Kuo Citation2004).
Relative Strength Index
Relative Strength Index (RSI) was proposed by J. Welles Wilder in his article entitled “New Concepts in Technical Trading Systems” in 1978. RSI compares the relative price strength between the degrees to which the closing price is higher than that of the previous day and lower than that of the previous day. The formula is shown in EquationEqn. (1)(1)
(1) .
where RS is “the mean difference in the closing prices rise over a specified period” divided by “the mean difference in the closing prices fall over a specified period.”
Williams %R
First proposed by Larry Williams in his article entitled “How I Made A Million Dollars” in 1973, Williams %R (WMS) was originally known as Williams overbought/oversold index, WMS%R or %R for short. WMS%R analyzes whether the stock/cryptocurrency market is overbought or oversold by using the swing theory. It measures the high or low point of stock/cryptocurrency market cycles to propose effective buying and selling signals. This study adopted 5-day WMS%R, and the formula is shown in EquationEqn. (2)(2)
(2) .
where H5 is the highest price within 5 days, L5 is the lowest price within 5 days, and Ct is the closing price on the 5th day.
Psychological Line
A psychological line (PSY) tests the psychological phenomenon of investors’ tendency to buy or sell based on the days of rises or falls in the closing price of the stock/cryptocurrency market index. Also, it is used as an index to analyze whether the stock/cryptocurrency market is overbought or oversold. It can accurately show the peak or trough of the stock/cryptocurrency market trend. The index adopted in this study is 5-day PSY line, and the formula is shown in EquationEqn. (3)(3)
(3) .
High Level Fuzzy Petri Net (HLFPN)
High Level Fuzzy Petri Net (HLFPN) has been formally defined in references (Papageorgiou et al. Citation2018; Shen Citation2006, Citation2003; Shen et al. Citation2018). To better understand, the fuzzy reasoning procedure, which is the key concept of HLFPN, is illustrated as follows:
Illustrative Example
Assume that the fuzzy production rule is shown below.
IF the apple flesh is sweet
AND its weight
is heavy
THEN the price is high
.
Briefly, the alternative fuzzy production rule is shown as follows:
Thus, the predicate logic form is shown below.
According to the predicate logic above, the HLFPN model is shown in .
Figure 1. HLFPN for illustrative example
Assume that the fuzzy sets ,
and B are shown as follows:
Apply the cylindrical extension and get the fuzzy set .
Then, the fuzzy relational matrices ,
, and
between antecedent and consequent of the fuzzy production rule
can be obtained, shown as follows:
The most widely used fuzzy reasoning method is the max-min compositional inference. Assume that the input fuzzy sets and
are shown as follows:
Then we can get
Finally, we obtain
The description above is the HLFPN-based fuzzy reasoning procedure.
Theoretically, RNN and LSTM are used to perform data preprocessing for cryptocurrency prediction; and HLFPN is used to make decision on investment. Practically, this approach can determine the appropriate timing of buying or selling BTC or ETH.
Proposed Cryptocurrency Investment Model
Just like the investment in stocks, real estate and gold, the timing of buying or selling is also critical for cryptocurrency investors. However, in the real life, many investors may be unable to achieve their goal due to the lack of financial awareness. Investors must make their own investment decision and bear the risk of loss. But it does not mean that other tools cannot be used in cryptocurrency investment. It is a good way to make investment decision based on the technical indices.
However, the timing of buying or selling is determined by the calculated values in the technical index-based investment decision. It would be biased to use only one index to make decisions. However, are the technical indices high or low? How to find the best time to buy or to sell if many indicators available are used to make decisions. It is appropriate to use the fuzzy theory for uncertain and ambiguous situations.
To enhance the readability, all required abbreviations are listed in .
Table 1. Abbreviations
Research Architecture
This paper proposed a method to apply the HLFPN model to cryptocurrency investment, as shown in . First, the cryptocurrency prices were trained by using LSTM and the future prices are predicted based on the trained model. And then the membership function was defined according to the investment strategies of the technical indices; and the fuzzy reasoning rules and the corresponding HLFPN model were built. All index values calculated by the actual and predicted prices were transformed by the fuzzifier to membership functions and put into the HLFPN. All indices were reasoned according to the fuzzy production rules. Finally, all indices were combined to make decisions on buying or selling.
Figure 2. Architecture of the proposed method
In this Section, RNN and LSTM-based deep learning models as well as the HLFPN fuzzy reasoning procedure were used to make investment decisions based on the defined technical indices and fuzzy production rules.
Cryptocurrency Price Prediction
Keras (Keras 2020) was usually used to train the prediction model. Keras is an open source and high-level deep learning link library written in Python; and it can run on TensorFlow. The input datasets are based on the Bitcoin and Ethereum historical datasets published on Kaggle, which were learned by the traditional RNN and LSTM.
Cryptocurrency Price Prediction
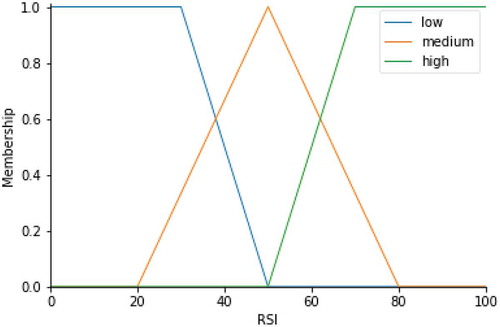
There are many transaction decision methods in the market. Technical index is a good choice, easy to implement and clear to understand. So, technical indices were used to establish the membership functions. According to Pareto Principle (Papageorgiou et al. Citation2018), 20% of variables can control 80% of situations. In other words, of all the variables, only 20% are important. The technical indices were divided into three sets, namely, “high,” “medium,” and “low.” Moreover, three sets of technical indices include two trapezoidal membership functions and one triangular membership function, as shown in .
Figure 3. Type of technical index membership functions
In addition, the investment decision includes two options, namely, “Buy” or “Sell,” which are triangular membership functions, as shown in .
Figure 4. Type of membership functions for investment decision
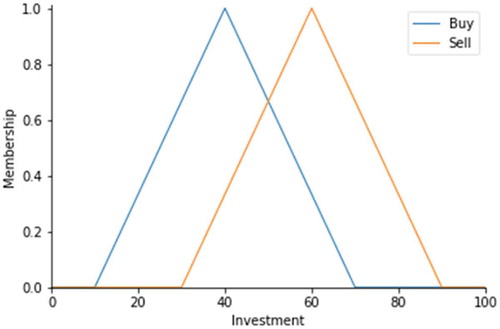
In this study, three technical indices, namely, RSI, WMS and PSY, were used. Hence, the membership functions of all “high,” “medium” and “low” technical indices are defined, as shown in . The membership functions of the investment decision on two actions, “buy” and “sell,” are shown in .
Table 2. Membership functions of technical index
Table 3. Membership functions of investment decision
In the technical analysis, the values of technical indices are usually set between 0 and 100. Those values above 80 are high and those values below 20 are low. However, due to the membership functions defined above, their variable domain ranges from 0 to 1. Hence, the technical indices must be converted to the values between 0 and 1 to replace them in the rule base for calculation.
Assume that denote “High,” “Medium,” “Low,” “Sell” and “Buy” membership functions, respectively; and the fuzzy transformation processes are defined as follows:
Fuzzy Reasoning and Building HLFPN
According to the fuzzy sets and their membership functions defined above, all technical indices were input to the fuzzifier to calculate the membership grades. Based on the technical index size, they were converted to “If … then” to build the statements in the rule base. Different sizes of technical indices produce different results for the investment decision. For example, if the index is high, the decision is to sell. If the index is intermediate, the decision is not to be changed, namely, flat. If the index is low, the decision is to buy. There are three input variables in this study. Three variables denote the antecedents of all rules, and the consequents contain three options, namely, buying, flat and selling.
Assume that RSI (R), WMS (W) and PSY (P) denote the input linguistic variables with fuzzy terms: High (H), Medium (M) and Low (L); and assume that Decision (D) is the output linguistic variable with fuzzy terms: Strong (S), Indeterminate (I) and Weak (WK), where . Nine fuzzy production rules are defined as follows:
: If W is H, then D is S.
: If W is M, then D is I.
: If W is L, then D is WK.
: If R is H, then D is S.
: If R is M, then D is I.
: If R is L, then D is WK.
: If P is H, then D is S.
: If P is M, then D is I.
: If P is L, then D is WK.
Then the above-mentioned fuzzy production rules are converted to the HLFPN model, as shown in . All parameters are described in .
Figure 5. HLFPN model of fuzzy production rules
Table 4. Parameter description
Based on the built HLFPN model, the fuzzy technical indices and the rules in the rule base were used for fuzzy reasoning. During the fuzzy reasoning, standard operators were used for calculation. Finally, the specific outputs of buying or selling decision were made by using the weighted average defuzzification method.
An Example of HLFPN-Based Fuzzy Reasoning
In this Sub-section, an example was illustrated to explain the feasibility of HLFPN-based fuzzy reasoning.
[Step 1]
Initially, assume that only the degree of memberships (DOMs) in the propositions operating on input variables are available. Assume that six fuzzy sets are shown as follows:
[Step 2]
All elements’s belong to set T. Calculate the fuzzy relational matrix
, where T denotes a set of transitions.
denotes a fuzzy relational matrix between the antecedent and the consequent of rule j. Calculate the fuzzy relational matrices as shown below.
[Step 3]
Input a data pattern. Consider the following data patterns:
[Step 4]
Fire the enabled transitions:
[Steps 5-6]
The final fuzzy reasoning result is shown below.
[Steps 7-8]
Use the weighted average method to calculate the decision value, as shown below.
The decision value is set as , so the decision is to sell.
Experimental Results
This Section explains the experimental results and performance analysis. To prove that the investment decision system based on HLFPN is feasible, this system is used to verify the predictive effect of the model. The proposed method aims to apply RNN and LSTM to cryptocurrency price trend prediction. To test the system accuracy, two practical examples including BTC and ETH were applied for performance evaluation.
Experimental Design
During the test phase in this experiment, the daily closing prices of BTC and ETH disclosed in Yahoo Finance (Yahoo Citation2020) were used as the input datasets. The BTC price datasets from January 1, 2012 to August 12, 2019 and the ETH price datasets from July 30, 2015 to August 5, 2018 were collected. RNN and LSTM models were first trained by using two cryptocurrency input datasets, respectively, which predict the 50-day overnight prices. Then, the 50-day RSI, WMS and PSY technical indices were calculated, to make decision on the cryptocurrency buying or selling through the HLFPN-based reasoning procedure presented in Sub-section 3.5.
Cryptocurrency Price Prediction
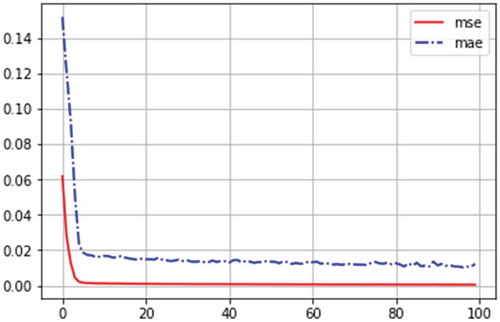
In this Sub-section, two examples were given to compare the predictive abilities of RNN and LSTM models. Then the line chart was used to show the changes in prediction data variants of the models. Two loss functions, namely, mean squared error (MSE) and mean absolute error (MAE), were used to evaluate the prediction results of the RNN and LSTM models.
Mean Squared Error (MSE)
MSE is the regression loss function which was used the most commonly. The computation method is to calculate the sum of squares of the difference between the predictive value and the true value. The formula is shown in EquationEqn. (9)(9)
(9) .
where yi denotes the true value, ŷi denotes the predictive value, and m denotes the total number of summations.
Mean Absolute Error (MAE)
MAE is another loss function used in the regression models. MAE is the sum of the absolute values of the difference between the target value and the predictive value, only measuring the average length of the error of predictive value, but not considering the direction. Its value ranges from 0 to positive infinity. The formula is shown in EquationEqn. (10)(10)
(10) .
where yi denotes true value, ŷi denotes predictive value, and m denotes the total number of summations.
show different evaluation indices based on RNN and LSTM models.
Figure 6. Evaluation indices for BTC RNN model
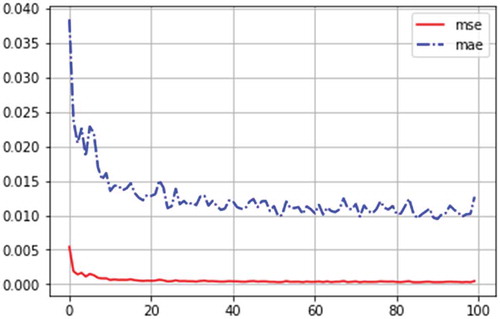
Figure 7. Evaluation indices for BTC LSTM model
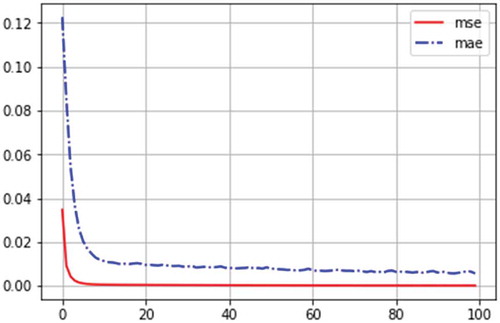
Figure 8. Evaluation indices for ETH RNN model
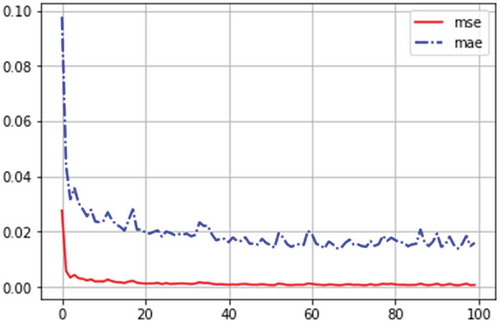
Figure 9. Evaluation indices for ETH LSTM model
Performance Analysis for RNN and LSTM Models
In summary, the lower MSE and MAE values indicate that the predictive values are closer to the true values, and the models can have better learning abilities and predict the future price trends more accurately.
Comparison between RNN and LSTM
As shown in , the traditional RNN and LSTM were used to learn the daily closing prices of BTC and ETH, respectively, and to predict the future price trends.
Figure 10. BTC price trend predicted by the traditional RNN
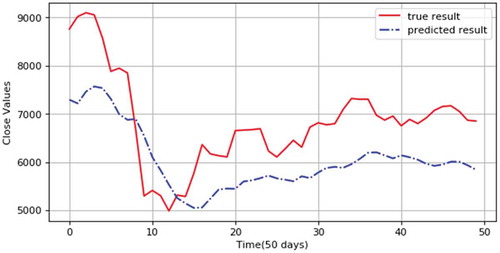
Figure 11. BTC price trend predicted by LSTM
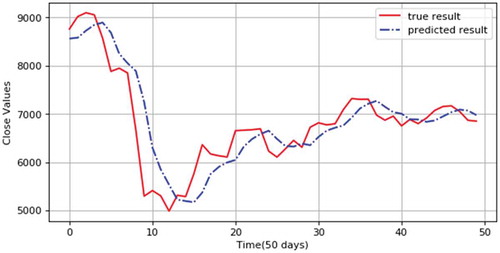
Figure 12. ETH price trend predicted by the traditional RNN
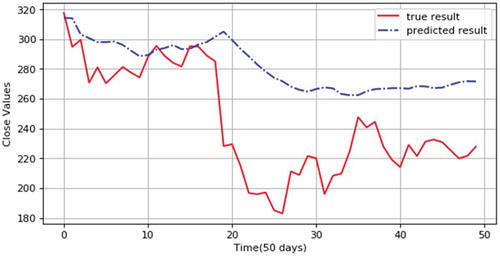
Figure 13. ETH price trend predicted by LSTM
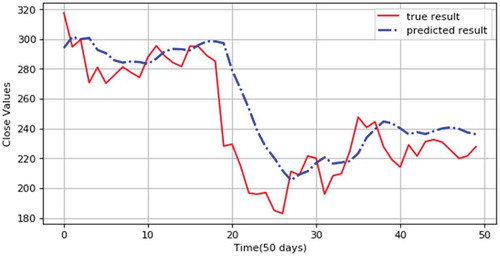
In summary, it has shown that the price trend predicted by LSTM is closer to the actual prices than that by the traditional RNN, proving that LSTM has a better learning effect. Therefore, LSTM was used for data preprocessing of this decision system.
Information about the Decision Processes
According to the example of HLFPN in Sub-section 3.5, this Sub-section will present the proposed method based on BTC prices for transaction decision process in detail. In , the transaction transaction decision datasets calculated by the HLFPN-based investment model include the following seven items:
Date: A total of 100 days from February 25, 2020 to June 3, 2020.
Price: The daily closing prices disclosed in Yahoo Finance were used as the technical indices for calculation, and then the HLFPN-based investment model was used for transaction decision.
RSI: RSI was calculated based on the daily closing prices.
WMS: Williams %R was calculated based on the daily closing prices.
PSY: Psychological line (PSY) was calculated based on the daily closing prices.
HLFPN Output: RSI, WMS and PSY values were input to the HLFPN investment model, getting the outputs through HLFPN-based fuzzy reasoning.
Decision: The transaction decision was made according to the output results, namely, “Sell”, “Flat” and “Buy”.
Table 5. Detailed datasets of the system decision procedure
Decision System Performance Evaluation within Six Months
During the six months from December 1, 2019 to June 1, 2020, HLFPN reasoning, fuzzy reasoning, technical index strategies, trend following, and buy & hold strategies were used for BTC and ETH investment simulation, with all returns on investment shown in ; and all methods generate positive returns. The novel coronavirus was ravaging the world during the study period. Due to the influence of the epidemic, cryptocurrencies also collapsed with the mainstream market in mid-March, but they have been steadily rising since then. Consequently, the returns on investment (ROI) are high through Buy & Hold strategies. The ROI of HLFPN reasoning is higher than that of other methods; and the performance of HLFPN reasoning is also significantly better than that of other methods. Therefore, the proposed method is feasible and superior to other methods. ROI is defined as follows:
Table 6. Decision system performance comparison of ROI
ROI = (Gi – Ci)/Ci(11)
where Gi denotes gain from investment and Ci denotes cost of investment.
Functional Comparison
To fully support the claim that our proposed method is more feasible and acceptable than other existing ones, we have made a functional comparison among different methods including ours, (Guo, Bifet, and Antulov-Fantulin Citation2018,; Huang et al. Citation2021). The results of functional comparison are shown in .
Table 7. Results of functional comparison
“V” denotes “Yes” or “Available.”
Research Limitations
The research limitations are described as follows:
Since there are many technical indices, we cannot select all of them. Therefore, this paper selected three short-term technical indices, namely, RSI, WMS and PSY, without considering other technical indices.
The buying or selling decision was made based on the reasoning results of the HLFPN model without human judgment.
Unlike stocks, there is no opening or closing time for cryptocurrency. In the simulated transactions, cryptocurrency is only bought or sold based on the prices recorded in the historical datasets. Therefore, it may not be able to buy at the lowest price or to sell at the highest price.
The price difference between transaction fees was not considered in this research.
Conclusion
The daily BTC and ETH closing price datasets were used as the samples for training and prediction. For the predicted results, trend plots were drawn; and the technical indices such as RSI, WMS and PSY were used to analyze the prices as another basis for determining cryptocurrency prices. Moreover, according to the values of the technical indices and by combining with HLFPN reasoning procedure, the appropriate investment decision was made to reflect buying or selling, so that investors can better understand the economic development trend. The experimental results have shown that, compared with the previous studies, the proposed method, which combines HLFPN fuzzy reasoning with technical analysis to process investment decision, has been improved significantly.
Thus, the contributions of this study are presented as follows:
1. Using the LSTM model to predict cryptocurrency prices, which draws the trend plots to enable users to understand the future trends correctly.
2. Using the technical indices such as RSI, WMS and PSY as a basis for technical analysis of cryptocurrency.
3. Making decision on buying or selling through the HLFPN reasoning procedure, so that investors can determine the appropriate timing of buying or selling.
There were numerous studies on stock market prediction in the past, but there are still few studies of investment decision on cryptocurrency, which is a new transaction medium. Currently, there are two main methods for stock prediction: one is to use statistical tools and technical indices for analysis, and the other is to build specific models as a decision aid by machine learning algorithms. Hence, the proposed HLFPN model is now used for the cryptocurrency investment decision by taking advantages of deep learning and technical indices.
The experimental results have shown that HLFPN is accurate in making investment decision on cryptocurrency prices. However, due to the time factor, there was no way to achieve all ideal functions. Hence, the future research directions are listed as follows:
To use more technical indices as the input datasets of HLFPN, and to compare the differences of all technical index combinations.
To train datasets and build models by using the samples with different sizes, and to input test datasets of samples with different sizes to figure out their advantages and disadvantages.
To adopt more cryptocurrencies to train the proposed model and make investment decision.
Acknowledgments
The authors are grateful to the anonymous reviewers for their constructive comments which have improved the quality of this paper. Also, this work was supported by the Ministry of Science and Technology, Taiwan, R.O.C., under grants MOST 107- 2221- E-845- 001-MY3 and MOST 110-2221-E-845-002-.
Disclosure statement
No potential conflict of interest was reported by the author(s).
Additional information
Funding
References
- 2020, [online] Available: https://www.kaggle.com/mczielinski/bitcoin-historical-data/
- Alam, M. T., H. Li, and A. Patidar, 2015. Bitcoin for smart trading in smart grid, Proc. 21st IEEE Int. Workshop Local Metropolitan Area Net., 1–2. Beijing, China.
- Arora, M., H. Singh, and S. Gupta, July. 2021. What drives e-hailing apps adoption? An analysis of behavioral factors through fuzzy AHP, Journal of Science and Technology Policy Management, https://www.emerald.com/insight/content/doi/10.1108/JSTPM-12-2020-0177/full/html
- Bitcoin, 2020a. Bitcoin block explorer- blockchain. [online] Available: https://blockchain.info/
- Bitcoin, 2020b. Bitcoin Historical Data - Bitcoin data at 1-min intervals from select exchanges, January 2012 August 2019. [online] Available: https://www.kaggle.com/mczielinski/bitcoin-historical-data/
- Bohme, R., N. Christin, B. Edelman, and T. Moore. 2015. Bitcoin: Economics technology and governance. Journal of Economic Perspectives 29 (2):213–38. doi:https://doi.org/10.1257/jep.29.2.213.
- Brito, J., H. Shadab, and A. Castillo. 2014. Bitcoin financial regulation: Securities, derivatives, prediction markets, and gambling. Colum. Sci. & Tech. L. Rev 16:19–31.
- Buterin, V. et al. 2020. Ethereum White Paper, [online] Available: https://ethereum.org/en/whitepaper/
- Cherfi, A., N. Kaouther, and F. Ahmed. 2018. Very fast C4.5 decision tree algorithm. Applied Artificial Intelligence 32 (2):119–37. doi:https://doi.org/10.1080/08839514.2018.1447479.
- Ethereum, 2020. Ethereum Historical Data - All Ethereum data from the start to August 2018:, [online] Available https://www.kaggle.com/kingburrito666/ethereum-historical-data/
- Guo, T., A. Bifet, and N. Antulov-Fantulin, 2018. Bitcoin volatility forecasting with a glimpse into buy and sell orders, Procs. of IEEE International Conference on Data Mining (ICDM18), Singapore. https://www.researchgate.net/publication/330028981_Bitcoin_Volatility_Forecasting_with_a_Glimpse_into_Buy_and_Sell_Orders
- Gupta, S., S. Gupta, M. Mathew, and H. Rao Sama, 2020. Prioritizing intentions behind investment in cryptocurrency: A fuzzy analytical framework, Journal of Economic Studies, https://www.emerald.com/insight/content/doi/10.1108/JES-06-2020-0285/full/html
- Hochreiter, S., and J. Schmidhuber. 1997. Long short-term memory. Neural Computation 9 (8):1735–80. doi:https://doi.org/10.1162/neco.1997.9.8.1735.
- Huang, S. W., B. C. Jeng, and C. M. Chen. 2008. The empirical study of trend following program trading on Taiwan stock market, Master Thesis, Department of Information Management, National Sun Yat-sen University, Kaohsiung, Taiwan.
- Huang, X., W. Zhang, Y. Huang, X. Tang, M. Zhang, J. Surbiryala, V. Iosifidis, Z. Liu, and J. Zhang, 2021. LSTM based sentiment analysis for cryptocurrency prediction, Procs. of The 26th Conf. on Database Systems for Advanced Applications. http://dm.iis.sinica.edu.tw/DASFAA2021/accepted.html
- Inder, S., A. Aggarwal, S. Gupta, S. Gupta, and S. Rastogi. 2021. An integrated model of financial literacy among B-school graduates using fuzzy AHP and factor analysis. The Journal of Wealth Management 23 (4):92–110. doi:https://doi.org/10.3905/jwm.2020.1.126.
- Istrat, V., and N. Lalic. 2017. Creating a decision-making model using association rules. Applied Artificial Intelligence 31 (5–6):538–53. doi:https://doi.org/10.1080/08839514.2017.1378301.
- Jain, J., N. Walia, and S. Gupta, 2020. Evaluation of behavioral biases affecting investment decision making of individual equity investors by fuzzy analytic hierarchy process, Review of Behavioral Finance, https://www.emerald.com/insight/content/doi/10.1108/RBF-03-2019-0044/full/html
- Jain, J., N. Walia, S. Gupta, K. Aggarwal, and S. Singh, 2021. A fuzzy analytical hierarchy process framework for stock selection in the Indian stock market, Public Affairs (Wiley).https://doi.org/10.1002/pa.2710
- Jang, H., and J. Lee. 2017. An empirical study on modeling and prediction of Bitcoin prices with Bayesian neural networks based on blockchain information. IEEE Access 6:5427–37. doi:https://doi.org/10.1109/ACCESS.2017.2779181.
- Jozefowicz, R., W. Zaremba, and I. Sutskever. 2015. An empirical exploration of recurrent network architectures, Proceedings of the 32nd International Conference on Machine Learning, 37. Lille, France.
- Jondri, J., R. A., and A. A. Rohmawati. 2018. Bitcoin price prediction by using recurrent neural network. e-Proceeding Engr 5 (2):3682–90.
- Karasu, S., A. Altan, Z. Saraç, and R. Hacioğlu, 2018. Prediction of Bitcoin prices with machine learning methods using time series data, 2018 26th Signal Processing and Communications Applications Conference (SIU), Izmir, Turkey 1–4.
- Kosba, A. E., A. Miller, E. Shi, Z. Wen, and C. Papamanthou, 2016. Hawk: The blockchain model of cryptography and privacy-preserving smart contracts, Proc. 37th IEEE Symp. Secur. Privacy, San Jose, CA. USA, 839–58.
- Krafft, P. M., N. D. Penna, and A. S. Pentland, 2018. An experimental study of cryptocurrency market dynamics, Proc. Conf. Human Factors Compute. Syst. Taipei, Taiwan.
- Lansky, J. 2018. Possible state approaches to cryptocurrencies. Journal of Systems Integration 9 (1):19–31. doi:https://doi.org/10.20470/jsi.v9i1.335.
- Li, W. C., and J. T. Jeng. 2010. The prediction and investitive decision systems for stock price with support vector machine and fuzzy theory. International Journal of Intelligent Systems Science and Technology 2 (2):21–28.
- Li, X.-Y.-Y., C.-Y. Xiong, C.-Y. Duan, and H.-C. Liu. 2019. Failure mode and effect analysis using interval type-2 fuzzy sets and fuzzy Petri nets. Journal of Intelligent & Fuzzy Systems 37 (1):693–709. doi:https://doi.org/10.3233/JIFS-181133.
- Lin, C. Y., and C. Y. Chiang Lin. 2009. Development and empirical tests of a generalized back-testing system based on technical indicator strategies,” Master Thesis, Institute of Finance and Information, National Kaohsiung University of Applied Sciences, Kaohsiung, Taiwan.
- Nakamoto, S. 2009. Bitcoin: A peer-to-peer electronic cash system. [Online]. Available: http://www.bitcoin.org/bitcoin.pdf
- Papageorgiou, E. I., K. Aggelopoulou, T. A. Gemtos, and G. D. Nanos. 2018. Development and evaluation of a fuzzy inference system and neuro-fuzzy inference system for grading apple quality. Applied Artificial Intelligence 32 ((3)):253–80. doi:https://doi.org/10.1080/08839514.2018.1448072.
- Robidoux, R., H. P. Xu, L. D. Xing, and M. C. Zhou. 2010. Automated modeling of dynamic reliability block diagrams using colored Petri nets. IEEE Transactions on Systems, Man and Cybernetics, Part A: Systems and Humans 40 (2):337–51. doi:https://doi.org/10.1109/TSMCA.2009.2034837.
- Saad, M., J. Choi, D. Nyang, J. Kim, and A. Mohaisen. 2020. Toward characterizing blockchain-based cryptocurrencies for highly accurate predictions. IEEE Systems Journal 14 (1):321–32. doi:https://doi.org/10.1109/JSYST.2019.2927707.
- Shen, R. K., C. Y. Yang, V. R. L. Shen, W. C. Li, and T.-S. Chen. 2018. A stock market prediction system based on high-level fuzzy Petri nets. International Journal of Uncertainty, Fuzziness and Knowledge-Based Systems 26 ((5)):771–808. doi:https://doi.org/10.1142/S0218488518500356.
- Shen, V. R. L. 2003. Reinforcement learning for high-level fuzzy Petri nets. IEEE Transactions on Systems, Man, and Cybernetics, Part B: Cybernetics 33 (2):351–62. doi:https://doi.org/10.1109/TSMCB.2003.810448.
- Shen, V. R. L. 2006. Knowledge representation using high-level fuzzy Petri nets. IEEE Transactions on Systems, Man and Cybernetics, Part A: Systems and Humans 40 (6):1220–27. doi:https://doi.org/10.1109/TSMCA.2006.878968.
- Singh, S., N. Walia, P. Panda, and S. Gupta, 2021. Risk-managed momentum: An evidence from Indian stock market, FIIB Business Review, https://journals.sagepub.com/doi/10.1177/23197145211023001
- Wirawan, I. M., T. Widiyaningtyas, and M. M. Hasan. 2019. Short term prediction on Bitcoin price using ARIMA method, 2019 International Seminar on Application for Technology of Information and Communication (iSemantic), 260–65. Semarang: Indonesia.
- Yahoo, 2020. Yahoo Finance, [online] Available: https://finance.yahoo.com/
- Yu, S. W., and C. H. Kuo. 2004. The application of genetic algorithm and fuzzy theory to investment strategies of Taiwan stock index futures. Chinese Management Review 7 (2):136–48.