
 ?Mathematical formulae have been encoded as MathML and are displayed in this HTML version using MathJax in order to improve their display. Uncheck the box to turn MathJax off. This feature requires Javascript. Click on a formula to zoom.
ABSTRACT
Crop yield prediction is an important aspect of agriculture. The timely and accurate crop yield predictions can be of great help for policy makers and farmers in planning and decision making. Generally, statistical models are employed to predict the crop yield which is time consuming and tedious. Emerging trends of deep learning and machine learning has come up as a major breakthrough in the arena. Deep learning models have the inherent ability to perform feature extraction in large dataset thus more suitable for predictions. In this paper, a deep learning-based Recurrent Neural Network (RNN) model is employed to predict wheat crop yield of northern region of India. The present study also employed LSTM to unravel the vanishing gradient problem inherent in RNN model. Experiments were conducted using 43 years benchmark dataset and proposed model results were compared with three machine learning models. Evidently, the results obtained from RNN-LSTM model(RMSE: 147.12,MAE: 60.50), Artificial Neural Network(RMSE: 732.14,MAE: 623.13), Random Forest (RMSE: 540.88, MAE: 449.36) and Multivariate Linear Regression (RMSE: 915.64,MAE: 796.07), proved the efficacy of model. Also, predicted crop yield values were found to be more close to true values for RNN-LSTM model proving efficiency of the proposed work.
Introduction
The growing population of the world is posing a big problem for the human kind in the form of availability of food for all. Agricultural scientists all over the world are trying to discover means of enhancing the yield of major food crops with minimum degradation of natural resources popularly known as sustainable farming (Tyagi Citation2016). Wheat, rice, and maize constitute predominant sources of nutrition worldwide and thus have attracted major attention of the research community to increase their productivity in the face of high food prices, climatic changes and natural resource depletion. The ever growing demand of wheat and the unexpected environmental fluctuations is making it further important to increase its production. As per Food and Agriculture Organization (FAO), there is an expected rise in demand for wheat by 60% by the middle of 21st century owing to its increasing use in various staple foods of the world (Lipper et al. Citation2014). An accurate and timely prediction of crop yield can be of great help for the farmers as they can better assess the potential risks in future and can accurately guide the farmers in taking timely actions for the improvement of yield.
The developments in the field of data science, sensor technology and machine learning have raised hopes for the farmers to find better and effective ways of improving the productions. Various machine learning (ML) models have already been explored in different fields of agriculture such as in crop yield prediction and in assessing the effect of various climatic factors and agricultural practices on overall production of the crop (Jain et al., Citation2019; Majumder et al. Citation2018). Crop yield prediction is a multifaceted study consisting of diverse natured controlled and uncontrolled factors. The uncontrolled factors include climatic factors (temperature, humidity, wind speed) and soil characteristics (soil ph, soil texture) whereas controlled factors comprise various farm practices adopted by farmers such as selecting the type of seeds and fertilizers to be used, frequency of irrigations done on the field and other such decisions taken during the crop cultivation. These factors exhibit nonlinear relationship among themselves and with the crop yield and emphasize the need of techniques, which can predict with precision despite such complex behaviors being involved in the study. Artificial Neural Network (ANN), one of the machine learning models, have inherent capability of dealing with such nonlinear behaviors and thus have become the primary choice of many researchers for the study. The results obtained in various studies have proven the fact that neural networks have a very promising future in the field of crop yield prediction.
Recent advancements in neural networks in the form of deep learning have shown better learning abilities and thus can assure higher precision and performance in the field of crop yield prediction. Deep learning models have a big edge over machine learning models due to their in-built capability of feature learning. Through this, the models are able to perform automatic extraction of features from raw data, and the features of higher layers get generated by configuration of lower level features (LeCun, Bengio, and Hinton Citation2015). Extensive hierarchal structure and excellent learning ability of deep learning models permit them to implement classification and prediction appreciably well (Pan and Yang Citation2010). Depending upon the architecture of deep learning model, different components are used such as pooling and fully connected layers, convolutions, memory cells, gates, activation functions, encoding/decoding schemes to name a few. Although deep learning has shown remarkable results in various domains but its use in the field of agriculture is recently gaining popularity. The subsequent section (Section 2) describes various researches done in the field of crop yield prediction using machine learning and deep learning models.
Related Work
The machine learning (ML) techniques have been extensively used for crop yield estimation by various researchers and promising results have been obtained. In one of the studies, a comparative analysis was done among different ML techniques (Multiple linear regression, M5-Prime regression tree, perceptron multilayer neural networks, support vector regression and k-nearest neighbor) for crop yield estimation of ten varieties of crops (González Sánchez, Frausto Solís, and Ojeda Bustamante Citation2014). M5-prime regression model reported lowest errors in yield estimation for majority of crops and was thus found to be the most efficient among all studied models. In another study, Random Forest (RF) model was evaluated for crop yield estimation of wheat, maize and potato crop with multiple linear regression (MLR) method taken as the benchmark for comparison (Jeong et al. Citation2016). RF model was found to outperform MLR model in all performance statistics used for comparison. However, the RF model was found to show loss in accuracies beyond the boundaries of training data. The effect of phenological phases of plant growth on yield of crop was reviewed by researchers in a study (Zhang et al. Citation2018) . Hyperspectral information obtained was studied for finding the contribution of different phenological phases of plant growth on final yield of crop. Support vector machine learning model with weighted spectral data was found to give good accuracies for the predictions. Sustainable agriculture practices, one of the necessities in the present times, require that the increase in the yield of crop should have minimal impact on the environment and natural resources. In this direction, a study was done to evaluate the efficiency of machine learning approaches for crop yield and nitrogen status estimation using remote sensing data (Chlingaryan, Sukkarieh, and Whelan Citation2018). The study identified that the fusion of sensor technology with machine learning models can increase the efficiency and accuracy of models. Least square Support vector machine was found best for nitrogen estimation whereas M5-Prime regression tree was found to be most efficient for crop yield estimation among all machine learning models, ANN has been found to be one of the most preferred model used for crop yield estimation (Bali and Singla Citation2021). In one of the studies, default ANN (D-ANN) model with one hidden layer was compared with MLR and customized ANN(C-ANN) model for wheat crop yield prediction (Shastry, Sanjay, and Deshmukh Citation2016). The C-ANN model was customized by varying different hyperparameters used in the model like number of neurons in hidden layers, number of layers and learning rate. The C-ANN model was reported to be more efficient than the D-ANN and MLR models with high values of R2 and lower values of percentage errors for the former. ANN was evaluated in another study for rice crop yield prediction in various districts of Maharashtra, India (Gandhi, Petkar, and Armstrong Citation2016). Various environmental factors like precipitation, minimum and maximum temperature, crop evapotranspiration, and average temperature were used in the study to find their impact on final yield of the crop. The algorithm reported accuracy of 97.54%, sensitivity of 96.33%, and specificity of 98.12%. Similar results were reported in another study done for forecasting the yield of maize crop using ANN (Singh Citation2008) . Various non-climatic factors were used as predictors in the model and the proposed model was found to outperform MLR model used for comparison. Supervised self organizing maps were used in a study to capture online soil conditions and spectral crop growth characteristics affecting final yield of wheat crop (Pantazi et al. Citation2016). Three models: Supervised Kohonen Networks (SKNs), counter-propagation ANN (CP-ANNs), XY-fused Networks (XY-Fs) were compared for yield prediction accuracy in single cropping season. The average overall accuracy for SKN, CP-ANN, and XY-F was 81.65%, 78.3%, and 80.92%, respectively, proving the supremacy of SKN model over other predicting models. Spiking Neural network (SNN), an advanced generation of neural networks, was used in a study for wheat crop yield prediction (Bose et al. Citation2016). An SNN architecture, NeuCube, was adapted to be used on remote sensing data for capturing spatial and temporal variations and for crop prediction. The proposed model was found to outperform other prediction models in accuracy. In another study, crop prediction methodology was used to predict the type of crop to be sown based on the characteristics of soil and environmental parameters using ANN (Dahikar and Rode Citation2014). The supremacy of ANN was proved in yet another study done in Chine for rice crop yield prediction (Ji et al. Citation2007). The R2 and RMSE values obtained for ANN were 0.67 and 891 in comparison to 0.52 and 1977 obtained from linear regression model. Similar results were obtained in another study done to predict soybean and corn yield using ANN model (Kaul, Hill, and Walthall Citation2005).
The success of ANN models in the field of crop yield prediction motivated many researchers to explore areas of advanced neural networks like deep learning in the field. The advancements in the field of remote sensing has made possible availability of huge amounts of data in the form of images. One of the deep learning models, Convolutional Neural Networks (CNN), hold the ability and efficiency of working on large image data sets and thus has been extensively used by various researchers in classification and prediction of various crops. In one of the studies, CNN model was used for the prediction of soybean crop yield (You et al. Citation2017). The novelty of the proposed model was that a dimensionality reduction technique was used helping the model in doing training and predictions even in the areas of scarce data. Also, a Gaussian process component was added to the model that helped in structuring the spatio temporal data and increase the accuracy of the model. In another study, CNN technique was used for estimation of yields of orchards based on the images taken at various stages of plant growth. CNN was used to create an object detector which could extract areas from image that represent fruits (Fourie, Hsiao, and Werner Citation2017). Similar study was done in an apple orchard for fruit detection and counting using CNN model (Bargoti and Underwood Citation2017). The estimation done when compared with actual post harvest count of fruit showed very close results proving the accuracy of the proposed model. In another study, images of leaves of plant were used to estimate the yield of Bitter melon crop (Villanueva and Salenga Citation2018). Deep learning models require extensive amounts of data. The concept of transfer learning was used in one of the studies to fulfill the requirement of large dataset for deep learning, and the results have shown the technique to be a promising solution for huge data requirements (Wang et al. Citation2018). Different deep learning models are explored and their efficiencies and effectiveness in the area of crop yield prediction has been established by various researches, but one of the models, Recurrent neural networks (RNN) and LSTM (a form of RNN) have been particularly found to be very efficient in the studies owing to its efficiency in dealing with time series data. Crop yield prediction being a field totally dependent on time series data becomes a perfect class of problem that can be dealt efficiently with RNN. Few recent researches have already been done with the technique being used in the said area and very promising results have also been obtained. In one of the studies, a fusion of CNN with LSTM model was used on raw imagery data to estimate yield of wheat crop (Sharma, Rai, and Krishnan Citation2020). The proposed model was found to beat the conventional methods of crop yield prediction in accuracy by 74% and other deep learning models by 50%. Another study was done to compare the performance of feed forward neural network with RNN model for wheat crop yield prediction (Sivanandhini, Scholar, and Prakash Citation2020). RMSE and losses incurred were used as the metrics for comparison. RNN model was found to show much better performance in comparison with normal feedforward network. In another study, preseason yield prediction for soybean and maize crop was done using Neural network model based on the soil and climatic data (Oliveira et al. Citation2018). In this study, the static soil data were fed through fully-connected layers whereas dynamic weather data was fed through recurrent LSTM layers. The proposed model was found to provide comparable results to established methods of yield estimation. LSTM model was used in another study to predict corn yield in Iowa state (Jiang et al. Citation2018). The model was found to give promising results proving the efficiency of recurrent neural networks in the area of crop yield prediction. In another study, LSTM model was employed for wheat crop yield prediction (Haider et al., Citation2019). The proposed model provided better accuracies and recommended the use of data preprocessing using some smoothening function to be merged with LSTM model for increasing the efficiency of the model. In another study, the intelligence of reinforcement learning was combined with the deep learning model to improve the accuracy of model for wheat crop yield prediction. The Q-learning network, which is the reinforcement agent, was used to set the environment for yield prediction based on input parameters. The output of the RNN model was mapped with the Q-values and based on the aggregate score obtained by the agent for various actions, the errors were minimized and accuracy of model was maximized. The proposed model reported a good accuracy of 93.7% over the existing models (Elavarasan and Vincent Citation2020). In another study, authors compared the efficiency of Random Forest Regressor, XGBoost Classifier, KNN classifier, and Logistic Regression for crop yield prediction and LSTM and simple RNN for rainfall and temperature predictions (Nigam et al. Citation2019). Random Forest was found to give maximum accuracy (67.8%) for yield predictions. LSTM model and Simple RNN models presented good prediction results for temperature and rainfall respectively. In another study, comparative analysis was done among three techniques, ANN, CNN, and RNN with LSTM to check the efficacy of models for crop yield prediction (Dharani et al. Citation2021). CNN was found to produce better accuracy than ANN and RNN with LSTM was found to outperform all other techniques with an accuracy of 89%. In another study, a CNN-RNN model was proposed for soybean and corn yield prediction in United States (Khaki, Wang, and SV Citation2020).The salient features of the proposed model include ability to capture temporal variations of environment and seed improvements without prior knowledge of seed genotype and to do predictions on unseen data. The proposed model could also explain the contributions of various weather variations and management practices to the final yield of crop.
The motivation for the present study emerged from the fact that RNN is one of the latest, prevailing and promising techniques gaining acceptance in various domains and is yet to be fully explored in the field of crop yield prediction. In this study, based on the previous year’s weather and yield data, predictions for future years is done using an RNN model. For comparative analysis, the results were compared with those obtained by applying three machine learning models, ANN, Multivariate Linear Regression and Random Forest.
The further organization of paper is as follows: In section III, materials and methods will be explained followed by methodology discussed in section IV. Various experiments conducted and results obtained are presented in section V followed by discussion and conclusion of the study presented in section VI.
Materials and Methods
Data Source
The present work is focused on one of the important agriculture-based districts of Punjab, Ludhiana. The district can be located at the latitude and longitude coordinates of 30.900965 and 75.857277, respectively, with GPS coordinates of 30° 54ʹ 3.4740” N and 75° 51ʹ 26.1972” E. shows the spatial information of Ludhiana district of Punjab, India.
Figure 1. Spatial information of Ludhiana, Punjab, India. (Ludhiana District, Citation2021)
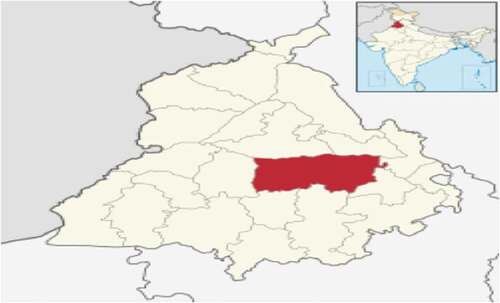
The climate of this region is warm and temperate with an average temperature of 23.5°C and an annual rainfall of 876 mm. In comparison with the winters, there is more rainfall in summers in the region driest month being November (Data, Citation2021). Wheat has been an important cultivated crop in the region. Almost 2.57 lac ha of the cultivated area is devoted to wheat crop cultivation which amounts to 50.26 qt/ha of productivity of the crop from the district. In spite of being one of the important regions of wheat cultivation, there is not much use of advanced techniques for crop yield estimation. Most of the studies already done employed statistical techniques for the crop yield predictions. According to the census 2011 by Govt. of India for the Punjab state, Ludhiana district has shown the highest population among all the other districts of Punjab which further emphasize the need for an efficient and timely prediction of crop yield for the region (Districts of Punjab, Citation2021). This will help the farmers in taking timely decisions and increase the production of their crop. The yield data used in the study was obtained from statistical abstract of Punjab issued by Economic advisor to Government, Punjab whereas the weather data was taken from meteorological department of Punjab. In present study, an extensive dataset of 43 years (1970 to 2012) have been used. Various important climatic factors like minimum and maximum temperature, minimum and maximum relative humidity, rainfall, evaporation, wind direction and speed and solar radiation were considered in the study. Wheat crop cultivation is done from the month of October (sowing) to the month of April(harvesting). In our study also, we targeted the respective months and extracted data belonging to these months for both climate and yield. The sample of the dataset used in experiments is given in .
Table 1. Sample dataset used for few years for certain predictor variables
Prediction Models
In the present study, a deep learning model: Recurrent Neural Network (RNN) with LSTM have been used for yield prediction and the results obtained were compared with those attained from three machine learning models: ANN, Multivariate Linear Regression (MLR) and Random Forest (RF). In the following section, all the models are briefly explained.
Recurrent Neural Networks with LSTM
ANN is one of the most popular supervised machine learning models used in the study involving nonlinear behaviors. The architecture of neural networks have considerable variations from models with one neuron to the ones with multiple layers each having number of neurons, popularly known as deep learning models.
Recurrent Neural Networks (RNN) are a special type of ANN particularly useful in dealing with time series data. A simple architecture of an RNN model is shown in .
Figure 2. Simple RNN model architecture.
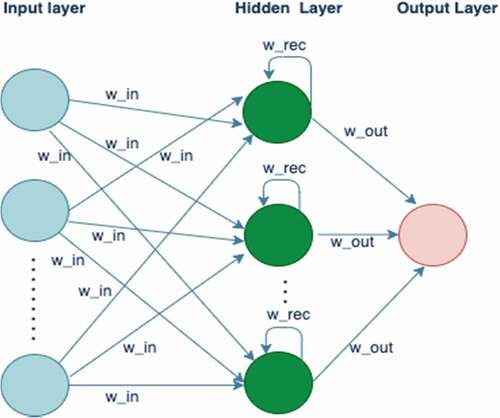
The basic structure of RNN is similar to the ANN with a difference that at every step the results of the previous step are also entered as input along with the new input. In other words, the hidden layer not only takes input from prior layer but also uses its own previous value for producing output for next layer. EquationEquations 1(1)
(1) and Equation2
(2)
(2) represent the structure of a simple recurrent unit or Elman unit (Tan et al. Citation2016).
where is the hidden layer vector at time t
Wxh is the weight of input to hidden layer
xt. is the input at time t
Whh is the weight of hidden layer to hidden layer
ht-1 is the hidden layer input for time t-1
bh is the bias term
σ is the activation function
T represents the size of input vector
yt is the output generated at time t
W0 is the output weight
b0 is the bias term for output
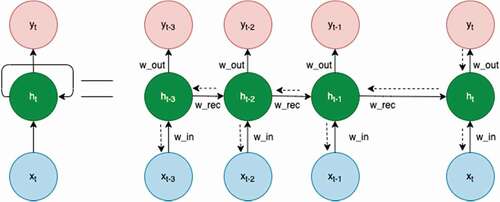
RNNs are the first of their kind neural networks that have the ability to memorize the result of previous step and use it as input to the next step. This feature is particularly useful while dealing with time series data with long term dependencies. This helps RNN to have a much deeper understanding of a sequential data and its context in comparison to other algorithms. shows how the RNN is unrolled during a particular time step.
Figure 3. RNN as a sequence of neural networks.
Although RNNs are quite efficient but they suffer from the problems of exploding and vanishing gradients. In exploding gradient, the algorithm unnecessarily assigns higher weights to the inputs whereas in case of vanishing gradients, the gradients become too small and after some iterations the model stops learning (Jiang et al. Citation2018). The problem of exploding gradient can be solved by squashing the gradients but for vanishing gradient problem, LSTMs are one of the best solutions. LSTM networks are a special form of RNN that contain long short term memory cells which help the RNN to remember the last output for a longer period of time. shows the structure of a LSTM neuron. Stacks of LSTM layers are used as internal layers of RNN to increase its efficiency.
Figure 4. Structure of LSTM neuron.
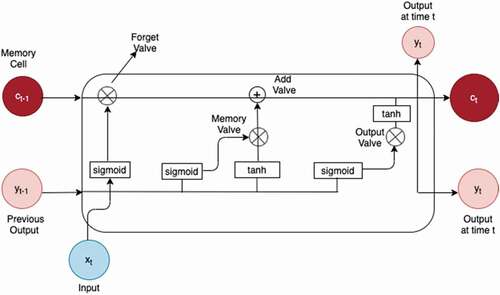
LSTM can read, write, and delete the information from memory cells controlled by specific gates. These gates are like binary classifiers that decide what portion of previous values to retain and what to discard. Three types of gates exist in LSTM: input gate, which decides whether the new input should be added, forget gate to check whether to delete the already existing information as it is no more needed and the output gate to allow the new information to have an impact on output for current timestep. The cell state at any time t represents the information currently stored in memory after the previous time step. EquationEquations 3(3)
(3) to 7 are the mathematical expressions governing the working of forget gate, input/update gate, output gate, current cell state, and final hidden state, respectively (Weiss, Goldberg, and Yahav Citation2018).
ft, it, and ot are the forget gate, input gate, and output gate, respectively. ct is the cell state given by weighted sum of previous cell state and the SimpleRNN weighted by forget gate ft and input gate it respectively. The cell state is offered possibility to remember its old state (ct-1) and thus helps in better learning of long term dependencies. σ represents the sigmoid activation function that controls the working of each gate. W represents the weight vectors corresponding to different gates. Finally, ht is the hidden state which is the squash of the cell state with the output gate as it controls what values to pass through to next layer. fc and fh represent the activation functions used in cell state and hidden state respectively and is by default tanh for LSTM cells.
Machine Learning Models Used for Comparison
For comparative purposes, three machine learning models, ANN, Random Forest (RF) and Multivariate Linear Regression (MLR) were employed for the predictions. ANN is a machine learning model in which the machine is made to behave and learn like a human brain (Gandhi, Petkar, and Armstrong Citation2016). The model consists of layers of neurons that pass information from input layer to final output layer and in the process perform training of the model through some algorithm. Based on the training attained by the model, it is made to perform predictions on unseen data. Multivariate Linear Regression is a type of supervised machine learning model in which an equation is fit using various predictors as independent variables and target value as dependent variable. For n values of predictors, target values are obtained and model is trained to find the best fit line given by Equationequation 8(8)
(8) .
where x is input variable and y is output or target variable.
: intercept
: Coefficient of
Random Forest is another machine learning model based on combination of various decision tree algorithms for classification and prediction problems. A prediction done through random forest for a regression problem is the average of predictions for all the randomized trees in the ensemble. To make a prediction at a new point x:
where Tb is the bth tree in Random Forest and B is the maximum number of trees
Performance Metrics
For validation of results obtained from any machine learning model, various performance metrics are used. In our study we used, three performance metrices, Mean Squared Error (MSE), Mean Absolute Error (MAE) and Root Mean Squared Error (RMSE). Mean absolute error is the average of all absolute errors between paired observations expressing the same phenomenon. Root Mean Squared Error is rooted average of squared errors and Mean Squared error is the mean of squared errors (González Sánchez, Frausto Solís, and Ojeda Bustamante Citation2014).
Methodology
The methodology used in the study is shown in . As the collected data belonged to different sources, the primary task was to put the data in a form that can be fed to python for analysis. Thus, a csv file was generated with 64 features and 43 rows. The 64 features refer to wheat crop yield and the values of 9 environmental factors (already mentioned in subsection 3.1) for the seven months of wheat cultivation (October to April) taken as predictor variables. Rows refer to the total number of years (43) selected for the study. Various steps shown in methodology are briefly explained in the subsequent sections.
Figure 5. Methodology adopted to predict wheat crop yield.
Step 1: Data Preprocessing
Before application of any machine learning or deep learning model on a dataset, some preprocessing need to be done. Data were first scrutinized to check for the presence of any non-numeric data or any missing values. There were no non-numeric entries and the missing entries were duly filled with appropriate statistical values for example the wind speed for the month of October for the year 2012 was missing, which was taken as the mean value for the whole year. The final dataset was normalized to bring all the values within a consistent range. EquationEquation 7(7)
(7) shows the formulae used for normalization of data.
Where X is a data value.
The processed data was finally split into test and train data in the ratio of 2:8. The train data was given as input to train the prediction model and was validated using the test data.
Step 2: Train the Prediction Model
The processed data obtained in step 1 was fed to the RNN with LSTM prediction model (as discussed in section 2.2.1). Multiple LSTM layers were added as hidden layers to increase the robustness of simple RNN model. Addition of LSTM layers is also a solution to vanishing gradient problem inherent in RNN models. With the advantage of LSTM layers and the special ability of RNN model to learn from previous timestep, the future crop yield was predicted. The iterations were selected optimally based on the minimization of losses.
Step 3: Validation of the Prediction Model
The predicted output obtained in step 2 for test data was compared with the actual crop yield data. The three performance metrics: RMSE, MAE, and MSE were computed to measure the performance of the prediction model.
Experiment and Results
To validate the efficiency of RNN with LSTM model, multiple experiments were carried out in python using Anaconda platform. The results obtained from RNN with LSTM model were compared with those obtained from ANN, Random Forest (RF) and Multivariate Linear Regression (MLR). summarizes the experimental settings and hyperparameters used in various models. The experimental settings and results obtained with all the models are discussed in the subsequent sections.
Table 2. Summary of experimental settings and hyperparameters used in various models used in study
Results from RNN with LSTM Model
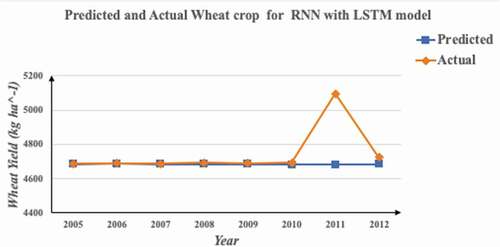
The RNN model used in the study was not a Simple RNN model but a robust LSTM model with stacks of LSTM layers added as hidden layers. As required for any machine learning model, the data were split into test and train data in the ratio of 2:8 i.e. 80% of data was used for training the model and 20% of the data was kept for testing. Accordingly, the model was trained on the yield and environmental data of 34 years, which was from the year 1970 to 2003 and based on the trainings and correlations identified or captured by the LSTM model, predictions of wheat crop yield for subsequent 9 years was done. As we used RNN model, the preferred way for feature scaling, normalization, was applied on the data. A special property of every RNN model is that it uses a timestep to learn and based on the trends learnt, it predicts the next output. In our model, we used a time step of 20 years which means the model learnt from previous 20 years and predicted the yield of subsequent years. The model consisted of four LSTM layers and one output dense layer. For each LSTM layer, 50 neurons were used and a dropout regularization of 0.2 was applied to avoid overfitting of the model. adam optimizer was used for minimizing the losses incurred. 200 epochs in a batch size of 20 were found to be optimal for training the model with minimum losses. The predicted and actual yields of wheat crop as obtained from test data of various years is as shown in and .
Table 3. Predicted and actual yields of wheat crop for RNN with LSTM model
Figure 6. Graphical analysis of predicted and actual values of yield for RNN model.
The results obtained were evaluated on various evaluation metrics, and the values obtained have been tabulated in .
Table 4. Performance metrics for RNN with LSTM model
For comparative reasons, three machine learning models, ANN, Linear regression and random forest were used on the same data and following subsections discuss the experiment and results obtained for these techniques.
Results from ANN Model
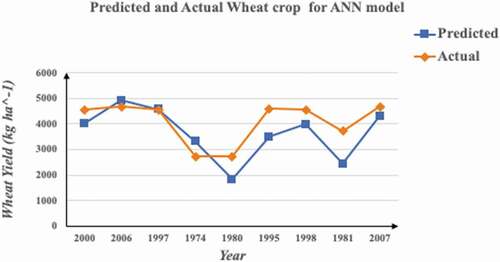
The ANN used for the study consisted of one input layer, two hidden layers and one output layer. The sequential function of python library was used to design the network layer by layer. Stochastics Gradient Descent algorithm was used for training the model and Rectified Activation function (Relu), one of the most recommended activation function for nonlinear studies, was used in input and hidden layers (Sharma and Sharma Citation2017). A total of 300 epochs in a batch size of 10 were found to be the best for training the model with minimum losses. The predictions done as observed from the test data are as shown in and .
Table 5. Predicted and actual yields of wheat crop for ANN model
Figure 7. Graphical analysis of predicted and actual values for ANN model.
The values of various evaluation metrics obtained have been tabulated in .
Table 6. Performance metrics for ANN model
Results from Random Forest Model
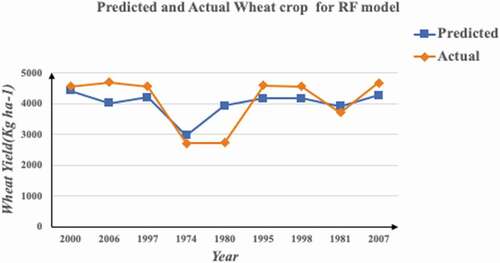
The complete data of 43 years comprising 63 parameters were fed to Random Forest model for prediction of yield. The data were split into 2:8 ratio, i.e., 80% of data was used for training of the model and 20% was used for testing. The predicted and actual yield obtained on test data for the Random Forest model are given in and .
Table 7. Predicted and actual yields of wheat crop for RF model
Figure 8. Graphical analysis of predicted and actual values for RF model.
The values of evaluation metrics for random forest model are shown in .
Table 8. Performance metrics for random forest model
Results for Multivariate Linear Regression (MLR) Model
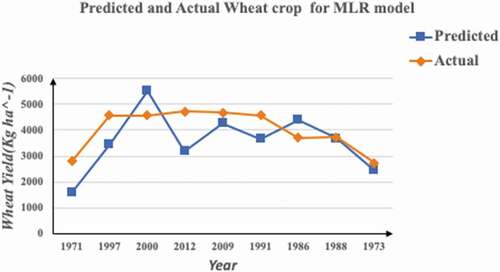
In linear regression model, 63 environmental factors comprising maximum and minimum temperature, maximum and minimum Relative humidity, evaporation, wind speed and direction and solar radiation for the wheat cultivation months from October to April were taken as independent variables and yield was taken as dependent variable. Data were selected randomly for training of the model. The predicted and actual yield obtained on test data for the model are given in and .
Table 9. Predicted and actual yields of wheat crop for MLR model
Figure 9. Graphical analysis of predicted and actual values for MLR model.
The values of evaluation metrics for regression model are shown in .
Table 10. Performance metrics for multivariate linear regression model
Conclusion and Discussion
Various inferences have been drawn based on the experimental results obtained and has been discussed in subsequent subsection. The conclusion drawn from the present study and future scope is presented in following subsection i.e. Section 6.2.
Discussion
1. On comparing the predicted and actual crop yield values for all the models used in the study, the values were found to be quite close in case of RNN with LSTM model (, section 5.1) as compared to other machine learning models which proves that the ability of RNN and especially LSTM to use the results of previous time step for the next prediction has helped the model in providing close predictions. This nearness of predicted values to actual values can be very helpful for the farmers for making the correct assessment of the yields they can expect from their crop and accordingly can help them in well rating their crops. It can also help the government in formulating right policies and in taking required remedial measures in the case of any estimated risk.
2. Among various machine learning models, Multivariate Linear Regression (MLR) has shown higher values of errors, specifically MSE, as compared to ANN and Random Forest as shown in . The reason for this can be the involvement of multiple and diverse climatic factors in the study of crop yield prediction. These factors exhibit nonlinear behaviors, which are difficult to be captured by MLR model making the latter inefficient for yield prediction.
Table 11. Performance metrics for different techniques
3. Among the three machine learning models, Random Forest model was found to give minimum values of errors for all performance metrics used which is in alignment with the results obtained in one of the studies (Nigam et al. Citation2019). Also, the values of all the evaluation metrics is considerably low in case of recurrent neural network as compared to all other machine learning models, which clearly shows the efficiency of deep learning models over machine learning models for crop yield prediction.
Conclusion
The present study was done with an objective to find an efficient deep learning technique in the field of wheat crop yield prediction. The study was targeted on one of the prime regions of Punjab as till date, only statistical tools were used for the study of crop yield prediction in the region which was time consuming and could not help farmers and government for in time decision making. The selection of RNN-LSTM model for the study was a deliberate attempt owing to the established competence of RNN with LSTM in dealing with time series data. LSTM (Long Short Term Memory) models have given an extra edge to RNN as LSTM provides a solution to the vanishing gradient problem occurring in RNN technique. The prediction results obtained from various techniques were evaluated on the basis of standard performance evaluation metrics. The present study focused on one of the areas of Punjab, India but the study can be extended to more agriculture-based regions. The government can get future estimates for upcoming years in different regions of India, which can help in planning and making policies to meet the food requirements of the country. Also, other deep learning models can be explored in further studies to improve the efficacy and analysis.
Declarations
Funding This research did not receive any specific grant from funding agencies in the public, commercial, or not-for-profit sectors.
Availability Of Data
The data that has been used is confidential.
Authors’ Contributions
All authors contributed to the study as follows.
Nishu Bali: Conceptualization, original Draft preparation, Literature search, Reviewing and editing the drafts.
Anshu Singla: Supervision and Guidance, Suggestions for improvements, Directions, Critically reviewed and revised the work. All authors read and approved the final manuscript.
Disclosure Statement
No potential conflict of interest was reported by the author(s).
References
- Bali, N., and A. Singla. 2021. Emerging trends in machine learning to predict crop yield and study its influential factors: A SURVEY. In Archives of computational methods in engineering, 1–18, Verlag: Springer. doi:https://doi.org/10.1007/s11831-021-09569-8
- Bargoti, S., and J. P. Underwood. 2017. Image segmentation for fruit detection and yield estimation in apple orchards. Journal of Field Robotics 34 (6):1039–60. doi:https://doi.org/10.1002/rob.21699.
- Bose, P., N. K. Kasabov, L. Bruzzone, and R. N. Hartono. 2016. Spiking neural networks for crop yield estimation based on spatiotemporal analysis of image time series. IEEE Transactions on Geoscience and Remote Sensing 54 (11):6563–73. doi:https://doi.org/10.1109/TGRS.2016.2586602.
- Chlingaryan, A., S. Sukkarieh, and B. Whelan. 2018. Machine learning approaches for crop yield prediction and nitrogen status estimation in precision agriculture: A review. Computers and Electronics in Agriculture 151:61–69. doi:https://doi.org/10.1016/j.compag.2018.05.012.
- Dahikar, S. S., and S. V. Rode. 2014. Agricultural crop yield prediction using artificial neural network approach. International Journal of Innovative Research in Electrical, Electronics, Instrumentation and Control Engineering 2 (1):683–86.
- Data, C., Retrieved from, https://en.climate-data.org/asia/india/punjab/ludhiana-889/ on August 1, 2021.
- Dharani, M. K., R. Thamilselvan, P. Natesan, P. C. D. Kalaivaani, and S. Santhoshkumar. February 2021. Review on crop prediction using deep learning techniques. Journal of Physics. Conference Series 1767(1):012026. IOP Publishing.
- Districts of Punjab, Retrieved from, https://www.census2011.co.in/census/state/districtlist/punjab.html on March 12, 2021.
- Elavarasan, D., and P. M. D. Vincent. 2020. Crop yield prediction using deep reinforcement learning model for sustainable agrarian applications. IEEE Access 8: 2020: 86886–901. doi:https://doi.org/10.1109/ACCESS.2020.2992480.
- Fourie, J., J. Hsiao, and A. Werner, (2017). Crop yield estimation using deep learning. 7th Asian-Australasian Conference on Precision Agriculture, NewZealand. DOI:https://doi.org/10.5281/zenodo.893710
- Gandhi, N., O. Petkar, and L. J. Armstrong. 2016. Rice crop yield prediction using artificial neural networks. In Technological Innovations in ICT for Agriculture and Rural Development (TIAR), 105–10. IEEE, Chennai, India. doi:https://doi.org/10.1109/TIAR.2016.7801222.
- González Sánchez, A., J. Frausto Solís, and W. Ojeda Bustamante. 2014. Predictive ability of machine learning methods for massive crop yield prediction. Spanish Journal of Agricultural Research (2171-9292) 12 (2):313–28. doi:https://doi.org/10.5424/sjar/2014122-4439.
- Haider, S. A., S. R. Naqvi, T. Akram, G. A. Umar, A. Shahzad, M. R. Sial, M. Kamran, and M. Kamran. 2019. LSTM neural network based forecasting model for wheat production in Pakistan. Agronomy 9 (2):72. doi:https://doi.org/10.3390/agronomy9020072.
- Jain, A., J. L. Chaudhary, M. K. Beck, and L. Kumar. 2019. Developing regression model to forecast the rice yield at Raipur condition. Journal of Pharmacognosy and Phytochemistry 8 (1):72–76.
- Jeong, J. H., J. P. Resop, N. D. Mueller, D. H. Fleisher, K. Yun, E. E. Butler, S. H. Kim, K.-M. Shim, J. S. Gerber, and V. R. Reddy. 2016. Random forests for global and regional crop yield predictions. PLoS One 11 (6):e0156571. doi:https://doi.org/10.1371/journal.pone.0156571.
- Ji, B., Y. Sun, S. Yang, and J. Wan. 2007. Artificial neural networks for rice yield prediction in mountainous regions. The Journal of Agricultural Science 145 (3):249–61. doi:https://doi.org/10.1017/S0021859606006691.
- Jiang, Z., C. Liu, N. P. Hendricks, B. Ganapathysubramanian, D. J. Hayes, and S. Sarkar,(2018). Predicting county level corn yields using deep long short term memory models. arXiv preprint arXiv:1805.12044.
- Kaul, M., R. L. Hill, and C. Walthall. 2005. Artificial neural networks for corn and soybean yield prediction. Agricultural Systems 85 (1):1–18. doi:https://doi.org/10.1016/j.agsy.2004.07.009.
- Khaki, S., L. Wang, and A. SV. 2020. A CNN-RNN framework for crop yield prediction. Frontiers in Plant Science 10:1750. doi:https://doi.org/10.3389/fpls.2019.01750.
- LeCun, Y., Y. Bengio, and G. Hinton. 2015. Deep learning. Nature 521 (7553):436. doi:https://doi.org/10.1038/nature14539.
- Lipper, L., P. Thornton, B. M. Campbell, T. Baedeker, A. Braimoh, M. Bwalya, R. Hottle, A. Cattaneo, D. Garrity, and K. Henry. 2014. Climate-smart agriculture for food security. Nature Climate Change 4 (12):1068. doi:https://doi.org/10.1038/nclimate2437.
- Ludhiana District, Retrieved from https://en.wikipedia.org/wiki/Ludhiana_district on August 2, 2021
- Majumder, A., P. K. Kingra, R. Setia, S. P. Singh, and B. Pateriya. 2018. Influence of land use/land cover changes on surface temperature and its effect on crop yield in different agro-climatic regions of Indian Punjab. In Geocarto International, 1–24, Taylor & Francis. doi:https://doi.org/10.1080/10106049.2018.1520927.
- Nigam, A., S. Garg, A. Agrawal, and P. Agrawal (2019). “Crop yield prediction using machine learning algorithms,” 2019 Fifth International Conference on Image Information Processing (ICIIP), 2019, pp. 125–30, Shimla, India. doi: https://doi.org/10.1109/ICIIP47207.2019.8985951.
- Oliveira, I., R. L. Cunha, B. Silva, and M. A. Netto (2018). A scalable machine learning system for pre-season agriculture yield forecast. arXiv preprint arXiv:1806.09244.
- Pan, S. J., and Q. Yang. 2010. A survey on transfer learning. IEEE Transactions on Knowledge and Data Engineering 22 (10):1345–59. doi:https://doi.org/10.1109/TKDE.2009.191.
- Pantazi, X. E., D. Moshou, T. Alexandridis, R. L. Whetton, and A. M. Mouazen. 2016. Wheat yield prediction using machine learning and advanced sensing techniques. Computers and Electronics in Agriculture 121:57–65. doi:https://doi.org/10.1016/j.compag.2015.11.018.
- Sharma, S., S. Rai, and N. C. Krishnan (2020). Wheat crop yield prediction using deep LSTM model. arXiv preprint arXiv:2011.01498.
- Sharma, S., and S. Sharma. 2017. Activation functions in neural networks. Towards Data Science 6 (12):310–16.
- Shastry, K. A., H. A. Sanjay, and A. Deshmukh. 2016. A parameter based customized artificial neural network model for crop yield prediction. Journal of Artificial Intelligence 9 (1–3):23–32. doi:https://doi.org/10.3923/jai.2016.23.32.
- Singh, R. K. 2008. Artificial neural network methodology for modelling and forecasting maize crop yield. Agricultural Economics Research Review 21 (347–2016–16813):5–10.
- Sivanandhini, P., P. G. Scholar, and J. Prakash. 2020. Crop yield prediction analysis using feed forward and recurrent neural network. International Journal of Innovative Science and Research Technology 5 (5):1092–96.
- Tan, M., C. D. Santos, B. Xiang, and B. Zhou, 2016. LSTM-based deep learning models for non-factoid answer selection. arXiv 2015, arXiv:1511.04108
- Tyagi, A. C. 2016. Towards a second green revolution. Irrigation and Drainage 65 (4):388–89. doi:https://doi.org/10.1002/ird.2076.
- Villanueva, M. B., and M. L. M. Salenga. 2018. Bitter melon crop yield prediction using machine learning algorithm. (IJACSA) International Journal of Advanced Computer Science and Applications 9:3.
- Wang, A. X., C. Tran, N. Desai, D. Lobell, and S. Ermon. 2018. Deep transfer learning for crop yield prediction with remote sensing data, In Proceedings of the 1st ACM SIGCAS conference on computing and sustainable societies (p. 50) ACM, New York, United States. doi:https://doi.org/10.1145/3209811.3212707.
- Weiss, G., Y. Goldberg, and E. Yahav (2018). On the practical computational power of finite precision rnns for language recognition. arXiv preprint arXiv:1805.04908.
- You, J., X. Li, M. Low, D. Lobell, and S. Ermon. (2017). Deep Gaussian process for crop yield prediction based on remote sensing data. AAAI Conference on Artificial Intelligence (AAAI-17) (pp. 4559–66), San Francisco California, USA.
- Zhang, Y., Q. Qin, H. Ren, Y. Sun, M. Li, T. Zhang, and S. Ren. 2018. Optimal hyperspectral characteristics determination for winter wheat yield prediction. Remote Sensing 10 (12):2015. doi:https://doi.org/10.3390/rs10122015.