
ABSTRACT
Acute kidney injury (AKI) is a sudden onset of kidney damage. Currently, there is no hybrid model predicting AKI that takes advantage of two types of data. In this research, a novel hybrid deep learning architecture for AKI prediction was created using de-identified numeric patient data and ultrasound kidney images. Using data features including serum creatinine among others, two numeric models using MIMIC-III and paired hospital data were developed, and with the hospital ultrasounds, an image-only model was developed. Convolutional neural networks (CNN) were used, including VGG and Resnet, and they were made into a hybrid model by concatenating feature maps of both types of models to create a new input. The hybrid model successfully predicted AKI and the highest AUROC of the model was 0.953, the first time an AKI machine learning model surpassed an AUROC of 0.9. The model also achieved an accuracy of 90% and F1-score of 0.91. This model can be implemented into urgent clinical settings such as the ICU and aid doctors by assessing the risk of AKI shortly after the patient’s admission to the ICU. The implementation of this research has great potential to be applied to different medical predictive applications.
Introduction
Acute kidney injury (AKI) is a sudden onset of kidney damage that happens within a few hours or days when damaged kidneys are unable to filter waste products from the blood (Makris and Spanou Citation2016). AKI is usually an unexpected episode that is hard for doctors to predict if no occurrences of it have happened before. Due to its unforeseeability and consequences, AKI is hard to prepare for and prevent. Once AKI begins, critical care is needed as the disease can be fatal and requires immediate attention, so diagnosis of the condition needs to be performed quickly and accurately. The majority of cases are emergencies that require hospitalization and intensive care unit (ICU) care (Chertow et al. Citation2005, November 1). In fact, in the ICU, AKI patient mortality rate often exceeds 60%. AKI alone in the United States costs more than $10 billion in annual health expenditures (Silver et al. Citation2017).
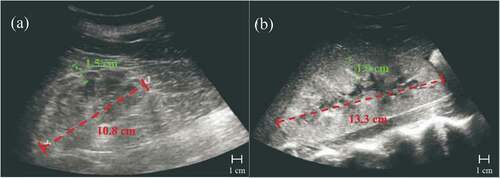
Currently, there is no concrete way to predict future AKI; in clinical practice, doctors can only diagnose it when it has already occurred (Citation18). Doctors perform diagnoses with a variety of data points, including both existing numeric laboratory data and medical images. Generally, doctors use only numeric data for detecting AKI because ultrasound images are more expensive to obtain. Thus, ultrasound images are used for more severe cases and for finding the cause of the AKI. Some types of numeric laboratory measurements include serum creatinine (SCr), blood urea nitrogen (BUN), estimated glomerular filtration rate (eGFR), ultrasound kidney images, and biopsies. As shown in , (A) shows an ultrasound of a healthy kidney and (B) shows an ultrasound of the same kidney but with AKI, both ultrasounds with labeled kidney lengths and parenchymal thicknesses. (B) is 2.5 cm longer in kidney length compared to (A) and is 0.4 cm thicker than (A) in parenchymal thickness. Increased kidney length (red) is a sign of AKI, as it is an indicator of increased renal volume (Faubel et al. Citation2014, February 7). Greater parenchymal thickness (green) is also an indication of AKI. These two symptoms seen in ultrasounds are some of AKI’s indicators, but there are many more, such as the echogenicity of an ultrasound which is shown by lightness or darkness in the ultrasound.
Figure 1. Ultrasound images of a healthy kidney (A) and a kidney with AKI (B). Kidney length (red) and parenchymal thickness (green) are shown and are some AKI indicators.
Previous Related Research
Many recent studies have applied machine learning to medical issues, such as disease detection or prediction, due to the greater performance of machine learning models than humans (Litjens et al. Citation2017, July 26). A deep learning approach (LeCun, Bengio, and Hinton Citation2015, May 27) to predict acute kidney injury is efficient due to the deep learning model’s ability to learn from more patient cases than what an average nephrologist is able to encounter in a lifetime. After training, this hybrid deep learning model would have more experience than a doctor, and can be more accurate when making AKI predictions.
For example, Mohamadlou et al. predicted AKI using the machine learning method of boosted ensembles of decision trees and electronic health record numerical data from the MIMIC-III dataset of Stanford Medical Center and Beth Israel Deaconess Medical Center data (Mohamadlou et al. Citation2018). They concluded that a machine learning AKI prediction tool can determine which patients are likely to suffer from AKI and can allow doctors to start prevention of kidney damage before it is too late. Their machine learning algorithm outperformed the commonly used SOFA score’s specificity and accuracy with only the use of 6 common patient measurements. Another research paper by Tomašev et al. from DeepMind featured a recurrent neural network (RNN) model that could continuously predict AKI up to 48 hours in advance using electronic health record data (Tomašev, Glorot, and Rae et al. Citation2019). They had a special curated dataset consisting of 315 base features of demographics, admission information, vitals, certain lab test results, and chronic conditions associated with higher risk of AKI. Their model had confidence assessments and provided the clinical features that contributed most to each prediction. Also using neural networks in their research, Kuo et al. reported a convolutional neural network (CNN) model that used ultrasound kidney images to predict chronic kidney disease (CKD) (Kuo et al. Citation2019). They predicted creatinine-based eGFR using CNNs and classified ultrasound images for CKD using extreme gradient-boosting trees. The model had classification accuracy of 85.6%, higher than that of experienced nephrologists (60.3–80.1%).
Clearly, significant progress in AKI machine learning has been made by the different research groups mentioned above. However, all of the previous papers are based on one type of kidney data to predict kidney disease. For AKI, there is not yet an ultrasound image data model made yet, most likely due to limited datasets. Previously published research papers that predict AKI with machine or deep learning all employ a single data type model, either one that only inputs health record data or only kidney images, so a hybrid model using both data types has not been proposed before. The reason could again be due to the lack of paired datasets available.
In summary, all previous reports of machine learning models for predicting AKI so far are based on only numeric data, not image data. However, in this research, not only is numeric data used, but the research also explores using image data to predict AKI. Noting the success of Kuo’s CNN image classifier model for CKD, a CNN image classification model was chosen. So far, there is no CNN model for predicting AKI, though there is an RNN using numeric data by Tomašev et al. In addition, this research combines both numeric data and image data in a hybrid prediction model that should be more accurate than any one type of model individually and reflects the situation of a real diagnosis performed by doctors, which brings the accuracy of this predictor higher due to its simulation of a real procedure. The hybrid model uses CNN for each individual model, which are combined into a hybrid model by concatenating feature maps of each model to create a new input. This enters another CNN block and then two fully connected layers, ending in a binary output after running through a Softmax function.
Materials and Methods
Databases
This work involves a hybrid model that requires two types of clinical patient data, numeric and image data. However, there were no such paired datasets of AKI patients available in existing databases, so paired data was obtained directly from hospitals. To increase the sample size of the data, more numerical data from the MIMIC-III (Medical Information Mart for Intensive Care III) Database were used. MIMIC is a de-identified, comprehensive database of Beth Israel Deaconess Medical Center (Boston, MA) patient data from PhysioNet, a repository managed by the MIT Laboratory for Computational Physiology (Johnson et al. Citation2016). Access to the database was obtained after completing a required CITI data ethics course and requesting access to Physionet. From this database, Google BigQuery and SQL scripts were used to query from data tables within the MIMIC dataset because the database was made available for use in BigQuery by the creators. The 16 specific blood biomarkers, vital signs, and demographic data elements extracted for the data features input vector (baseline characteristics) were age, height, weight, BMI group, systolic and diastolic blood pressure, heart rate, respiratory rate, temperature, Glasgow Coma Scale (GCS), serum creatinine (SCr), blood SO2, hemoglobin, blood urea nitrogen (BUN), blood bicarbonate, magnesium, and sodium. Only data from patients’ initial admission into the ICU were used, since the goal was to predict AKI from the start of the ICU stay, before the onset of AKI so that doctors can take preventative measures. Subject_id and icustay_id were used to organize together different data points of the same patient’s ICU admission. The resulting patient cohort that fit all the requirements included 2,532 patients. From the Beijing Hospital of the Ministry of Health in China (BJHMOH), access to data was requested and a paired dataset of 612 de-identified ultrasound kidney images and corresponding numeric patient laboratory measurements were obtained (Jiang et al. Citation2019). The images included 306 positive AKI images and 306 negative AKI images collected in 2016–2020. The ultrasounds of kidneys were cropped so that any unnecessary elements were omitted (some had extra labels and names of the machine e.g. Toshiba). All images were resized to the same resolution of 224 × 224 pixels and made grayscale. In this research, the dataset division was 80% for training and 20% for testing.
In order to further externally validate the model performance in a real clinical environment, clinical data was used to test the hybrid model. This raw clinical data was obtained from a different hospital clinic than the data used to train and test the model. Two hundred paired patient data cases were received from the Third People’s Hospital of Shenzhen (PHSZ) in China after approval (Tan et al. Citation2020, October 15). Although more data are preferred, due to hospital limitations, only 200 paired datasets were available at this time. shows some characteristics of the three datasets used.
Table 1. Summary of dataset characteristics of the three datasets used in this research
For the gold standard of AKI, serum creatinine was used to determine AKI-positive patients. The change of a patient’s serum creatinine levels were measured, using the initial ICU admission serum creatinine as the baseline. According to Kidney Disease: Improving Global Outcomes (KDIGO) guidelines, AKI is defined as an increase in serum creatinine by 0.3 mg/dl within 48 hours, or an increase in serum creatinine to 1.5 times the baseline amount within 7 days (Khwaja Citation2012).
Deep Learning Model Development
As shown in , the research procedure involved obtaining data, preprocessing data, building, training, validating, and testing both numeric and image data models and finally the hybrid model, as well as clinically verifying and testing the hybrid model with different data from the model training data.
Figure 2. Procedure of the proposed research flow including five major steps: 1. dataset selection and access; 2. data preprocessing of two data formats; 3. single data type model development; 4. hybrid model development; and 5. clinical verification.
In this research, three types of models were created: a numeric data model based on numeric data, image data model, and a hybrid model. Four modules were tested to be able to compare the hybrid model results to single-data-type modules and determine if the hybrid model is more effective than a single-data-type module. Module 1 tested only numeric data only from MIMIC. Module 2 tested only numeric data only from the Beijing Hospital. Module 3 tested only image data from the Beijing Hospital. Module 4 tested both numeric and image data with paired datasets from the Beijing Hospital.
Numeric Data Model
The numeric data model was designed by trying both the open-source Visual Geometry Group Network (VGG) and Residual Network (ResNet) neural networks (He et al. Citation2015, December 10; Simonyan and Zisserman Citation2015, April 10). Based on previous research, ResNet-34 was used for its high accuracy and its shorter training time. VGG-16 was used for high accuracy compared to other networks such as GoogLeNet and was easy to find open-source code and implement. The dataset was trained on both ResNet and VGG individually, and ResNet ended up performing much better than VGG. Thus, ResNet was the only neural network used for the final numeric data model.
Image Data Model
For the image data model, only ResNet-50 was selected due to its known high accuracy and performance with image data. In this work, it was not necessary to add in another neural network for ensemble learning because ResNet has a very high performance ability when the input features are images, so much that adding another neural network would improve the performance trivially at best. In each of the three models created, 5-fold cross-validation was used, which is a resampling technique that splits up the data to verify the models’ generalization abilities and avoid overfitting. Additionally, batch normalization in each layer was performed prior to a 2D CNN block to stabilize the input distribution of each layer by decreasing covariate shift, which makes cross-validation less biased.
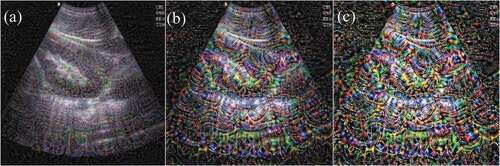
Through Resnet-50 CNN visualization by optimizing pixel values, it is valuable to be able to understand the process of CNN recognizing specific patterns in images and how the CNN understands image features. Shown in , the response of each ResNet network layer to ultrasound images show that the low-level response feature map focuses on different details in the image, while high-dimensional features are local and sparse, which can eliminate irrelevant content and extract important features of the target. As the colors become more saturated, the features become more and more obvious, showing that as the number of network filter layers deepens, the learned features become more and more representative of specific details of the image, highlighting the feature activation locations. Knowing the internal workings of CNN also helped debug the failures and errors of the image model. Visualizing the process of CNN learning is helpful in clarifying deep learning as a “black box,” especially for important medical disease prediction that can affect patient outcomes and impact patient mortality.
Figure 3. Computer-generated images of ultrasound kidney images using different convolutional filters. (A), (B), and (C) are the images after convolutional filters 12, 30, and 48, respectively. The deeper the number of network filter layers, the more saturated the colors and the more obvious the features.
Hybrid Model
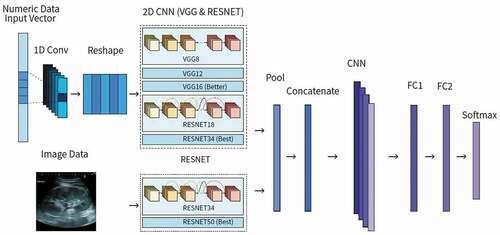
The proposed hybrid model used 18 input data features including ultrasound kidney images, age, height, weight, BMI group, systolic and diastolic blood pressure, heart rate, respiratory rate, temperature, GCS, SCr, blood SO2, BUN, hemoglobin, blood bicarbonate, magnesium, and sodium. To make the hybrid model, two types of data models were fully integrated to achieve good performance and simulate a doctor diagnosing AKI. This hybrid model is flexible and can predict AKI based on data availability, such as only using numeric or only image data. As shown in , each individual data type model was combined into a hybrid model by concatenating feature maps of each model to create a new input. This enters another CNN block and then two fully connected layers, ending in a binary output after running through Softmax. The fully connected layers compute class scores and compile results from the CNN block to form the final output, which enters Softmax, a function that turns the fully connected layers’ logits output into decimal probabilities. Since Softmax outputs decimal probabilities that add up to 1, in this case there are two classes: positive AKI and negative AKI. To make the result more definite and easier to assess the model’s performance, additional code for post-processing results determined that if the probability is less than 0.50, then the patient will not suffer from AKI in the ICU. If the probability is greater or equal to 0.50, then the patient will suffer from AKI in the ICU. Thus, the final output is a binary classification of whether or not the patient will suffer from AKI after ICU admission. In a clinical setting, the model can still output a percentage probability of a patient getting AKI in the future without the additional post-processing code, which can be more useful for doctors than a strictly positive or negative result.
Figure 4. Proposed hybrid deep learning model architecture using both numeric data and image data.
One major challenge was deciding the number of and the most sensitive and specific data features to include. This was resolved by consulting with a nephrologist to determine 17 features that are the most manifested in AKI to extract the most useful features from the numeric data. Another major challenge was trying to improve the accuracy of the image recognition model. To do that, the image data was enhanced by making the ultrasound images uniform in format. The images were flipped into the same orientation, unnecessary words cropped out, and brightened. The model was also improved with dropout to prevent overfitting and increase its generalization ability. ResNet-50 was used for the image model instead of VGG, because it has more network layers and is more accurate than VGG. The greater number of hidden layers solves the problem of gradient attenuation. The last major challenge during research was the difficulty in implementing different data types in a single hybrid model. Our approach was to input both data types into separate models, building models using different algorithms, and then merging the output from each algorithm. Weights were fine-tuned in both the layers before fusion and after fusion. After fusion, CNN continued to be used to find joint features of the individual outputs to output a final result.
Results and Discussion
As mentioned earlier, three types of deep learning models were created in order to evaluate different types of data’s effects on model performance. First, ResNet models were developed by using numeric-formatted data for Model 1. Secondly, a ResNet model was developed using image data, Model 2. Finally, a hybrid model was proposed and developed using paired numeric and image data, Model 3. In this research, three models (numeric, image, and hybrid) were designed and four modules (MIMIC numeric data, BJHMOH numeric data, BJHMOH image data, and BJHMOH paired numeric and image datasets) were tested in order to compare the hybrid model results to single-data-type modules and determine if the hybrid model is more effective than a single-data-type module. shows the summary of the four modules and compares the results of all four modules that used different data sources. Different performance metrics were used, including area under receiver operating characteristic (AUROC), precision, recall, and F1-score. As seen in , the AUROC of the hybrid model was 0.953. This is the highest AUROC of all the modules, since the AUROCs of Modules 1, 2, 3, and 4 were 0.917, 0.910, 0.931, and 0.953 respectively, indicating that compared to numeric and image data models, the hybrid model (Module 4) is the best-performing. This also goes for the other evaluation metrics, recall and F1-score, because Module 4 has a recall of 0.956, greater than the other three recall values of Modules 1, 2, and 3, which were 0.882, 0.894, and 0.907 respectively. The hybrid model’s F1-score was also highest at 0.961, greater than the other modules’ F1-scores of 0.869, 0.916, and 0.926 respective to module number. The results of the tests of the different module types indicate that the hybrid model compared to singular data type models (Modules 1, 2, 3) has higher recall and has higher performance. Though the hybrid model (Module 4) has higher recall, F1-score, and AUROC, it has a lower precision of 0.928 compared to the Module 3 precision of 0.936. This does not have a great impact on the effectiveness of the hybrid model though. The high recall indicates that the hybrid model is capable of mostly correctly identifying true positives and avoiding false negatives, which matters more than the precision because the cost of a false negative far outweighs that of a false positive in a medical predictive situation. Thus, the hybrid model is better than any one of the single-data-type models.
Table 2. Summary of comparison of test set performance metrics of the four modules
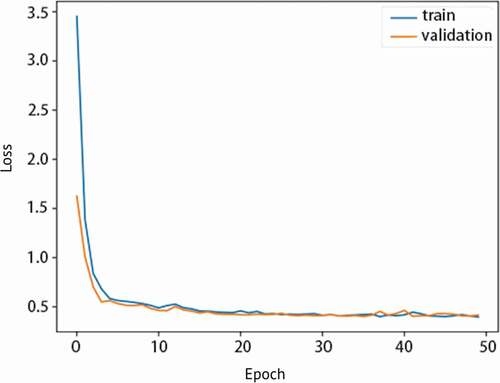
After comparing the hybrid model to other types of data type models, the hybrid model’s specific individual performance results in can be discussed alone. The hybrid model (Module 4)’s test set results have high AUROC meaning it has high performance and is effective in predicting AKI with two types of data. It also has high accuracy, 0.90 as shown in , indicating the model can also correctly predict AKI. shows the hybrid model’s sensitivity vs. specificity and the high AUROC of 0.953. As specificity increases, sensitivity of the model also increases. In , the hybrid model’s precision vs. recall indicates that the model has both less false negatives and false positives due to its high recall and precision. It is a graphical representation of the higher recall and lower precision as mentioned previously. Next, shows that the model is not overfitted and is appropriately fitted to the training data. Proper fitting of the model to the training data ensures that the model can run other datasets just as well as the original training data, and is not molded too closely with the training data. This way, it can accommodate other data from different clinics and still have a generally high performance.
Table 3. Summary of breakdown of performance metrics of Module 4 in
Figure 5. Graph of sensitivity vs. specificity for Module 4.
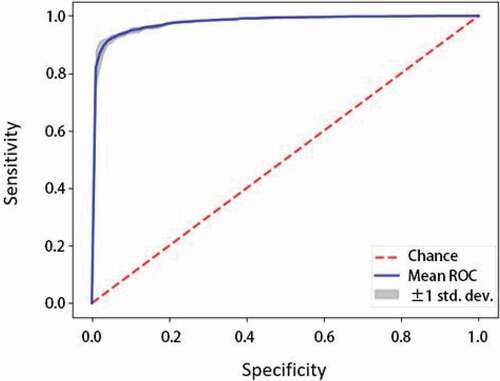
Figure 6. Graph of precision vs. recall for Module 4 showing the high precision and recall.
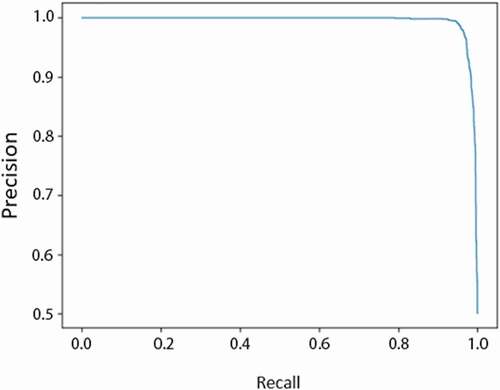
Figure 7. Graph of loss vs. epoch for Module 4 showing the training and validation losses and no overfitting.
This proposed research has also been compared with previous research models, specifically Li et al., Pan et al., and Mohamadlou et al. in , who all have created high-performing and accurate models with competitive test results. As seen in , the proposed hybrid method has a comparatively high AUROC of 0.953, while the best AUROC out of the other 3 models from the previous research in is 0.893. The difference in AUROC is 0.060, which is significant. The difference in performance is due to the use of two types of data to predict AKI, rather than only using one type of data, such as numeric. Additionally, the reason why the single data type models in this research also have higher AUROC than the models from previous research studies is most likely due to the use of better-performing CNN instead of logistic regression, decision trees, or RNN.
Table 4. Summary of comparison of proposed test set results with previously reported model results
In previous research, Li et al. used patient age, gender, race, ethnicity, clinical notes during the first 24 hours of ICU admission (processed with word embedding), and 72-hour SCr after admission as data features for its input (Li et al. Citation9). They ended with an AUROC of 0.783 using a logistic regression model. Another research study, by Mohamadlou et al., used heart rate, respiratory rate, temperature, SCr, GCS, and age in a decision trees machine learning model and had an AUROC of 0.878. In this way, Mohamadlou et al. achieved high AUROC with only 6 numeric data features, and their success may be due to the greater number of patient cases in the MIMIC database with these 6 features, allowing the model to learn from more data. Upgrading the method of the model, another work of research by Pan et al. used a lot of numeric data input features (51) and RNN instead of older machine learning methods, which most likely caused their model to have the highest performance out of these three previous models (Pan et al. Citation2019). Compared to those results mentioned above, the hybrid model in this research is more precise and has higher AUROC and can be more realistically implemented into clinical settings because it considers both numeric data types including blood biomarkers, vital signs, and demographics as well as ultrasound kidney images. To the best of our knowledge, so far there have been no research reports of an AUROC for an AKI predictor model that has surpassed 0.90. A reason that the hybrid model is better than the single-data-type modules could be due to the image data providing more features than the numeric data alone. Usually, larger quantities of data are better for deep learning algorithms. And though imaging may be expensive, the image data could also help pinpoint some potential causes of a patient’s AKI. This research shows that the proposed hybrid model has the potential to be employed in a hospital urgent care or ICU setting due to its advantages of fully utilizing two forms of clinical data to predict AKI.
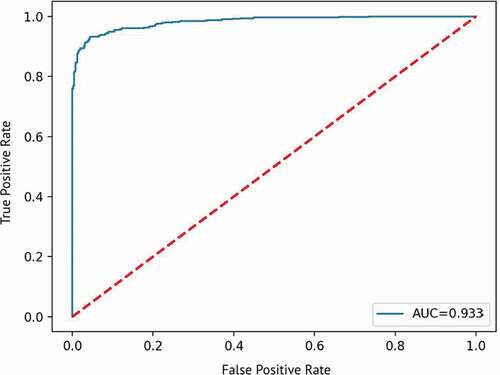
Finally, external validation of the model performance was done using the clinical data from the Third People’s Hospital of Shenzhen (PHSZ). Then, the 200 cases of raw data were formatted and processed in the same way as the original data for training the model as shown in . This data was imported to the model and tested, and the results of the test were collected and then evaluated with the same metrics used for the original data for training the model. Results of the test set for clinical verification are summarized in . The clinical verification test shows that the hybrid model can successfully predict AKI using paired datasets from a different hospital than the data used to train the model, as shown by the AUROC of 0.933 in , although most of the metrics, such as accuracy and F1-Score, indicate relatively weaker performance than the test from the original data used for training the data. Compared to the original data used to train the model, the test results of this verification data is slightly lower, with an AUROC of 0.933 instead of 0.953. This testing dataset uses the model built previously, so the results of this testing dataset should be and was approximately close to the original data test results.
Table 5. Summary of hybrid model test results using clinical data from PHSZ
Figure 8. Sample of 128 ultrasound kidney images used for clinical verification of the proposed hybrid model.
Figure 9. Graph of true positive rate vs. false positive rate for clinical verification test showing the AUROC of 0.933.
The model developed in this research can accurately predict risk of AKI in an urgent care setting, such as the ICU, where it is busy and stressful, so doctors can use this model as a supplement to prognosis. Since it is a prediction tool, doctors would know the severity of AKI risk and whether they should be especially aware of signs of AKI developing so as to prevent it from causing too much severe kidney damage. This would extend a patient’s life expectancy relative to a patient who has had AKI discovered when the disease already started. Since the AKI patient mortality rate in the ICU is very high, 60%, using this predictive model to save the life of a patient who might have gotten AKI is beneficial. This hybrid model uses initial data collected at the time of a patient’s admission to the ICU, meaning that the model is able to output a prediction as soon as the patient enters the ICU, instead of having to wait 48 or 72 hours after admission to the ICU. Past research papers featured models that only used data collected 48 or 72 hours (2–3 days) after a patient is admitted to the ICU because their data included tracking the changing levels of serum creatinine. By this time, it is already too late to predict AKI because it’s possible the model is just diagnosing AKI since the disease and symptoms may have already started. It is difficult for doctors to foresee when or if patients will have acute kidney injury because it is always sudden and often unexpected. Thus, this noninvasive hybrid approach to predicting AKI can be applied in urgent clinical practice. Though at this point, we are aware that the data we used is the only available data we have access to. In the future, we will try to continuously further validate our model using more data.
Conclusions
The proposed hybrid CNN model can accurately predict AKI in adult patients from both databases and in clinical trials, although clinical datasets are limited at the moment. The hybrid model performance results clearly indicate that the hybrid model is more effective than an individual numeric or image CNN model. This is because the hybrid model integrates image classification together with a traditional numeric model to output a more reliable result based on multiple types of data, instead of just numeric values seen in previous papers. The resulting AUROC of the hybrid model reached 0.953, indicating that the hybrid model is effective and has a significant advantage over traditional numeric models. For further development of this research, the hybrid model will be continuously optimized using a larger clinical database with paired datasets. The implementation of this research has great potential to be applied to different medical predictive applications.
Acknowledgments
The author drafted, revised, and finalized the article to be submitted for publication.
Disclosure statement
: There is no conflict of interest.
Data Availability Statement
: The MIMIC-III Database is freely available to the public and one can request access have not been made public as they were obtained directly from hospitals, but may be available upon reasonable request.
References
- Chertow, G. M., E. Burdick, M. Honour, J. V. Bonventre, and D. W. Bates. 2005, November 1. Acute Kidney Injury, Mortality, Length of Stay, and Costs in Hospitalized Patients. American Society of Nephrology 16 (11):3365–70. doi:https://doi.org/10.1681/ASN.2004090740.
- Faubel, S., N. U. Patel, M. E. Lockhart, and M. A. Cadnapaphornchai. 2014, February 7. Renal Relevant Radiology: Use of Ultrasonography in Patients with AKI. American Society of Nephrology 9 (2):382–94. doi:https://doi.org/10.2215/CJN.04840513.
- He, K., X. Zhang, S. Ren, and J. Sun (2015, December 10). Deep Residual Learning for Image Recognition. arXiv.org. arXiv:1512.03385.
- Jiang, L., Y. Zhu, X. Luo, Y. Wen, B. Du, M. Wang, Z. Zhao, Y. Yin, B. Zhu, X. Xi, et al. 2019. Epidemiology of acute kidney injury in intensive care units in Beijing: The multi-center BAKIT study. BMC Nephrology 20 (1):468. Acute Kidney Injury Trial (BAKIT) workgroup. doi:https://doi.org/10.1186/s12882-019-1660-z.
- Johnson, A. E. W., et al. MIMIC-III, a freely accessible critical care database. Scientific Data (2016). doi: https://doi.org/10.1038/sdata.2016.35.
- Khwaja, A. 2012. KDIGO clinical practice guidelines for acute kidney injury. Nephron. Clinical Practice 120 (4):c179–c184. doi:https://doi.org/10.1159/000339789.
- Kuo, C. C., C. M. Chang, K. T. Liu, W. K. Lin, H. Y. Chiang, C. W. Chung, M. R. Ho, P. R. Sun, R. L. Yang, and K. T. Chen. 2019. Automation of the kidney function prediction and classification through ultrasound-based kidney imaging using deep learning. NPJ Digital Medicine 2 (29). doi: https://doi.org/10.1038/s41746-019-0104-2.
- LeCun, Y., Y. Bengio, and G. Hinton. 2015, May 27. Deep learning. Nature 521:436–44. doi:https://doi.org/10.1038/nature14539.
- Li, Y., L. Yao, C. Mao, A. Srivastava, X. Jiang, and Y. Luo (2018). Early Prediction of Acute Kidney Injury in Critical Care Setting Using Clinical Notes. IEEE International Conference on Bioinformatics and Biomedicine, Madrid, Spain, 2018, 683–86. doi: https://doi.org/10.1109/bibm.2018.8621574.
- Litjens, G., T. Kooi, B. E. Bejnordi, A. A. A. Setio, F. Ciompi, M. Ghafoorian, and C. I. Sánchez. 2017, July 26. A survey on deep learning in medical image analysis. Medical Image Analysis. doi:https://doi.org/10.1016/j.media.2017.07.005.
- Makris, K., and L. Spanou. 2016. Acute Kidney Injury: Definition, Pathophysiology and Clinical Phenotypes. The Clinical Biochemist Reviews 37 (2):85–98.
- Mohamadlou, H., A. Lynn-Palevsky, C. Barton, U. Chettipally, L. Shieh, J. Calvert, N. R. Saber, and R. Das. 2018. Prediction of Acute Kidney Injury With a Machine Learning Algorithm Using Electronic Health Record Data. Canadian Journal of Kidney Health and Disease 5. doi:https://doi.org/10.1177/2054358118776326.
- Pan, Z., H. Du, K. Y. Ngiam, F. Wang, P. Shum, and M. Feng. 2019. A self-correcting deep learning approach to predict acute conditions in critical care. arXiv Preprint arXiv:1901.04364.
- Silver, S. A., J. Long, Y. Zheng, and G. M. Chertow. 2017. Cost of Acute Kidney Injury in Hospitalized Patients. Journal of Hospital Medicine 12 (2):70–76. doi:https://doi.org/10.12788/jhm.2683.
- Simonyan, K., and A. Zisserman (2015, April 10). Very Deep Convolutional Networks for Large-Scale Image Recognition. arXiv.org. arXiv:1409.1556.
- Tan, L.-S., X.-Y. Huang, Y.-F. Wang, Y. Jia, Q.-L. Pang, W.-X. Zhang, … J.-X. Li. 2020, October 15. Association of acute kidney injury and clinical outcomes in patients with COVID-19 in Shenzhen, China: A retrospective cohort study. American Journal of Translational Research 12 (10):6931–40.
- Tomašev, N., X. Glorot, J. W. Rae, et al. 2019. A clinically applicable approach to continuous prediction of future acute kidney injury. Nature 572:116–19. doi:https://doi.org/10.1038/s41586-019-1390-1.
- Xie, G., T. Chen, Y. Li, T. Chen, X. Li, and Z. Liu ( 2019, December 3). Artificial Intelligence in Nephrology: How Can Artificial Intelligence Augment Nephrologists’ Intelligence? Kidney Diseases, 6: 1–6. doi: https://doi.org/10.1159/000504600.