
 ?Mathematical formulae have been encoded as MathML and are displayed in this HTML version using MathJax in order to improve their display. Uncheck the box to turn MathJax off. This feature requires Javascript. Click on a formula to zoom.
ABSTRACT
Studies on brain biometrics have shown that electroencephalogram (EEG) signals encourage more secure authentication. The uniqueness, persistence, universality and robustness of EEG signals against fraud attacks offer potential for highly secure biometric systems. However, more studies are needed to improve collectibility, stability, performance, and acceptability of brain biometrics. EEG signals of healthy subjects were generally used in previous studies. However, adequate studies have not been conducted on subjects who are not mentally healthy. Moreover, EEG signals were usually recorded from healthy subjects at resting, thinking, visual stimulation, and imagery states. In this study, unlike other studies, photic stimuli with EEG data were used for the first time in order to identify both subjects with attention deficit hyperactivity disorder (ADHD) and healthy subjects. In the proposed method, power densities of 1–49 Hz frequencies of EEG segments were obtained by applying periodogram power spectral density estimation method using Kaiser Window to raw EEG data. These values were used for training of 1D Convolutional Neural Network deep learning algorithms. Classification success of the proposed method was measured as 97.17%. These results proved that EEG data obtained from subjects by applying photic stimuli can be used in EEG-based identification systems.
Introduction
Authentication and identification tools can be grouped into three general categories. These are the tools that the user knows, owns, and the user himself Gui et al. (Citation2019). Although passwords and PIN codes are widely used in authentication, there are always risks, such as oblivion or loss Soni, Somani, and Shete (Citation2016). Biometric authentication is the security process that verifies an individual’s identity with unique physiological or behavioral characteristics. Since these features are inherent physiological or behavioral parts of an individual, they do not require memory and cannot be lost. Tools in this category are safer than tools in the other two categories Hu (Citation2009). However, each of biometrics used in daily life, such as face, voice, fingerprint, and DNA, still has many potential security concerns due to the fact that their counterfeits are produced and cannot be completely canceled, and vitality of individual cannot be verified Puengdang et al. (Citation2019). Therefore, interest in EEG signals that reflect delicate differences in mental characteristics of subjects has increased Cao and Jain (Citation2016), Chaos Computer Club (Citation2014), Jain, Ross, and Prabhakar (Citation2004), Marasco and Ross (Citation2014).
Since EEG signals are typically used to analyze problems related to the subject’s inner state of mind, this indicates the presence of unique patterns in the subject. Also, since the brain is also highly individualized even on the same task, it will not be possible to fake EEG recordings Valizadeh et al. (Citation2018). Because neuronal connection is unique for all subjects Zhao et al. (Citation2010). Moreover, a subject’s EEG is both stable and characterizes small personal differentiation and large interpersonal differentiation (Ma et al. Citation2015). Although brain biometry has many advantages, it has not yet been widely adopted. Because more research is needed to improve the collectibility, performance, and acceptability of brain biometry Gui et al. (Citation2019). In studies conducted so far, EEG data from open databases, which were generally used in BCI studies, have been used frequently. These data were recorded during specific mental tasks and resting states. Apart from these, VEP and ERPs have also been used in identity verification systems. However, EEG records were obtained without giving photic stimuli to the subjects participating in these studies. Therefore, evaluation of the effect of the photic stimuli in EEG authentication systems is still an important shortcoming Bidgoly, Bidgoly, and Arezoumand (Citation2020). Photic stimuli are the application of flashing light stimulation at different frequencies to the subject during EEG recording. There are differences in EEG signals taken under photic stimuli according to the resting state. Also, when analyzing EEG recordings from subjects with ADHD, significant differences were observed in the power density of the frequency bands compared to healthy subjects McAuliffe et al. (Citation2020).
EEG-based biometric studies in the literature that increasing identification and authentication performance with various signal processing and classification methods DelPozo-Banos et al. (Citation2015), Gui et al. (Citation2019), Moctezuma and Molinas (Citation2019), Puengdang et al. (Citation2019), Zhang, Zhou, and Zeng (Citation2017), examining identification and verification performances in various recording states, such as mental tasks, motor imagery, resting state Bajwa and Dantu (Citation2016), Fallani et al. (Citation2011), Ma et al. (Citation2015), Yang, Deravi, and Hoque (Citation2018), and reducing the number of electrodes and EEG data at acceptable recognition accuracy levels Jayarathne, Cohen, and Amarakeerthi (Citation2016), Ong, Saidatul, and Ibrahim (Citation2018).
Soni et al. proposed a framework for visual Evoked Potential (VEP) based biometrics produced in response to a visual stimulus. They found that the energy properties of the gamma band in VEP signals to be distinctive Soni, Somani,and Shete (Soni, Somani, and Shete Citation2016). DelPozo-Banos et al. used the auditory evoked potentials (AEPs) database for authentication. In their experiments, the authors demonstrated that the PSD EEG information below 40 Hz was unique enough to identify between subjects regardless of the cognitive task or sensor location recorded DelPozo-Banos et al. (Citation2015). Puengdang et al. applied the steady-state visual evoked potential (SSVEP) and event-related potential (ERP) properties to the long short term memory (LSTM) network for identification from EEG signals. As an experimental result, they achieved 91.44% success Puengdang et al. (Citation2019). Moctezuma et al. used event-related potentials (ERP) for identification in their studies. Feature extraction was performed by empirical mode decomposition (EMD) method. 4 properties per intrinsic mode functions were calculated, 2 energy properties and 2 fractal properties. The authors have achieved 89% success in the classification with Support vector machine (SVM) with these features Moctezuma, andMolinas (Moctezuma and Molinas Citation2019). Zhang et al. used the time, frequency and time-frequency properties of EEG signals from a single channel for authentication. In the classification made with the ensemble classification method, they reached an accuracy rate of 95.48% Zhang et al. (Citation2019). Zhang et al. performed the identification process with Neural Network, Nearest Neighbor, Bagging, Random Forest and AdaBoost classifiers using ECG/EEG signals. They reported that among these classifiers, random forest achieved better results (98%) than others Zhang, Zhou, and Zeng (Citation2017). Hu et al. achieved 91% success in language motor imagery (MI) using the Artificial Neural Networks algorithm in authentication using 4 different motor imagery data, namely language, right hand, left hand and foot Hu (Citation2009). Fallani et al. obtained the dataset in their study from EEG signals recorded from 50 healthy subjects with eyes open and closed at resting. The PSDs of the frequencies in the range (1–40 Hz) were calculated by using 10-second segments of the signals in the dataset. The authors obtained 40-element feature vectors with PSDs. They used Naive Bayes classifier and k-fold cross validation. The eyes closed resting state achieved the highest success (92% O2, 91% O1) with the occipital electrodes Fallani et al. (Citation2011). Yang et al. investigated the sensitivity of EEG-based biometric recognition to the types of tasks that subjects must fulfil while recording brain activities. The authors used a new wavelet-based feature extraction algorithm to extract identification from a database of 109 subjects performing four different motor motion and visualization tasks. The results showed that performance was not significantly affected when there were differences between training and testing tasks Yang, Deravi, and Hoque (Citation2018). Ma et al. used resting EEG data with eyes open/closed. They used Convolutioanl Neural Network (CNN) to automatically feature and classify EEG data. As a result, the classification accuracy of the CNN-based biometric system was 88% Ma et al. (Citation2015). Bajwa et al. applied discrete Fourier transform and discrete wavelet transform to EEG signals of three visually stimulated tasks from 120 subjects and obtained the energy bands of these signals. The obtained features achieved an authentication success of 91.05% by applying the support vector machine (SVM) Bajwa and Dantu (Citation2016). In the method proposed by Jayarathne et al., EEG signals were recorded by showing numbers. In the training, 8 to 30 Hz Alpha and Beta frequency bands obtained from EEG channels were used. The properties obtained from these bands were applied to the linear discriminant analysis (LDA) classifier. Success was achieved as 96.97% Rodrigues et al. (Citation2016). Dai et al. used power spectral density values of EEG signals for biometric authentication. Alpha, beta, theta, alpha-beta, theta-alpha, beta-gamma PSD values were applied to the K nearest neighbor (KNN) classifier. The accuracy was obtained as 89.21% Dai et al. (Citation2015).
In this study, unlike other studies, obtained from subjects given photic stimuli EEG signals were authenticated with EEG data obtained by applying seven different photic stimuli. Raw EEG signals received from 16 channels with a sampling frequency of 500 Hz were divided into 3-s segments for this process. 1–49 Hz power spectral density (PSD) values of each segment were obtained by periodogram estimation method (PEM) using Kaiser Window. The model was trained by applying these values to the 1D-CNN model designed in the study. When the trained model was tested with the data reserved for the test, an accuracy of 97.17% was obtained. The contributions of this study are as follows:
a. The results showed that EEG data obtained by applying photic stimuli subjects can be used in biometric identification systems.
b. Authentication was achieved with high accuracy by using the PSD values of EEG signals with the designed 1D CNN deep learning model.
c. Contribution was made to improving the acceptability of EEG-based authentication.
d. Although subjects were given stimulation at frequencies 5, 10, 15, 20, 25, 30, 33 Hz for authentication, the EEG segments were shown to be sufficiently unique regardless of photic stimuli frequency.
The rest of the work was organized as follows. Detailed literature review is given in Section 2. In Section 3, material and method of the proposed method are explained in detail. Experimental results and discussion of the study are given in Section 4. Finally, a brief conclusion is given in Section 5.
Materials and methods
Proposed model
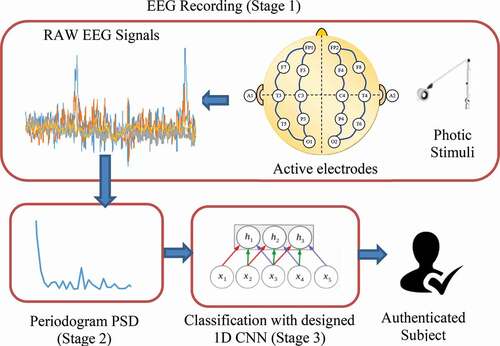
The block diagram of the EEG-based authentication system proposed in this study is shown in . The proposed system consists of three stages. In the first stage, RAW EEG records were obtained by applying photic stimuli from the subjects. In Stage 1, 16-channel EEG recordings were obtained from electrode pairs by applying a longitudinal bipolar montage of 18 active electrodes. In the second stage, the power spectral densities of each RAW EEG data were obtained by the PEM using the Kaiser window. In Stage 3, these data were applied to deep learning model designed in the study. Authentication of ADHD and healthy subjects was performed with deep learning model.
Figure 1. Proposed EEG-based authentication system block diagram.
EEG recordings
In this study, retrospective EEG records at Kutahya Health Sciences University Neurology Clinic Evliya Çelebi Research and Application Hospital were used. These records belong to 16 subjects, 8 females and 8 males, aged 7–18. EEG data were recorded by applying 5–10-15-20-25-30-33 Hz photic stimuli with eyes open and eyes closed. In photic stimuli, subjects were laid on their backs. A LED lamp that can produce light at various frequencies was used. Electrodes were placed according to international 10–20 system standards. EEG recordings of the 16-channel Nihon Kohden device with 500 Hz sampling Fp1-F7, F7-T3, T3-T5, T5-O1, Fp1-F3, F3-C3, C3-P3, P3-O1, Fp2-F4, F4-C4, C4-P4 P4-O2, Fp2-F8, F8-T4, T4-T6, T6-O2 channel pairs. EEG signals from 16 subjects were obtained by shifting the signal in 3-s segments. The dataset of the study with a total of 14,336 3-s EEG signal segments was obtained by using these augmented signals.
Power spectral density estimation using the periodogram power spectral density estimate method using the Kaiser window
Periodogram was used to obtain the PSD of the EEG signals. Periodogram is obtained by nonparametric Fourier transform (Leracitano et al. Citation2019). The transformation is in a biased estimate of the autocorrelation sequence structure. EquationEquation 1(1)
(1) is used to obtain the periodogram of the signal:
In EquationEquation 1(1)
(1) , Fs is the sampling frequency, X(n) is the input signal, L is the length of the signal and Pxx(f) is the periodogram of the signal.
In the proposed method in the study, Kaiser Window was used as windowing. The coefficients of a Kaiser window are obtained by EquationEquation 2:(2)
(2)
In Equation 2, I0 denotes the zeroth order modified Bessel function () of the first type of the signal of length L = N + 1. The spectrum of a finite-length signal typically exhibits side lobes due to their discontinuity at the extremes. Window function w(n) reduces discontinuities and decreases the spread of spectral energy of spectrum Kaiser (Citation1974).
Designed 1D CNN architecture
CNN is a type of neural network widely used in image processing, signal processing, and classification tasks. In this study, 1D CNN model was designed for the authentication of healthy subjects and subjects with ADHD. The developed model had 1-dimensional convolution, rectified linear unit (Relu), and dense layers.
The first layer in the 1D-CNN model was the convolutional layer. The feature vector was applied to the network as input in this layer. The network learns the R parameter to map the inputs to the T estimate, according to the hierarchical feature extraction given in EquationEquation 3(3)
(3) .
In EquationEquation 3(3)
(3) , the number of hidden layers in the network is given as L. For convolutional layers, the operation of the first layer can be expressed by EquationEquation 4
(4)
(4) .
In EquationEquation 4(4)
(4) , ⊗ indicates the convolution operation. X1 is a one-dimensional input matrix of the feature map. W is the core set used to extract a new feature set from the input sequence. b is the bias value and h is the activation function. The output of the convolutional layer was then flattened. Relu normalization layers were used in the model to normalize the activations of the previous layer after each convolutional process.
In the Fully Connected Layer (FCL) layer, the feature map is transformed into a single column vector and was applied to fully linked layers. The data in the last Relu layer is used as input to the fully connected layer. These operations are defined by EquationEquation 5(5)
(5) , where W weights, X1 represents the input vector of FCL layer, b bias value and h activation function Sun, Lo, and Lo (Citation2019).
The last layer of the model is the softmax layer. Authentication is performed on this layer with the data coming from FCL.
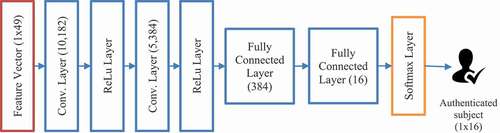
Obtaining the optimum model was carried out with different trials in the number of layers and hyper-parameters. After many adjustments were performed with brute force technique, the number of layers of the 1D-CNN model and the parameters of these layers were found. Optimum accuracy was obtained by deciding the architecture of the layers and the parameters using validation. The CNN architecture shown in was determined by offline experiments. PSD values with 49 elements form the input layer of the 1D-CNN model. This model was trained using adaptive moment estimation. The network consists of a Relu and a convolution layer each. The filter size of the first convolution layer was set to 10 × 182 and the filter size of the second convolution layer was set to 5 × 384. This was followed by 2 fully connected layers of 384 and 16 dimensions, a softmax layer and an output layer, respectively. The settings for the parameters of the proposed 1D-CNN model were as follows: initial learning rate = 0.01, minibatch size = 128, max epoch = 1200 and the stochastic gradient descent with momentum (SGDM) optimizer trained. Training was stopped after the maximum number of epochs was reached.
Figure 2. Proposed 1D-CNN architecture.
Experimental results and discussion
In the experiments to prove the success of the proposed method, firstly, frequency conversion of RAW EEG signals was performed. PEM method using the Kaiser Window to the segments consisting of EEG raw data of 16 channels was used in frequency transform. PSD values between 1 and 49 Hz were calculated by PEM method. Values calculated in this range include important properties of frequency strengths in the EEG signal. Moreover, this frequency range includes PSD values of delta, theta, alpha, beta and gamma bands. PSD values of all bands were applied to 1D-CNN model and features in the entire range were used in classification. The input vector to be applied to the classifier was composed of 49 spectral power values for the input set to be applied to the classifier, 14,336 samples were prepared. These samples included PSD values of EEG recordings obtained by applying photic stimuli at different frequencies.
The dataset used in the proposed method was randomly selected as 60% for training, 20% for validation, and 20% for testing. The dataset contains equal amounts of data for ADHD and healthy subjects. Similarly, the data distribution of normal and ADHD subjects in the training, validation, and test set was arranged as balanced. 8602 of the 14,336 samples prepared were reserved for the training set. The remaining 2867 samples were reserved for the validation and the rest of the 2867 samples reserved for test set. The training set was applied to the designed CNN model to classify digital identities from EEG signal.
When the EEG signals with photic stimuli was applied, the graph of the signal with photic stimuli obtained is shown in . ()) shows the raw EEG signals obtained from the FP2-F8 channel. In (–49 Hz PSD values obtained by applying the PEM using the Kaiser Window method of these signals are shown.
Figure 3. FP2-F8 channel EEG data from subject with ADHD and healthy subject (photic stimuli: 15 Hz, eyes closed): (a) raw EEG signals and (b) PSD values.
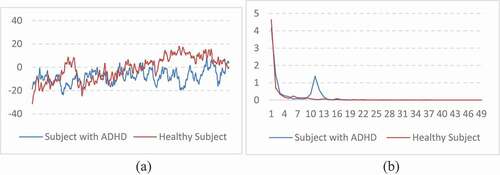
shows the PSD values of a single channel. PSD values obtained from other channels also have the same characteristics. In the literature, it was stated that there was an increase in the alpha band power values in the EEG signals of subjects with ADHD McAuliffe et al. (Citation2020). Despite the differences in PSD values between ADHD and healthy subjects, it has been shown that biometric authentication can be performed on subjects with ADHD.
When the photic stimulated EEG data of 1433 in 2867 healthy people in the test set of the study were applied to the trained model, the results obtained are presented in . Healthy subjects were labeled with the SH labels in this table. By applying the labeled test data to the proposed model, the highest success (100%) was obtained from SH3 subject. The lowest success was obtained from SH7 (92.73%). The overall success was 96.99%. In total, 43 of 1433 test data in healthy subjects were classified as wrong class.
Table 1. The authentication success of the method suggested per healthy test samples
Other 1434 of 2867 photic stimulated EEG data in the test set of the study are belong to subjects with ADHD. The distribution of these data is presented in . Subjects with ADHD in the table were labeled with the SA labels. By applying the labeled test data to the proposed model, the highest success (100%) was obtained from SA4 and SA6 subjects. The lowest success was obtained from SA2 (92.77%). Overall success was 97.35%. In total, 38 of 1434 test data were classified as wrong class in subjects with ADHD.
Table 2. The authentication success of the method suggested per with ADHD test samples
The overall accuracy of the proposed method was calculated as 97.17% in the subjects who received photic stimuli. High success was achieved in the classification made with the dataset obtained with photic stimuli at different frequencies. This indicates that although the photic stimuli frequencies are different, the individual uniqueness of the EEG signals is preserved.
In the biometric studies in the literature, artifact-free EEG signals were generally studied in the resting state Bidgoly, Bidgoly, and Arezoumand (Citation2020), Da Silva Junior et al. (Citation2019), Lozoya-Santos et al. (Citation2019). Gamma band in VEP signals was used in methods that were authenticated by extracting features with PSD Soni, Somani, and Shete (Citation2016). Also, AEP and SSVEP signals were also studied DelPozo-Banos et al. (Citation2015). Puengdang biometric classification was performed with LDA using Alpha and Beta bands Jayarathne, Cohen, and Amarakeerthi (Citation2016). In addition, PSD values of 1–40 Hz frequency range were used for biometric classification in healthy subjects Fallani et al. (Citation2011). Further, authentication studies were also carried out with methods containing internal stimuli such as motor imagery in studies Chakladar et al. (Citation2021).
Valsaraj et al. (Citation2020), Yang (Citation2020). We used PSD values at frequencies (1–49 Hz) including all bands (delta, theta, alpha, beta, and gamma) for biometric classification. EEG signals recorded under photic stimuli with different frequencies were used for authentication, unlike other authentication methods. In the proposed method, not only healthy subjects but also subjects with ADHD were included in the experiment to demonstrate the feasibility of authentication from EEG signals recorded under photic stimuli. Experiment results are shown in and . These results proved the robustness of authentication under photic stimuli.
Conclusion
In this article, we proposed a successful method for EEG-based authentication of photic stimuli subjects. The features of the EEG signals were obtained with the PEM method with the Kaiser Window. These features were applied to the 1D-CNN algorithm. Unlike other studies, EEG signals obtained by applying photic stimuli at seven different frequencies were used for the first time in EEG-based authentication. In the obtained experimental results, high accuracy values were achieved regardless of photic stimuli. Even if the photic stimuli frequencies change, the personal uniqueness of the EEG signals was preserved. Performance measurements of the proposed method showed that identity verification from EEG signals obtained by applying photic stimuli is proved by experimental results. This result makes authentication robust from EEG signals to be made under photic stimuli.
Declarations conflict of interest
The authors declare that they have no conflict of interest.
Code availability
Custom codes were used in this study by authors.
Acknowledgments
The authors thank Evliya Celebi Research and Application Hospital, Health Sciences Department of Neurology in Kutahya University for their help in accessing EEG records. This study was approved by the university human research ethics committee with this number of 2015-KAEK-86/15. All procedures performed in studies involving human participants anonymously were in accordance with the ethical standards of the institutional research committee and with the Helsinki Declaration as revised in 2013.
Disclosure statement
No potential conflict of interest was reported by the authors.
Availability of data and material
Dataset of the study was conducted with ethical approval.
Additional information
Funding
References
- Bajwa, G., and R. Dantu. 2016. Neurokey Towards a new paradigm of cancelable biometrics-based key generation using electroencephalograms. Computers & Security 62:95–113. doi:https://doi.org/10.1016/j.cose.2016.06.001.
- Bidgoly, A. J., H. J. Bidgoly, and Z. Arezoumand. 2020. A survey on methods and challenges in EEG based authentication. Computers & Security 93:101788. doi:https://doi.org/10.1016/j.cose.2020.101788.
- Cao, K., and A. K. Jain 2016. Hacking mobile phones using 2D printed fingerprints. Michigan State University, Tech. Report. MSU-CSE-2016;16-2.
- Chakladar, D. D., P. Kumar, P. P. Roy, D. P. Dogra, E. Scheme, and V. Chang. 2021. A multimodal-Siamese Neural Network (mSNN) for person verification using signatures and EEG. Information Fusion 71:17–27. doi:https://doi.org/10.1016/j.inffus.2021.01.004.
- Chaos Computer Club. 2014. Fingerprint Biometrics hacked again. https://www.ccc.de/en/updates/2014/ursel
- Da Silva Junior, M., R. C. de Freitas, W. P. dos Santos, W. W. A. Da Silva, M. C. A. Rodrigues, and E. F. Q. Conde. 2019. Exploratory study of the effect of binaural beat stimulation on the EEG activity pattern in resting state using artificial neural networks. Cognitive Systems Research 54:1–20. doi:https://doi.org/10.1016/j.cogsys.2018.11.002.
- Dai, Y., X. Wang, X. Li, and Y. Tan. 2015. Sparse EEG compressive sensing for web-enabled person identification. Measurement 74:11–20. doi:https://doi.org/10.1016/j.measurement.2015.07.008.
- DelPozo-Banos, M., C. M. Travieso, C. T. Weidemann, and J. B. Alonso. 2015. EEG biometric identification: A thorough exploration of the time-frequency domain. Journal of Neural Engineering 12 (5):056019. doi:https://doi.org/10.1088/1741-2560/12/5/056019.
- Fallani, F. D. V., G. Vecchiato, J. Toppi, L. Astolfi, and F. Babiloni 2011. Subject identification through standard EEG signals during resting states. In: International Conference of the IEEE Engineering in Medicine and Biology Society, Boston, MA, USA, 2331–33. doi:https://doi.org/10.1109/IEMBS.2011.6090652
- Gui, Q., M. V. Ruiz-Blondet, S. Laszlo, and Z. Jin. 2019. A survey on brain biometrics. ACM Computing Surveys 51 (6):1–38. doi:https://doi.org/10.1145/3230632.
- Hu, J. F. 2009. New biometric approach based on motor imagery EEG signals. In: International Conference on Future BioMedical Information Engineering, Sanya, China, 94–97. doi:https://doi.org/10.1109/FBIE.2009.5405787.
- Jain, A. K., A. Ross, and S. Prabhakar. 2004. An introduction to biometric recognition. IEEE Transactions on Circuits and Systems for Video Technology 14 (1):4–20. doi:https://doi.org/10.1109/TCSVT.2003.818349.
- Jayarathne, I., M. Cohen, and S. Amarakeerthi 2016. BrainID: Development of an EEG-based biometric authentication system. In:7th Annual Information Technology, Electronics and Mobile Communication Conference, Vancouver, BC, Canada, 1-6. doi:https://doi.org/10.1109/IEMCON.2016.7746325.
- Kaiser, J. F. 1974. Nonrecursive digital filter design using the I_0-sinh window function. In: Proc. IEEE International Symposium on Circuits & Systems, San Francisco, USA, 20–23
- Leracitano, C., N. Mammone, A. Bramanti, A. Hussain, and F. C. Morabito. 2019. A convolutional neural network approach for classification of dementia stages based on 2D-spectral representation of EEG recordings. Neurocomputing 323:96–107. doi:https://doi.org/10.1016/j.neucom.2018.09.071.
- Lozoya-Santos, J. D. J., V. Sepúlveda-Arróniz, J. C. Tudon-Martinez, and R. A. Ramirez-Mendoza. 2019. Survey on biometry for cognitive automotive systems. Cognitive Systems Research 55:175–91. doi:https://doi.org/10.1016/j.cogsys.2019.01.007.
- Ma, L., J. W. Minett, T. Blu, and W. S. Wang 2015. Resting state EEG-based biometrics for individual identification using convolutional neural networks. In 37th Annual International Conference of the IEEE Engineering in Medicine and Biology Society, Milan, Italy, 2848–51. doi:https://doi.org/10.1109/EMBC.2015.7318985.
- Marasco, E., and A. Ross. 2014. A survey on antispoofing schemes for fingerprint recognition systems. ACM Computing Surveys 47 (2):1–36. doi:https://doi.org/10.1145/2617756.
- McAuliffe, D., K. Hirabayashi, J. H. Adamek, Y. Luo, D. Crocetti, A. S. Pillai, and J. B. Ewen. 2020. Increased mirror overflow movements in ADHD are associated with altered EEG alpha/beta band desynchronization. European Journal of Neuroscience 51 (8):1815–26. doi:https://doi.org/10.1111/ejn.14642.
- Moctezuma, L. A., and M. Molinas 2019. Event-related potential from EEG for a two-step identity authentication system. In: 17th International Conference on Industrial Informatics (INDIN), Helsinki, Finland, 1:392–99. doi:https://doi.org/10.1109/INDIN41052.2019.8972231
- Ong, Z. Y., A. Saidatul, and Z. Ibrahim 2018. Power spectral density analysis for human EEG-based biometric identification. In 2018 International Conference on Computational Approach in Smart Systems Design and Applications, Kuching, Malaysia, 1–6. doi:https://doi.org/10.1109/ICASSDA.2018.8477604
- Puengdang, S., S. Tuarob, T. Sattabongkot, and B. Sakboonyarat 2019. EEG-based person authentication method using deep learning with visual stimulation. In: 11th International Conference on Knowledge and Smart Technology, Phuket, Thailand, 6–10. doi:https://doi.org/10.1109/KST.2019.8687819
- Rodrigues, D., G. F. Silva, J. P. Papa, A. N. Marana, and X. S. Yang. 2016. EEG-based person identification through binary flower pollination algorithm. Expert Systems with Applications 62:81–90. doi:https://doi.org/10.1016/j.eswa.2016.06.006.
- Soni, Y. S., S. B. Somani, and V. V. Shete 2016. Biometric user authentication using brain waves. In: International Conference on Inventive Computation Technologies, Coimbatore, India, 2:1–6. doi:https://doi.org/10.1109/INVENTIVE.2016.7824888
- Sun, Y., F. P. W. Lo, and B. Lo. 2019. EEG-based user identification system using 1D-convolutional long short-term memory neural networks. Expert Systems with Applications 125:259–67. doi:https://doi.org/10.1016/j.eswa.2019.01.080.
- Valizadeh, S. A., F. Liem, S. Mérillat, J. Hänggi, and L. Jäncke. 2018. Identification of individual subjects on the basis of their brain anatomical features. Scientific Reports 8 (1):1–9. doi:https://doi.org/10.1038/s41598-018-23696-6.
- Valsaraj, A., I. Madala, N. Garg, M. Patil, and V. Baths 2020. Motor Imagery Based Multimodal Biometric User Authentication System Using EEG. In 2020 International Conference on Cyberworlds (CW), Caen, France, 272–79. doi:https://doi.org/10.1109/CW49994.2020.00050
- Yang, G. C. 2020. Next-generation personal authentication scheme based on EEG signal and deep learning. Journal of Information Processing Systems 16 (5):1034–47.
- Yang, S., F. Deravi, and S. Hoque. 2018. Task sensitivity in EEG biometric recognition. Pattern Analysis and Applications 21 (1):105–17. doi:https://doi.org/10.1007/s10044-016-0569-4.
- Zhang, Q., D. Zhou, and X. Zeng. 2017. Machine learning-empowered biometric methods for biomedicine applications. AIMS Med Sci 4 (3):274–90. doi:https://doi.org/10.3934/medsci.2017.3.274.
- Zhang, R., B. Yan, L. Tong, J. Shu, X. Song, and Y. Zeng. 2019. Identity Authentication Using Portable Electroencephalography Signals in Resting States. IEEE Access 7:160671–82. doi:https://doi.org/10.1109/ACCESS.2019.2950366.
- Zhao, Q., H. Peng, B. Hu, Q. Liu, L. Liu, Y. Qi, and L. Li 2010. Improving Individual Identification in Security Check with an EEG Based Biometric Solution. In: Yao Y., Sun R., Poggio T., Liu J., Zhong N., Huang J. (Eds.), Brain Informatics. BI 2010. Lecture Notes in Computer Science, vol 6334. Springer, Berlin, Heidelberg. https://doi.org/https://doi.org/10.1007/978-3-642-15314-3_14.