
 ?Mathematical formulae have been encoded as MathML and are displayed in this HTML version using MathJax in order to improve their display. Uncheck the box to turn MathJax off. This feature requires Javascript. Click on a formula to zoom.
ABSTRACT
The detection of the contact area formed between a human finger and a counter surface is of great interest because it is the key parameter for various interaction parameters. Adhesional friction forces and the thermal contact conductance critically depend on the contact area, further influencing the tactile sensation of stickiness and warmth. The contact area is also of concern regarding safety issues. Injuries caused by objects slipping out of our hands might be prevented by optimizing the contact area and the concomitant grip through appropriate surface structures and material choice. Until now the contact area is mainly studied on smooth and transparent materials. The contact area is recorded optically and rule-based image processing methods can be used for detection. These methods might be insufficient for rough surfaces where the contact area is optically unclear due to light scattering. In this paper we demonstrate the successful analysis of such optically unclear contact area images via convolutional neural networks to identify the fingerprint ridges in contact with structured surfaces. The proposed method relies on the generation of synthetic contact images that provide the pixelwise ground truth for the efficient training of a segmentation pipeline based on convolutional neural networks.
Introduction
The contact area formed between a human finger and a counter surface is the key parameter for a variety of interaction processes. The contact area is the main factor for adhesional friction forces, which are dominant for many finger/counter surface systems (Derler and Gerhardt (Citation2012)). The frictional forces determine to a large extent how sticky the surface is felt (van Kuilenburg, Masen, and van der Heide (Citation2015)). In addition, an understanding of the contact area and its evolution with time could possibly minimize the danger of severe injuries imposed by objects that slip a person’s hand (Dzidek et al. (Citation2017)). Furthermore, the contact area affects the heat flux determining the sensation of warmth when touching a material (van Kuilenburg, Masen, and van der Heide (Citation2015)). So far, the contact area has been mainly studied on flat transparent counter surfaces using optical methods. The majority of the literature relies on light scattering (Gruber, Winkler, and Resch (Citation2015)) and Frustrated Total Internal Reflection (FTIR) to produce a high-contrast image of the contact areas. Different optical set-ups have been employed to take advantage of the FTIR to study the dynamics of a fingertip during the tactile exploration of smooth and transparent counter surfaces (André et al. (Citation2011); Bochereau et al. (Citation2017); Delhaye et al. (Citation2016), (Citation2014))) or the temporal evolution of the contact area and its implication on friction (Dzidek et al. (Citation2017)). Another approach was employed by Liu et al. (Citation2017) who used Optical Coherence Tomography in combination with digital image correlation techniques to study the surface strain and sub-surface deformation of a finger pad in contact with a Quartz glass during a combination of applied normal load and tangential force. For the detection of the contact area formed between a human finger and a smooth counter surface, rule-based image processing methods are usually applied. These methods include the combination of morphological operations with image thresholding techniques (Delhaye, Lefèvre, and Thonnard (Citation2014)). While these methods provide good results for smooth and transparent counter surfaces, they might be insufficient for rough counter surfaces where the contact area is possibly highly disturbed by surface structures. In this contribution we address this topic and propose a segmentation pipeline based on convolutional neural networks designed to pixelwise detect the contact areas formed between a human finger and structured surfaces. Our work is related to the topic of fingerprint recognition which is concerned with fingerprint matching for means of an individuals authentication where the goal is to find appropriate features that allow proper matching rather than the exact area of contact (Valdes-Ramirez et al. Citation2019;, Singla et al. Citation2020)). In addition, the restoration of corrupted fingerprint images is investigated to enhance the result of existing automated fingerprint recognition systems. For example, Wong and Lai (Citation2020) proposed a multi-task CNN that was trained to reconstruct synthetically corrupted fingerprint images generated with SFinGe (Maltoni (Citation2004)). In contrast to the topic of fingerprint restoration, extended missing areas of the finger pad ridges in the contact images should not be reconstructed when pursuing the goal of contact area analysis as in such cases no contact between finger and surface is established. Due to these differences we used a different network architecture and pursued a different approach for the generation of the synthetic finger-surface images.
The contribution of our work can be summarized as follows:
We propose an experimental testing site for recording contact images of human fingers on moving (semi-) transparent surfaces with different haptic attributes (see Subsections 2.1–2.3). While on smooth surfaces a segmentation of fingerprint ridges of a human finger is possible with rule-based image processing, this is not the case for rough semi-transparent surfaces.
For the segmentation of finger pad ridges on rough semi-transparent surfaces we propose the training of convolutional neural networks on synthetic finger-surface contact images. These images were computed by fusing images showing rough surfaces with images of a finger in contact with smooth and transparent surfaces. The corresponding ground truth is generated by means of rule-based image processing techniques applied on the images of a finger in contact with transparent surfaces (see Subsections 2.3 and 2.4).
We propose a two-stage CNN-architecture where the first network is used for detecting the region of interest (ROI) reflecting the gross contact area, containing contact and non-contact regions within the contact boundary, and the second network is used for the segmentation of the finger pad ridges within the detected ROI (see Section 3). We demonstrate that training is possible with only 20 training images (see Section 4).
Experimental
Testing Site
The contact area images, formed between a human finger and surfaces of different roughness, were recorded at a measurement stand described by Ules et al. (Citation2020). A brief introduction is given in the following. The measurement stand was created to measure some of the prime physical parameters that are responsible for the touch-feel of surfaces. These are frictional forces, vibrations elicited in the human finger upon dynamic exploration and the contact area formed between the human finger and the counter surface. For the measurement the human finger was kept in fixed position while a counter surface moved below in periodic linear motion. The contact area was recorded while in sliding contact, through the counter surface with a 5-megapixel camera (Prosilica GC2450C CCD, Allied-Vision, Germany) with a frame rate of 27 fps.
The contact area formed between a human finger and a flat, transparent surface was illuminated through the counter surface. The light crosses the sample prior to its transmittance into the finger due to Frustrated Total Internal Reflection (FTIR) at the finger/sample contact areas while at non-contact areas the light is partially reflected at the glass/air transition. With the camera being placed under the angle of illumination a strong contrast between contact (dark) and non-contact areas (bright) was achieved. Rough surfaces prevent such an illumination through the counter surface as light undergoes multiple scattering when passing the sample. Rough surfaces were therefore illuminated from the opposite side, where the contact between the finger and the surface is formed, via a LED strip surrounding the finger. The utilized wave length range of 460–475 nm provided the required contrast conditions. Blue light yields good contrast in the contact area images, resulting from the wavelength dependent interaction of the human skin with light. While red light exhibits large penetration depths leading to poor contrast, blue light penetrates the skin much less (Anderson and Parrish (Citation1981)). Consequently, this yields sharp transitions from contact to non-contact areas. In combination with the appropriate image analysis method, introduced in this work, this setup allowed the differentiation between contact and non-contact areas.
Counter Surface
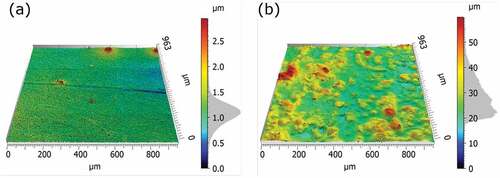
To produce the smooth counter surface a polyurethane based coating was cast on glass slides. For the rough counter surface the polyurethane coating was mixed with polyurethane based microspheres with sizes between 50 and 60 to provide the desired surface roughness (Ules et al. (Citation2020)). To study the surface roughness, surface topography measurements were conducted with a 3D optical surface metrology system (Leica DCM8, Leica Microsystems, Germany). The images were obtained using an EPI 10x lens and the Focus Variation mode with green light. This allows for a theoretical optical resolution of 0.47
and a vertical resolution better than 30
. While the smooth surface yields a low average surface roughness Sa value of 0.16
the rough surface yields an average surface roughness Sa value of 5.7
. For a 3 dimensional image of the surface topography see .
Figure 1. 3D-view of the surface topography of the smooth (a) and the rough surface (b), recorded with the 3D microscope Leica DCM8, using the focus variation mode and a 10x magnification lens.
Contact Images
For contact images recorded with a human finger in sliding contact with a transparent and smooth counter surface (termed smooth contact image in the following) see semi-transparent rough counter surface (termed rough contact image in the following) see .
Figure 2. Contact area image of a finger on a glass plate while in sliding contact. (a) Raw RGB image and (b) Gray-scale converted image with the contours of the detected contact area superimposed in blue.
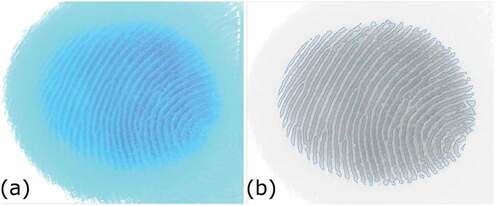
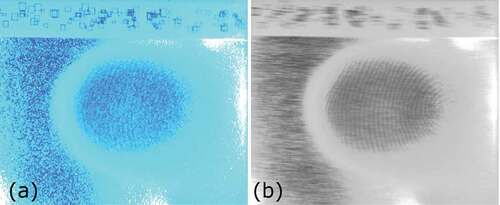
Figure 3. Contact image of a finger on the rough surface while in sliding contact. (a) Raw RGB image and (b) Gray- scale image rendered as running average of 8 subsequent images. The pattern made of rectangles was necessary in the conventional image analysis.
The smooth contact images displayed clear structures where the dark contact area could easily be discerned from brighter non-contact areas. This allowed to extract the contact area with high precision by means of rule-based image processing techniques provided by the image processing tools in the OpenCV library (Bradski (Citation2000)). The detected contact areas served as ground truth for the synthetic images (see Subsection 2.4). The extraction was divided into two steps. First, the region of interest (ROI) that reflects the gross contact area, containing contact and non-contact regions within the contact boundary, was extracted. Only the blue channel of the RGB image was used as the illumination set-up was adjusted to yield saturated blue pixels outside this area. Next, the image was converted to gray-scale and blurred to get a homogenous darker patch that reflects the ROI with otherwise bright regions. After global thresholding and image inversion a binary image was obtained with the ROI displayed in white. The next step detected the ridge contact area formed by the finger pad ridges within the ROI. This area excludes any effects of microstructures on the ridge contact area. For the analysis a combination of the green and blue color channels was used to improve the contrast between contact and non-contact areas. Adaptive thresholding was applied to binarize the image. After image inversion a binary image was obtained where the contacting finger pad ridges are displayed in white. Due to sweat pores located on the finger pad ridges, the detected contact regions contain areas that show the geometry of the sweat pores. These are non-contact areas and they need to be removed from the images because the detected contact area serves as ground truth for the synthetic images used for CNN training and would mislead the training process. The synthetic images and the corresponding ground truth images must therefore resemble the rough contact images closely where such structures were not visible due to strong scattering effects (see Section 2.4). Consequently, image morphological transformations such as opening and closing were applied. Closing filled missing contact regions within the contacting ridges caused by sweat pores. Opening removed small, single regions outside the contacting ridges (non-contact areas), which possibly originate from sweat secretion and imperfections in the coating. The detected contact area can be seen in . To improve the visibility of the matching quality, only the contours of the analyzed contact areas were superimposed on a gray-scale version of the contact image shown in (a) in blue color. Manual visual inspection proved the detected areas to fit the contacting areas quite well.
The contact area images recorded on the rough surface hardly revealed the areas in contact due to the intense structures introduced by the surface roughness and the microspheres within the coating, see . These structures are too prominent to allow the evaluation of the area of contact on the basis of a single image. To enable the analysis the running average of 8 images was formed (see ). In contrast to the surface structures, the finger pad ridges that are in contact with the counter surface hardly move between consecutive images. This improved the overall image quality in terms of visibility of the areas in contact, but generated a distracting stripe structure along the direction of counter surface movement. In addition, varying brightness conditions were observed across the contact area. for instance, displays a brighter center area and declining brightness toward the edges of contact. Note that the pattern of rectangles visible in the top part of the contact images, was required for the contact area analysis described by Ules et al. (Citation2020). For the analysis method presented here it is neither necessary nor does it introduce any errors to the analysis of the contact area.
For the segmentation of the contact area on these averaged rough contact images, an algorithm is required that can deal with the varying brightness conditions within a single image and between different images. Furthermore, the existing stripe structures add strong noise to the images and occasionally resemble the finger pad ridges. Convolutional neural networks, trained end-to-end, are a good choice for these tasks, as they typically outperform other segmentation approaches, as shown several years ago (Long, Shelhamer, and Darrell (Citation2015)). The challenge with CNN-based solutions, however, is the typically high demand for training data, which means in this specific case that a pixelwise ground truth has to be provided for each image used for training. Manual pixelwise annotation is extremely time-consuming and would also be quite error-prone due to the weak and often unclear transitions between finger pad ridges and surface structures. We therefore generated the training images in a synthetic way so that the corresponding ground truths were provided without manual annotation.
Training Data
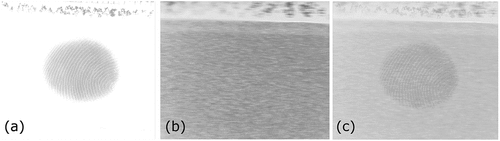
To provide the training data for the segmentation pipeline, synthetic contact area images were created which resemble the real data (averaged rough contact images) and for which the ground truth was known precisely. To form the synthetic images, a smooth contact image was fused with a running average of 8 images of the rough surface. Hence, the same number of images were averaged as for the real images formation to create similar surface structures. Before passing the real images to the CNN for analysis, the intensities of their RGB channels were adjusted to enhance the contrast between contact and non-contact areas. The same procedure was therefore applied to the synthetic images. Good results were obtained when this adjustment was performed on the individual images prior to fusion. Next, the images were converted to gray-scale and subjected to a contrast limited adaptive histogram equalization (createCLAHE from the OpenCV library) to achieve the desired increase in contrast. Finally, the images were fused with 80% intensity of the surface image and 20% of the smooth contact image. This process is displayed in where a smooth contact image (a) is fused with an averaged rough surface image (b) to form the synthetic image (c). Additionally, for training the first stage of the segmentation pipeline, the region of interest (ROI) was manually marked for both synthetic and real images, which corresponds to the gross contact area. The ground truth for training of the second stage of the segmentation pipeline was generated for the synthetic images by means of rule-based image processing techniques applied on the smooth contact images (see Subsection 2.3).
Figure 4. Generation of synthetic images. (a) Finger through a glass plate, (b) running average of 8 surface images and (c) the combined synthetic image.
Segmentation Pipeline
Two approaches are apparent for estimating the contact area with convolutional neural networks (CNNs). First, a CNN could be used as a regression model where the output layer consists of a single unit that directly predicts the total contact area. Second, a CNN could be used to pixel-wisely classify between contact area and non-contact area, which results in an image processing step generally known as image segmentation. The total contact area can then be computed by counting all the “contact pixels” times the area per pixel. Latter results from the magnification scale of the optical setup. While it is difficult for domain experts to draw a pixel-wise ground truth, it is easy for them to determine whether a given ground truth is predominantly correct or incorrect. Therefore the big advantage of the image segmentation approach is that the performance of the pipeline is much more transparent for domain-experts and can be qualitatively much better assessed and monitored.
Since the synthetic images generated for network training differ significantly from the real images outside the region of interest (ROI) (compare to ), a pipeline consisting of two independently trained neural networks was used. The aim of the first network was to detect only the ROI in which the second network was then trained to segment the finger pad ridges. The advantage of this approach is that for training of the first network not only synthetic images could be used but also real images, since the region of interest could be relatively simply provided for a small number of real images by manual labeling. This way the second network only has to deal with finger pad ridges within the ROI, where the synthetic images were optimized to resemble the real images.
ROI Detection
The recorded contact images are of size . For the automatic detection of the ROI using the first network, the images were scaled down to
. The used CNN has 6 layers and only 28346 parameters, which turned out to be sufficient for the task. The small network architecture and data augmentation during training phase, including random translation, rotation, scaling, shearing and flipping (vertically and horizontally) helped prevent overfitting. This is crucial since only 20 images were used for training. The network uses (2,2)-strided convolutions for downscaling and bilinear rescaling for upscaling. In order to enlarge the receptive field two dilated convolutional layers were used. Exponential linear units (ELUs) were used as activation functions. The detailed network architecture is described in .
Figure 5. Architecture of the segmentation pipeline. The first network intended to detect the region of interest (ROI) consists of 6 layers: Conv(3, 1, 2, 16) – Conv(3, 1, 2, 32) – Conv(3, 2, 1, 32) – Conv(3, 4, 1, 32) – Upscaling(2x) – Conv(3, 1, 1, 16) – Upscaling(2x) – Conv(3, 1, 1, 1), where Conv(k, d, s, c) denotes a convolutional layer with -kernels, a dilation rate of
, a stride of
and
output channels. The second network used for the detection of the finger pad ridges within the ROI consists of 17 layers: Conv(5, 1, 1, 32) – Conv(3, 1, 1, 64) – Conv(3, 1, 1, 64) – Conv(3, 1, 2, 128) – Conv(3, 1, 1, 128) – Conv(3, 1, 1, 128) – Conv(3, 2, 1, 128) – Conv(3, 4, 1, 128) – Conv(3, 8, 1, 128) – Conv(3, 16, 1, 128) – Conv(3, 1, 1, 128) – Conv(3, 1, 1, 128) – Upscaling(
) – Conv(3, 1, 1, 64) – Conv(3, 1, 1, 64) – Conv(3, 1, 1, 32) – Conv(3, 1, 1, 16) – Conv(3, 1, 1, 1).
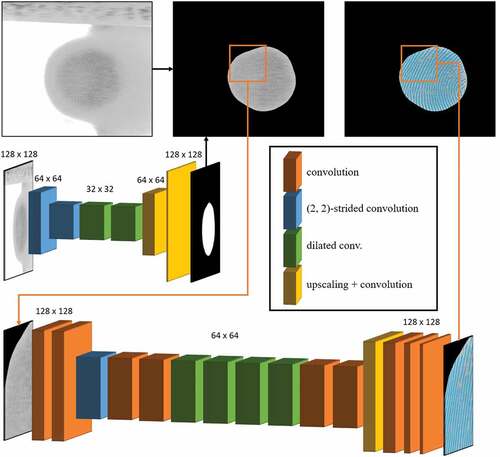
Segmentation of the Finger Pad Ridges
The second stage of the pipeline used for the segmentation of the finger pad ridges within the ROI is similar to the pipeline described by Haselmann, Gruber, and Tabatabai (Citation2018). In comparison to the ROI detection, a significantly higher image resolution is required. Consequently, the images of size were not down-scaled such as in the first stage. Nevertheless, an even smaller number of training images (10) were used for the network training. In order to increase the number of training samples without increasing the number of full-size training images, patches were extracted and processed independently. The resulting fragmentation of the original images did not only increase the number of training samples, but also reduced the required input size of the network and therefore the dimensionality of the task. However, the size of the extracted patches can not be arbitrarily reduced. It is necessary that individual patches show sufficient semantic information to allow a distinction between contact area and non-contact area. For the given contact area images a patch size of
was chosen.
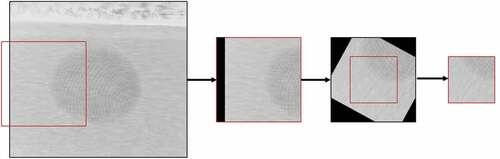
For the network training, image patches were extracted in real-time at randomized positions from the synthesized full-size images within the ROI. For further data augmentation, randomized affine image transformations as well as image shearing and flipping were applied. In order to avoid image borders caused by affine transformations, patches larger than the target size were initially extracted and after applying the affine transformations center-cropped to the final size of pixels (see ).
Figure 6. Depiction of the preprocessing steps illustrating the extraction of the image patch from the original image used for the network training.
During the test phase on real images, patches were not extracted at random positions but with a moving window and a step size of . This resulting overlap causes every region of the tested images to be covered up to four times, which can be seen as a kind of test time data augmentation which is generally known to have a positive impact on the classification performance of a CNN (He et al. (Citation2018)). For the qualitative evaluation of the contact area segmentation and before summing up to the total number of “contact” pixels the individually processed patches were reassembled to the full-size images again.
For the given segmentation task within the ROI a fully convolutional network similar to the one described by Haselmann, Gruber, and Tabatabai (Citation2018) was used (see ). The net consists of 17 layers, where the 4th layer has a stride of 2, which reduces the resolution of the feature maps to . For an enlarged receptive field a series of convolution layers with a dilation rate greater than 1 was used in the middle of the network (layers 7–10). The feature maps were upscaled again to
after the 13th layer via bilinear rescaling. Mirror-padding was used for all layers. Exponential linear units (ELUs) were used as activation functions. The network has 952017 parameters.
Results and Discussion
Training
Both CNNs were trained from scratch with the ADAM optimizer (Kingma and Ba (Citation2015)) and the hyper-parameters ,
. The CNN for ROI detection was trained for 300 epochs with a batch size of 5 and a learning rate of
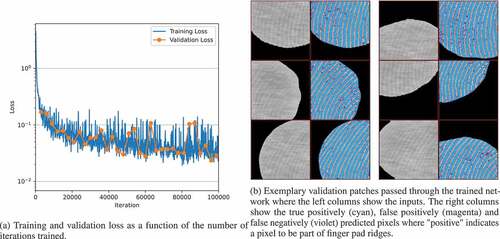
on 20 contact area images, including 10 synthetic and 10 real ones (for all images the ROI was manually marked as described in Sec. 3). The predicted ROI, reflecting the gross contact area, is in close accordance to the manually marked ROI as can be seen in . On the 5 synthetic and 5 real validation images the model’s error rate is 0.65%. As can be seen in the models shows a good generalization without notable overfitting. The network for segmentation of the finger pad ridges within the ROI was trained on extracted patches from 10 synthetic contact area images for about 80k iterations with a batch size of 64 and a learning rate of
. As can be seen in there was hardly any overfitting on the synthetic validation data as well. On the 5 synthetic validation images the model shows an error rate of 0.77%.)
Figure 7. Training of the first CNN for the detection of the region of interest reflecting the gross contact area.
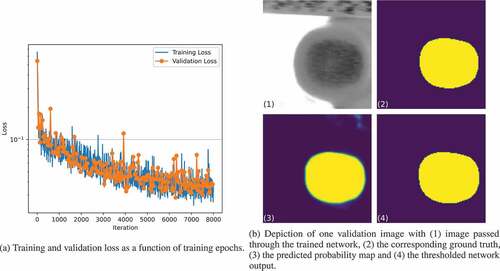
Figure 8. Training of the second CNN for the segmentation of the finger pad ridges within the region of interest.
Test on Unseen Real Images
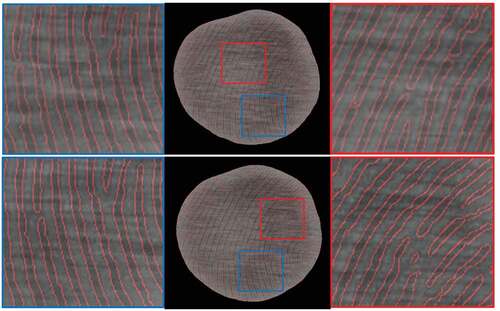
After the training of both proposed networks, the pipeline was used to segment unseen contact images between different fingers and rough semi-transparent surfaces. A quantitative analysis of the segmentation is not possible since a ground truth was not available for comparison. This would have required a manual segmentation which would have been a very time-consuming and difficult task. Furthermore, a manual segmentation would probably be quite erroneous due to the partial low contrast difference between finger pad ridges and surface structures within the ROI. To prove the high accuracy of the CNN, the contact area prediction is showcased in for two recordings. For a better visibility of the matching quality, only the contours of the predicted areas were superimposed on the respective image. In addition, close-ups are displayed to highlight the details. Manual inspection shows qualitatively well predicted contact areas. White horizontal structures do not cause an erroneous disruption of the predicted finger pad ridges and the predicted contact area is correctly terminated when ridges end. The images also contain darker horizontal structures that are not mistakenly interpreted as contacting areas. Minor mismatch is observed at bifurcation points, where the predicted area tends to end prematurely. This is assumed to arise from too few bifurcations apparent in the training data.
Figure 9. Result of the contact area analysis of a finger in contact with rough surfaces via the CNN for two different contact images. The contours of the predicted contact area are superimposed in red on the respective images. Close ups of two separate regions, highlighted by red and blue squares, are added for the respective image.
Conclusion
In this contribution we present a new approach that enables the analysis of the contact area formed between a human finger and a rough surface in sliding contact. We propose an experimental testing site that allows the continuous acquisition of corresponding images, showing not only the apparent contact area with the outlines of the finger but also the apparent finger pad ridges contact area. While on smooth surfaces a segmentation of the finger pad ridges is possible with rule-based image processing techniques, this is not the case for rough surfaces. For this reason, we investigated the segmentation of finger pad ridges via convolutional neural networks (CNNs). Since pixel-wise labeling of the finger pad ridges is difficult and extremely time-consuming we propose the use of synthetic contact images that were generated by fusing images of rough surfaces with contact images on smooth transparent surfaces. Since for the latter a ground truth based on rule-based image processing is available, this is also the case for the generated synthetic images. We further proposed a segmentation pipeline consisting of two independently trained CNNs. While the first network was trained to detect the gross contact area, the second network was trained to segment the finger pad ridges within the gross contact area. We further demonstrate that the pipeline can be trained using only 10–20 training images without showing notable overfitting on the validation images. At the end we demonstrate the application of the pipeline on unseen real images of fingers in sliding contact with a rough surface. It was qualitatively shown that in most cases the finger pad ridges in contact with the surface can be well segmented by the proposed pipeline.
Disclosure Statement
No potential conflict of interest was reported by the author(s).
Additional information
Funding
References
- Anderson, R. R., and J. A. Parrish. 1981. The optics of human skin. The Journal of Investigative Dermatology 77 (1):67–81. doi:10.1111/1523-1747.ep12479191.
- André, T., V. Lévesque, V. Hayward, P. Lefèvre, and J.-L. Thonnard. 2011. Effect of skin hydration on the dynamics of fingertip gripping contact. Journal of the Royal Society, Interface 8 (64):1574–83. doi:10.1098/rsif.2011.0086.
- Bochereau, S., B. Dzidek, M. Adams, and V. Hayward. 2017. Characterizing and imaging gross and real finger contacts under dynamic loading. IEEE Transactions on Haptics 10 (4):456–65. doi:10.1109/TOH.2017.2686849.
- Bradski, G. 2000. The opencv library. Dr. Dobb’s Journal of Software Tools 25 (11):120–26.
- Delhaye, B., A. Barrea, B. B. Edin, P. Lefèvre, and J.-L. Thonnard. 2016. Surface strain measurements of fingertip skin under shearing. Journal of the Royal Society, Interface 13 (115):20150874. doi:10.1098/rsif.2015.0874.
- Delhaye, B., P. Lefèvre, and J.-L. Thonnard. 2014. Dynamics of fingertip contact during the onset of tangential slip. Journal of the Royal Society, Interface 11 (100):20140698. doi:10.1098/rsif.2014.0698.
- Derler, S., and L.-C. Gerhardt. 2012. Tribology of skin: Review and analysis of experimental results for the friction coefficient of human skin. Tribology Letters 45 (1):1–27. doi:10.1007/s11249-011-9854-y.
- Dzidek, B., S. Bochereau, S. A. Johnson, V. Hayward, and M. J. Adams. 2017. Why pens have rubbery grips. Proceedings of the National Academy of Sciences of the United States of America 114 (41):10864–69. doi:10.1073/pnas.1706233114.
- Gruber, D. P., G. Winkler, and K. Resch. 2015. Comprehensive study on the light shielding potential of thermotropic layers for the development of new materials. Applied Optics 54 (2):150–56. doi:10.1364/AO.54.000150.
- Haselmann, M., D. P. Gruber, and P. Tabatabai. 2018. Anomaly detection using deep learning based image completion. In 2018 17th IEEE International Conference of Machine Learning (ICMLA), 1237–42. IEEE.
- He, T., Z. Zhang, H. Zhang, Z. Zhang, J. Xie, and M. Li. 2018. Bag of tricks for image classification with convolutional neural networks.
- Kingma, D. P., and J. Ba. 2015. Adam: A method for stochastic optimization. In International Conference for Learning Representations, San Diego.
- Liu, X., R. Maiti, Z. H. Lu, M. J. Carré, S. J. Matcher, and R. Lewis. 2017. New non-invasive techniques to quantify skin surface strain and sub-surface layer deformation of finger-pad during sliding. Biotribology 12:52–58. doi:10.1016/j.biotri.2017.07.001.
- Long, J., E. Shelhamer, and T. Darrell. 2015. Fully convolutional networks for semantic segmentation. In IEEE Conference of Computer Vision and Pattern Recognition (CVPR), 1–8. IEEE, Boston, MA, USA.
- Maltoni, D. 2004. Generation of synthetic fingerprint image databases. In Automatic fingerprint recognition systems, ed. N. Ratha and R. Bolle, 361–84. New York, NY: Springer.
- Singla, N., M. Kaur, and S. Sofat (2020). Automated latent fingerprint identification system: A review. Forensic Science International 309, 1–16.
- Ules, T., A. Hausberger, M. Grießer, S. Schlögl, and D. P. Gruber. 2020. Introduction of a new in-situ measurement system for the study of touch-feel relevant surface properties. Polymers 12 (6):1380. doi:10.3390/polym12061380.
- Valdes-Ramirez, D., M. A. Medina-Perez, R. Monroy, O. Loyola-Gonzalez, J. Rodriguez, A. Morales, and F. Herrera. 2019. A review of fingerprint feature representations and their applications for latent fingerprint identification: Trends and evaluation. IEEE Access 7:48484–99. doi:10.1109/ACCESS.2019.2909497.
- van Kuilenburg, J., M. A. Masen, and E. van der Heide. 2015. A review of fingerpad contact mechanics and friction and how this affects tactile perception. Proceedings of the Institution of Mechanical Engineers, Part J: Journal of Engineering Tribology 229 (3):243–58. doi:10.1177/1350650113504908.
- Wong, W. J., and S.-H. Lai. 2020. Multi-task cnn for restoring corrupted fingerprint images. Pattern Recognition 101:107203. doi:10.1016/j.patcog.2020.107203.