
 ?Mathematical formulae have been encoded as MathML and are displayed in this HTML version using MathJax in order to improve their display. Uncheck the box to turn MathJax off. This feature requires Javascript. Click on a formula to zoom.
ABSTRACT
Acute lymphoblastic leukemia (ALL) in human white blood cells is hazardous and requires immediate clinical interventions. The main objective of the proposed work is to suggest the predominant features for detection of ALL. The input images are obtained from public database ‘ALL-IDB2ʹ. All the obtained images are resized into a uniform size. The nucleus of both healthy and blast cells is segmented using UNET. Thousand deep features are extracted from the fully connected layer of different convolutional neural network models such as AlexNet, GoogleNet and SqueezeNet, and all features are fused together. The distinct features are selected using mutual information (MI), minimum recursive maximal relevance (mRmR) and recursive feature elimination (RFE) based methods. Furthermore, the intersection of selected features is carried out to obtain the prominent deep features, which are examined by heatmap. Finally, the statistical analysis is carried out with consistent and robust feature sets using ANOVA. It is found that 50% of the fused deep features seem to be better with p = . 00001. The performance of the proposed system without feature fusion is also observed. It is detected that fused features are more suitable to discriminate the healthy and blast cells to identify ALL and support clinical decisions.
Introduction
Leukemia is a blood cancer that affects all human beings regardless of age. Abnormal growth and excessive count of white blood cells (WBCs) in uncontrolled manner leads to leukemia in bone marrow. Depending upon the speed of spread and type of WBC, leukemia is classified into four types: acute lymphocytic leukemia (ALL), acute myelogenous leukemia (AML), chronic lymphocytic leukemia (CLL) and chronic myelogenous leukemia (CML). The acute type of leukemia spreads faster, whereas the chronic type of cancer develops slowly. Out of the four types, ALL is the most dangerous one that affects mostly children, teenagers and adults with the age less than 40 years. Totally, 56,000 new cases of ALL were recorded in 2020. Most of these are in the Asia Pacific region (Siegel et al. Citation2021). The risk is high for the children less than 5 years of age. The cases in India vary from region to region, and commonly, 100 boys per million and 63 girls per million are affected by ALL every year (Agrwal and Sahi Citation2020). Improved techniques in pathogenesis and availability of new therapies have given tremendous increase in survival rate rather than earlier ones (Kashef, Khatibi, and Mehrvar Citation2020; Sajana et al. Citation2020).
Usually, leukemia is recognized through microscopic blood smears by the pathologists. Human diagnosis is a time-consuming task and prone to error sometimes. The healthy white blood cell consists of nucleus at the center and cytoplasm as the next layer. The cytoplasm is completely covered by nucleus, and there is no cytoplasm in the cell for ALL affected persons. There is a change in shape of the nucleus in WBCs. The size of the cell becomes too small and also excess in count. The texture of white blood cells is also changed. During the treatment period, there is a possibility to wipe out healthy WBCs along with cancer cells (Muntasa and Yusuf Citation2019; Bethlehem; Solomon et al. Citation2017). Regular treatment is required; else, it affects the immune function and causes life threats to subjects.
In recent research works, the computer vision-based algorithms, machine learning methods and deep learning models are adopted for early identification of ALL from microscopic images (Das, Pradhan, and Mehar Citation2020). Segmentation of the nucleus of WBCs plays a vital role in detection of ALL. The least square based geometric elliptical fitting approach was adopted to segment blood cells to detect leukemia cells (Das et al. Citation2021). Color space conversion and k-means algorithm-based WBC nucleus segmentation method and CNN model based classification has been attempted (Banik, Saha, and Kim Citation2020).
Thresholding, cluster-based segmentation, region-based segmentation, watershed technique, active contour methods and neural networks-based segmentation have been attempted in the past (Anilkumar, Manoj, and Sagi Citation2020; Rashmi et al. Citation2020; Sadeghian et al. Citation2019). Sometimes, these methods are time consuming and also yield poor segmentation results. The CNN models such as LU-Net, U-Net, SegNet, IU-Net and FCN8s have recently been introduced for the segmentation of nucleus from WBCs (Zhang et al. Citation2019). Among these techniques, U-Net is preferred because of its simple architecture.
The cluster of differentiation (CD) marker with morphological features is preferred by medical experts for the classification of leukemia cells (Laosai and Chamnongthai Citation2018; Mohapatra, Patra, and Satpathy Citation2011). Various geometrical and moment-based features are also analyzed to assimilate the variations in healthy and blast cells. However, there is a need to define the precise features to differentiate the prognostic changes (Luis Vogado et al. Citation2018). The CNN model with an SVM classifier has been adopted for the automatic detection of leukemia (Liying Fang et al. Citation2015). The combination maximal information coefficient and ridge feature selection methods were adopted along with CNN models to extract more relevant features (Togacar et al. Citation2019; Toğaçar, Ergen, and Zafer Citation2020). Statistical analysis such as ANOVA tests is required for achieving confident decision (Hassan Al-Yassin et al. Citation2020).
Classification of different types of leukemia could be achieved by using a pre-trained AlexNet model (Shafique and Tehsin Citation2018). The machine learning approach and simple CNN models such as CafeNet and VGG-f are considered for leukemia detection (Luis Vogado et al. Citation2018). Detection and classification of leukemia are performed by k-means clustering and GLCM for texture feature extraction along with SVM classifier using the RBF kernel (Das, Jadoun, and Meher Citation2020). Lesser number of features were only considered here, which leads to poor system performance. Recently, the ResNet50 model was used to select deep features and machine learning classifiers such as logistic regression, SVM and random forest were adopted to diagnose the cancer cells (Das et al. Citation2021).
The optimized deep features extracted by the CNN model and graph convolutional network (GCN) with deep feature fusion (DFF) were used by Wang et al. to improve the classification accuracy (Wang et al. Citation2021). These methods concentrate only on low-level and graphical features that were not sufficient to detect ALL. Hybrid CNN models, MobileNetV2 and Resnet18 were proposed to identify the blast cells (Das and Meher Citation2021). The system complexity and the training time were comparatively high. An elaborate survey on the utilization of deep learning networks has been carried out for ALL detection (Alzubaidi, Zhang, and Humaidi Citation2021).
A deep learning network of Inception V3 and scatteringNet was developed to identify T-ALL and B-ALL cell of leukocytes. ALL has been detected by incorporating the adaptive unsharpening technique to improve the quality of the image, and deep learning networks were preferred for diagnosis. (Genovese et al. Citation2021). The complex architecture and larger execution time make the framework tedious. These structural complexity problems are solved by selecting appropriate networks with simple modules and optimized parameters. For these reasons, CNN models such as AlexNet, GoogleNet and SqueezeNet are preferred to extract features in the proposed work. The consistent and robust features are selected by mutual information and mRmR based feature selection methods. The redundant features are eliminated in recursive feature elimination. The feasible intersected features of both healthy and blast cells are identified, and their statistical analysis is performed. This analysis is used to differentiate the blast cells from healthy cells.
Highlights
Acute lymphocytic leukemia is a cancer in white blood cells. It can be easily cured by detecting the disease at the early stage. The proposed system is helpful to clinicians to identify the cancer cells. The highlights of the work are given below:
About 198 microscopic blood smear images of white blood cells were obtained from online public database.
Deep features are extracted using CNN models such as AlexNet, GoogleNet and SqueezeNet.
The robust features are selected by mutual information and mRmR based feature selection methods.
The redundant features are eliminated in a recursive feature elimination method.
The intersected features of both healthy and blast cells are identified and fused.
The statistical analysis of fused features is carried out by ANOVA test.
The proposed system with transfer learning fused features and SVM classifier with RBF kernel gives better accuracy.
The performance of the proposed system is compared with other state of art methods using various performance measures such as accuracy, precision, recall, specificity and F1-score
Methodology
The proposed system identifies the feasible features from the segmented nucleus of healthy and cancerous cells. The architecture of the system is shown in . Initially, the healthy and cancer cells are obtained from online database. Around 198 images are taken for the analysis. The images are resized as per the standard input requirement of CNN models preferred. The nucleus both healthy and blast cells are extracted by U-Net. The deep features are extracted from AlexNet, GoogleNet and SqueezeNet. The extracted features are fused together and given for feature selection block. Three different feature selection methods are adopted here. Mutual information (MI), minimum recursive maximal relevance (mRmR) and recursive feature elimination (RFE) based methods are used to select the best features. The selected features are combined together and utilized to observe the variation. The different percentage of intersected features is considered for the statistical analysis. This could help in understanding the variation between blast and healthy nucleus.
Figure 1. Proposed system architecture for leukemia detection.
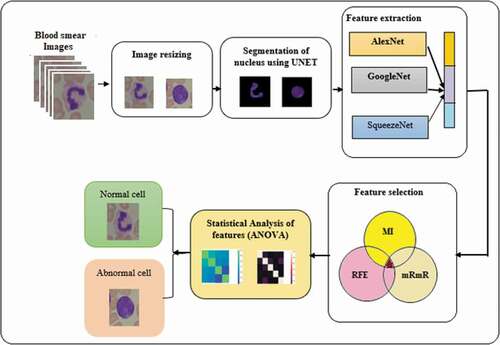
Image Database
The database “ALL IDB2” is used here where 198 microscopic images of blood smears are available. Out of these, 99 images belong to healthy cells, 50 images were taken from ALL affected men and remaining 49 images were obtained from women who suffered from ALL. All the images were captured by using a laboratory optical microscope with a power shot G5 camera. The images have a depth of 24 bits and a size of 2592 × 1944 (Donida Labati, Piuri, and Scotti Citation2011).
Pre-processing
Resizing is used in the proposed computer vision model. The images obtained from the dataset are of different sizes. There is a need of images with specific size to perform further processing. The linear interpolation technique is used for resizing. All the images are resized without compromising the quality of the image (Kumar et al. Citation2020).
UNET Based Segmentation
Usually, leukocytes have both cytoplasm and nucleus. Acute lymphoblastic leukemia causes changes in the shape and texture of the nucleus. Precise segmentation of the nucleus of white blood cells helps in identifying the changes in persons affected by ALL. U-Net is used to extract the nucleus from healthy and blast cell. The architecture of the U-Net is shown in the .
Figure 2. Architecture of U-Net for segmentation of WBC nucleus.
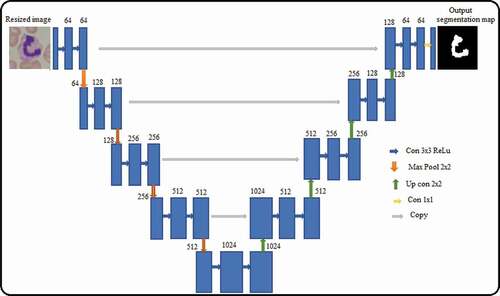
The architecture consists of a contracting path and an expansive path, which gives the U-shaped architecture. The contracting path is a typical convolutional network that consists of repeated application of convolutions, each followed by a rectified linear unit (ReLU) and a max pooling operation (Zhang et al. Citation2019). During the contraction, the spatial information is reduced, while feature information is increased. The expansive pathway combines the feature and spatial information through a sequence of up-convolutions and concatenations with high-resolution features from the contracting path. The network consists of descending layers formed by two convolution layers with ReLU activation and max pooling operation. A transposed convolutional layer is usually carried out for up-sampling, and the output feature map has a spatial dimension greater than that of the input feature map. The concatenation operation is beneficial to supplement the missing pixel position information during the convolution process, which improves the segmentation accuracy.
The microscopic images of healthy and blast cells are given as the input for U-Net. The corresponding binary masks of nucleus are obtained as output based on contraction and expansion. 198 masks of WBCs suggested by experts are considered as ground truth for validating the segmentation. The results are validated using both DICE and IoU performance measure with the corresponding ground truth. The values of both Dice coefficient and IoU lie between 0 to 1 (Zhang et al. Citation2019). The value zero indicates that the ground truth mask is completely different from the predicted mask of the image, whereas the high value ‘1ʹ depicts that both ground truth masks and predicted masks are almost same.
CNN Based Deep Feature Extraction and Fusion
The segmented nucleus is subjected to feature extraction using different CNN models. A deep convolutional neural network (CNN) is a type of multi-layered artificial neural network. It is specifically designed to extract features from the input and to classify given high dimensional data. A deep CNN consists of a number of convolutional and Max pooling layers followed by fully connected output layers. Each convolutional layer in the network comprises a number of feature maps. The neurons in one feature map with same weights assure reduction in parameters and shift invariance. The back propagation algorithm is used to train the model. The multi-layered structure performs feature extraction, feature mapping and classification (Kumar et al. Citation2020; Shemona and Chellappan Citation2020).
In the proposed work, AlexNet, GoogleNet and SqueezeNet are used. The AlexNet is a eight layer architecture with five convolutional layers and three fully-connected layers. It involves around 60,000 parameters. The robust features can be extracted by using AlexNet. It is usually preferred for achieving high accuracy in image classification problems. GoogleNet has 22 layers with 12 times lesser parameters than AlexNet, and it is considered to be faster and more accurate. The inception modules in GoogleNet support to perform network operations with lesser computational cost. SqueezeNet is an 18-layer deep network and consists of ‘squeeze’ and “expand’ layers. It squeezes the number of parameters when compared to AlexNet. It also provides very good accuracy for image classification problems. Dropout layers are used to reduce overfitting. SqueezeNet performs three times faster and has fifty times lesser parameters than AlexNet. The training time is also lesser for squeezeNet. This network uses the Adam optimizer with a learning rate of 0.0001. The fully connected layer of each model is considered to extract deep features (Jian et al. Citation2020; Nengliang Ouyang et al. Citation2021). All these feature vectors are concatenated to obtain higher dimension fused features. This helps us to learn nucleus features fully with the description of rich internal information about disease prognosis. Finally, 3000 features are extracted from healthy and blast cells.
Feature Selection Methods
The obtained deep features are considered for feature selection. Mutual information, mRmR and RFE based methods are adopted to select the dominant features among them. Mutual information use entropy to select the features. The mutual information between the two features is calculated by the measuring the level of similarity between those two features X and Y by using the formula shown below (Jha and Dutta Citation2019):
p1(m) and p2(n) show the marginal probability distribution functions of M and N random variables, respectively.
The next method adopted for feature selection is the minimum recursive maximal relevance (mRmR) method, which works on the redundant features (Togacar et al. Citation2019). The level of similarity is calculated by evaluating the mutual information difference (MID) criterion among features. The redundancy can be evaluated by mutual information quotient (MIQ) (Ding and Peng Citation2017). The mutually exclusive features are selected with minimum redundancy (Peng Citation2017; Peng, Long, and Ding Citation2005).
The recursive feature elimination (RFE) method uses filter-based feature selection internally (Luis Vogado et al. Citation2018). RFE starts with all features, and by removing redundant features, it selects the best feature subset. This can be easily done by ranking all the features and low rank features get eliminated until the required number of features is reached. A supervised method is considered to select the rank of each feature. Features with lowest accuracy get eliminated. After selecting the feasible deep features, they are intersected. This process results in a distinct high-level deep feature. These are further analyzed to identify the difference in healthy and blast cells (Chen et al. Citation2018).
The feasibility of features is analyzed by ANOVA (“Analysis Of VAriance”) test, which involves a single categorical variable k and a single numerical response p. Significant results are achieved with lowest p values when two categories such as mean of healthy and blast cell features are different. Otherwise, null hypothesis is obtained in the test (Kim Citation2017).
Results and Discussion
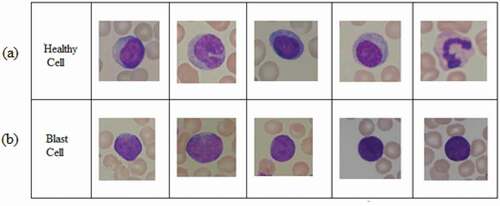
The aim of this study is to suggest feasible features of healthy and blast cells for ALL detection. The proposed work considers 99 normal and 99 blast cells images from online database “ALL IDB2.” The sample images of healthy cells and blast cells are shown in . In each image, two types of cells are present. Background cells are in red, which are erythrocytes, whereas single bulge cell is the leukocyte or WBC. Healthy WBCs consist of two layers. The inner layer represents the nucleus, and the outer layer represents the cytoplasm. Both are clearly visible in a healthy cell. In blast cells, the cytoplasm is completely occupied by nucleus, as shown in ). Though the changes in nucleus are visible, the differentiation is still challenging due to its occurrence. This work attempts to segment the complex nucleus structures more clearly.
Figure 3. Typical microscopic images: (a) healthy cells and (b) blast cells.
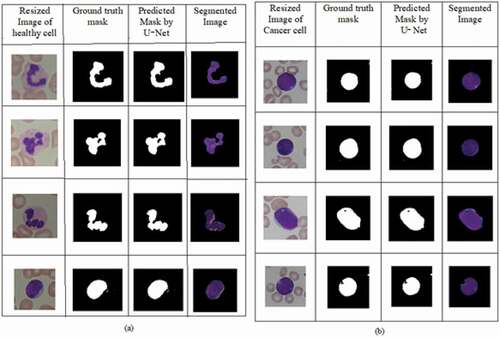
The feature vector of input images is used for reconstructing the binary mask in U-Net. The ground truth binary mask of nucleus for healthy and blast cells obtained from experts are obtained from Kaggle database. The area of nucleus of the healthy cell is less when compared to blast cells. The segmentation results taken from U-Net are shown in ), where the first column represents the resized input images. The second and third columns depict the ground truth mask by experts obtained from Kaggle and the predicted mask of the nucleus by U-Net. The segmented images shown in final column are given as input for different CNN architectures. The visual results seem to be better for U-Net compared to resized images.
Figure 4. Segmentation of nucleus by U-Net: (a) healthy cells and (b) blast cells.
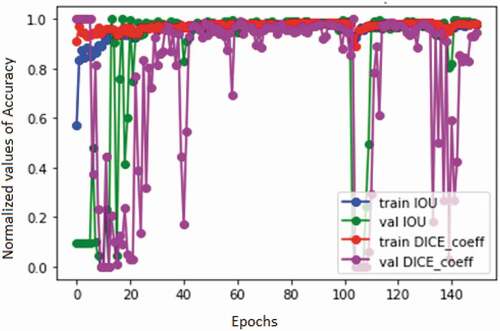
The predicted mask is compared with the ground truth mask by DICE coefficient and IoU values. The plot for variation in DICE coefficient and IoU is shown in . From , it is observed that the values of both DICE coefficient and IoU are nearly equal to 1 with respect to different iterations. This shows that the difference between the resultant mask from U-Net segmented result and ground truth mask is very small. This could be suitable for feature extraction.
Figure 5. Performance of U-Net based segmentation.
Furthermore, from each CNN model, 1000 features are extracted and concatenated as a single feature vector. The 3000 features of healthy cells and blast cells are normalized and depicted as heat map. The distribution of fused deep features is shown in .
Figure 6. Heat map of fused features: (a) healthy cells and (b) blast cells.
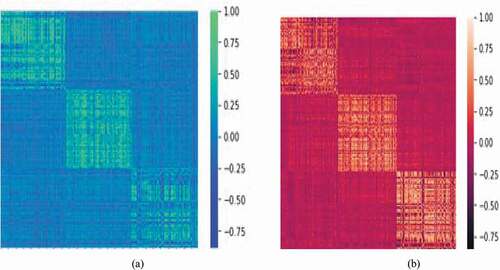
In , highly correlated features are combined as single values. The dark shade of color indicates the lowest correlation among the individual features and is denoted by the value of −0.75. The foremost features represented by the light shade of color correspond to the value of 1. It is observed that the leading features are arranged as diagonal elements of heat map, which plays a major role in the discrimination of healthy and blast cells. MI, mRmR and RFE based methods of feature selection are considered in the proposed work.
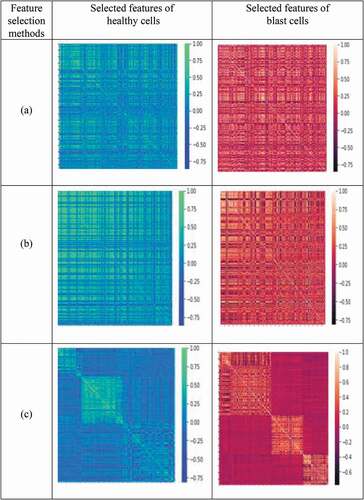
From each method, the superseding features are selected individually for healthy and blast cells. The distribution of selected features shown in depicts the selected features of healthy cells and blast cells for different feature selection methods. It is also observed that features obtained from each method are different and it is difficult to differentiate healthy and blast cells since the dominant features have almost similar values that can be represented by shades of similar color. Thus, intersection of these features is carried out. This helps us to attain the prominent deep features.
Figure 7. Heat map representation of selected features for healthy cells and blast cells: (a) MI (mutual information), (b) mRmR (minimum recursive maximal relevance) and (c) RFE (recursive feature elimination) based methods.
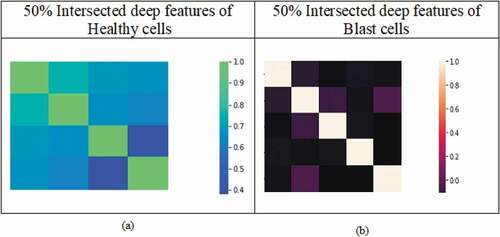
Furthermore, the different percentages of intersected features are analyzed using ANOVA. Among these, 50% of the features are significant and that is suitable to discriminate healthy and blast cells. The fifty percent of the intersected features are represented by the heat map in the . It is observed that these features are distinct and suitable to differentiate the variation for the considered classes.
Figure 8. Heat map of 50% intersected features: (a) healthy cells and (b) blast cells.
Different percentages of deep features with and without fusion and its corresponding p-values are shown in . The results suggest that the distinct performance is observed for different percentages of feature sets. AlexNet detects significant features, but the value of p is not feasible. This might be due to the loss of spatial prominent features. The obtained p-values are higher than AlexNet for GoogleNet. The values of p indicated that the extracted features from GoogleNet are unable to efficiently differentiate the healthy and blast cells. It is observed that SqueezeNet gives desirable p-values in a 100% intersected feature set. However, the result does not provide the tangible differentiation between the considered classes. Furthermore, the p-values of the proposed method for different percentages of the fused deep feature set show a significant difference. Among them, 50% of the features are highly significant with the value of p = .00001, which can be more suitable to differentiate blast cells from normal cells. Thus, the proposed method effectively suggests the distinctive deep features that could be used to supplement clinical intervention of leukemia like disorders.
Table 1. Significance of features using ANOVA test
The performance of the proposed system is measured by various performance metrics such as precision, recall, specificity, accuracy and F1-score, as shown in . It is observed that the precision is almost the same in independent networks, whereas in the proposed fused feature method, the precision is about 99.2%. The recall and specificity seem to be high compared to other networks. The respective values are found to be 98.1% and 99.1%. The F1-score is about 0.963, which is also higher than other individual networks. The accuracy is greatly improved to 98.2%, but in the other cases, the values of accuracy lie within the range of 94% to 96%.
Table 2. Performance analysis of the proposed system with other recent deep learning networks
The performance of the proposed method is compared with other existing works using the ALL-IDB2 dataset. The proposed method has superior performance over other methods with an accuracy of 98.20%. The selected fused features improve the overall accuracy and helps in better diagnosis of cancer cells from normal cells, as shown in .
Table 3. Performance comparison of the proposed method with other existing methods using the ALL–IDB2 dataset
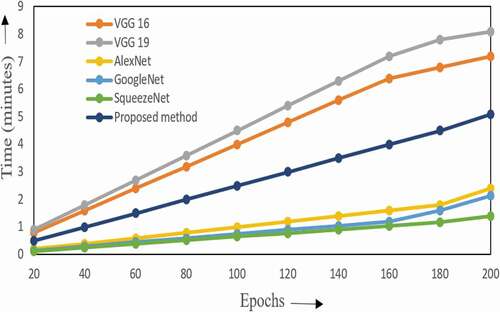
The elapsed time for the proposed work with Windows 10 and MATLAB software is graphically represented in . The VGG networks such as VGG 16 and VGG 19 have a high elapsed time of 7 m 20s and 8 m 10s for about 200 epochs. The classification accuracy is found to be high at 200th epoch. The runtime in the case of AlexNet, GoogleNet and SqueezeNet is about 2 minutes. The proposed method presents a computation time of 5 m 10s. Though this runtime is slightly high, it is compensated by the corresponding increase in the performance measures.
Figure 9. Variation in computational complexity vs different epochs for considered methods.
Conclusion and Future Scope
Acute lymphoblastic leukemia (ALL) is cancer in white blood cells. Early detection helps lessen the risk of disease. The main objective of the proposed work is to suggest principal features for the detection of ALL. The necessary input images are obtained from online database. Resizing is performed to convert all images into a uniform size. The nucleus of healthy and blast cells is segmented by U-Net. Around 1000 deep features are extracted from the fully connected layer of different CNN models such as AlexNet, GoogleNet and SqueezeNet. Deep feature fusion is adopted to concatenate all the features. The prime features are chosen by adopting various feature selection methods such as mutual information (MI), minimum recursive maximal relevance (mRmR) and recursive feature elimination (RFE). The distinct features are obtained by intersecting all prime features. The statistical analysis of divergent feature sets is accomplished by ANOVA. The performance of the proposed system with fused features is compared with feature sets without fusion. It is observed that all fused deep feature sets are significant. 50% of the intersected deep features show higher significance with p = .00001. These features will be helpful for taking constructive clinical decisions to locate the blast cells precisely at an early stage.
Disclosure Statement
No potential conflict of interest was reported by the author(s).
References
- Abdeldaim, A., A. Talaat, M. Elhoseny, and A. E. Hassanien. 2018. Computer-Aided acute lymphoblastic leukemia diagnosis system based on image analysis. Advances in Soft Computing and Machine Learning in Image Processing 131–47. Springer. doi:https://doi.org/10.1007/978-3-319-63754-9_7.
- Agrwal, S., and P. K. Sahi. 2020. National comprehensive cancer network guidelines for pediatric acute lymphoblastic leukemia. Indian Pediatrics 57 (6):561–564. PMID: 32562399.
- Alzubaidi, L., J. Zhang, and A. J. Humaidi. 2021. Review of deep learning: Concepts, CNN architectures, challenges, applications, future directions. Journal on Big Data 8:53. doi:https://doi.org/10.1186/s40537-021-00444-8.
- Anilkumar, K. K., V. J. Manoj, and T. M. Sagi. 2020. A survey on image segmentation of blood and bone marrow smear images with emphasis to automated detection of Leukemia. Biocybernetics and Biomedical Engineering 40 (4):1406–20. doi:https://doi.org/10.1016/j.bbe.2020.08.010.
- Banik, P. P., R. Saha, and K.-D. Kim. 2020. An automatic nucleus segmentation and CNN model based classification method of white blood cell. Expert Systems with Applications 149:0957–4174. doi:https://doi.org/10.1016/j.eswa.2020.113211.
- Chen, Q. Z., M. X. Liu, R. Su, R. Su, and R. Su. 2018. Decision variants for the automatic determination of optimal feature subset in RF-RFE. Genes (Basel) 9 (6):301–06. doi:https://doi.org/10.3390/genes9060301.
- Das, P. K., P. Jadoun, and S. Meher. 2020. Detection and classification of acute lymphocytic leukemia. IEEE-HYDCON1–5. doi: https://doi.org/10.1109/HYDCON48903.2020.9242745.
- Das, P. K., A. Pradhan, and S. Meher. 2020. Detection of acute lymphoblastic leukemia using machine learning techniques. In Machine learning, deep learning and computational intelligence for wireless communication, Lecture Notes in Electrical Engineering ed. E. S. Gopi, 749. Singapore: Springer. doi:https://doi.org/10.1007/978-981-16-0289-4_32.
- Das, P. K., P. Jadoun, and S. Meher. 2020. Detection and classification of acute lymphocytic leukemia. IEEE-HYDCON 1–5. doi:https://doi.org/10.1109/HYDCON48903.2020.9242745.
- Das, P. K., and S. Meher. 2021. An efficient deep convolutional neural network based detection and classification of acute lymphoblastic leukemia. Expert Systems with Applications 183:115311. doi:https://doi.org/10.1016/j.eswa.2021.115311.
- Das, P. K., S. Meher, R. Panda, and A. Abraham. 2021. An efficient blood-cell segmentation for the detection of hematological disorders. IEEE Transactions on Cybernetics 1–12. doi:https://doi.org/10.1109/TCYB.2021.3062152.
- Ding, C., and H. Peng. 2017. Minimum redundancy feature selection from microarray gene expression data. Journal of Bioinformatics and Computational Biology 03 (2):185–205. doi:https://doi.org/10.1142/S0219720005001004.
- Donida Labati, R., V. Piuri, and F. Scotti. 2011. ALL-IDB: The acute lymphoblastic leukemia image database for image processing. IEEE International conference on Image Processing. Brussels, Belgium. 2045–48. doi:https://doi.org/10.1109/ICIP.2011.6115881.
- Fang, L., H. Zhao, P. Wang, Y. Mingwei, J. Yan, W. Cheng, and P. Chen. 2015. Feature selection method based on mutual information and class separability for dimension reduction in multidimensional time series for clinical data. Biomedical Signal Processing and Control 21:82–89. doi:https://doi.org/10.1016/j.bspc.2015.05.011.
- Genovese, A., M. S. Hosseini, V. Piuri, K. N. Plataniotis, and F. Scotti. 2021. Acute Lymphoblastic Leukemia detection based on adaptive unsharpening and deep learning. IEEE International Conference on Acoustics, Speech and Signal Processing (ICASSP) 1205–09. doi:https://doi.org/10.1109/ICASSP39728.2021.9414362.
- Hassan Al-Yassin, I., A. Jaafar Mousa, M. Fadhel, O. Al-Shamma, and L. Alzubaidi. 2020. Statistical accuracy analysis of different detecting algorithms for surveillance system in smart city. Indonesian Journal of Electrical Engineering and Computer Science 18 (2):979–86. doi:https://doi.org/10.11591/ijeecs.v18.i2.pp979-986.
- Jha, K. K., and H. S. Dutta. 2019. Mutual Information based hybrid model and deep learning for Acute Lymphocytic Leukemia detection in single cell blood smear images. Computer Methods and Programs in Biomedicine 179:1–12. doi:https://doi.org/10.1016/j.cmpb.2019.104987.
- Jian, H., P. Xuemei, L. Menglong, L. Chuan, and Y. Guo. 2020. Deep convolutional neural networks for predicting leukemia-related transcription factor binding sites from DNA sequence data. Chemometrics and Intelligent Laboratory Systems 199:1–10. doi:https://doi.org/10.1016/j.chemolab.2020.103976.
- Kashef, A., T. Khatibi, and A. Mehrvar. 2020. Treatment outcome classification of pediatric Acute Lymphoblastic Leukemia patients with clinical and medical data using machine learning: A case study at MAHAK hospital. Informatics in Medicine Unlocked 20:1–15. doi:https://doi.org/10.1016/j.imu.2020.100399.
- Kim, T. K., Kim and Tae Kyun. 2017. Understanding one-way ANOVA using conceptual figures. Korean Journal of Anesthesiology 70 (1):22–26. doi:https://doi.org/10.4097/kjae.2017.70.3.267.
- Kumar, D., N. Jain, A. Khurana, S. Mittal, S. C. Satapathy, D. Roman Senkerik, and J. Hemanth. 2020. Automatic detection of white blood cancer from bone marrow microscopic images using convolutional neural networks. IEEE Access 8:142521–31. doi:https://doi.org/10.1109/access.2020.3012292.
- Laosai, J., and K. Chamnongthai. 2018. Classification of acute leukemia using medical-knowledge-based morphology and CD marker. Biomedical Signal Processing and Control 44:127–37. doi:https://doi.org/10.1016/j.bspc.2018.01.020.
- Luis Vogado, H. S., M. S. Rodrigo Veras, H. D. Flavio Araujo, R. V. R. Silva, and R. T. K. Aires. 2018. Leukemia diagnosis in blood slides using transfer learning in CNNs and SVM for classification. Engineering Applications of Artificial Intelligence 72:415–22. doi:https://doi.org/10.1016/j.engappai.2018.04.024.
- Mishra, S., B. Majhi Sa, P. K. Sa, and L. Sharma. 2017. Gray level co-occurrence matrix and random forest based acute lymphoblastic leukemia detection. Biomedical Signal Processing and Control 33:272–80. doi:https://doi.org/10.1016/j.bspc.2016.11.021.
- Mishra, S., B. Majhi, and P. K. Sa. 2018. GLRLM-Based feature extraction for Acute Lymphoblastic Leukemia (ALL) detection. Recent findings in intelligent computing techniques. Advances in Intelligent Systems and Computing 708. Springer, Singapore. doi:https://doi.org/10.1007/978-981-10-8636-6_41.
- Mohammed, Z. F., and A. A. Abdulla. 2021. An efficient CAD system for ALL cell identification from microscopic blood images. Multimedia Tools and Applications 80:6355–6368. doi:https://doi.org/10.1007/s11042-020-10066-6.
- Mohapatra, S., D. Patra, and S. Satpathy. 2011. Automated leukemia detection in blood microscopic images using statistical texture analysis. International Conference on Communication. Computing and Security. Fargo, North Dakota. 184–87. doi:https://doi.org/10.1145/1947940.1947980.
- Mondal, C., K. Hasan, T. Jawad, A. Dutta, R. Islam, A. Awal, and M. Ahmad. 2021. Acute Lymphoblastic Leukemia detection from microscopic images using weighted ensemble of convolutional neural networks. Journal of Image and Video Processing 1–10. doi:https://doi.org/10.20944/preprints202105.0429.v1.
- Muntasa, A., and M. Yusuf. 2019. Modeling of the Acute Lymphoblastic Leukemia detection based on the principal object characteristics of the color image. Procedia Computer Science 157:87–98. doi:https://doi.org/10.1016/j.procs.2019.08.145.
- Ouyang, N., W. Wang, L. Ma, Y. Wang, Q. Chen, S. Yang, J. Xie, S. Su, Y. Cheng, Q. Cheng, et al. 2021. Diagnosing acute promyelocytic leukemia by using convolutional neural network. Clinica Chimica Acta 512:1–6. doi:https://doi.org/10.1016/j.cca.2020.10.039.
- Peng, H. 2017. Python binding to mRMR feature selection algorithm. https://github.com/fbrundu/pymrmr.
- Peng, H., F. Long, and C. Ding. 2005. Feature selection based on mutual information criteria of max-dependency, max-relevance, and min-redundancy. IEEE Transactions on Pattern Analysis and Mach Intelligence 27 (8):1226–38. doi:https://doi.org/10.1109/TPAMI.2005.159.
- Rashmi, R. K., C. Prasad, B. K. Udupa, and V. Shwetha. 2020. A comparative evaluation of texture features for semantic segmentation of breast histopathological images. IEEE Access 8:64331–46. doi:https://doi.org/10.1109/access.2020.2984522.
- Rehman, A., N. Abbas, T. Saba, S. I. U. Rahman, Z. Mehmood, and H. Kolivand. 2018. Classification of acute lymphoblastic leukemia using deep learning. Microscopy Research and Techniques 81 (11):1310–17. doi:https://doi.org/10.1002/jemt.23139.
- Sadeghian, F., Z. Seman, A. R. Ramli, B. H. Abdul Kahar, and M. I. Saripan. 2019. A framework for white blood cell segmentation in microscopic blood images using digital image processing. Biological Procedures Online 11 (1):196–206. doi:https://doi.org/10.1007/s12575-009-9011-2.
- Sahlol, A. T., A. M. Abdeldaim, and A. E. Hassanien. 2019. Automatic acute lymphoblastic leukemia classification model using social spider optimization algorithm. Soft Computing 23 (15):6345–60. doi:https://doi.org/10.1007/s00500-018-3288-5.
- Sajana, T., L. P. Maguluri, M. Syamala, and C. U. Kumari. 2020. Classification of leukemia patients with different clinical presentation of blood cells. Materials Today 1–7. doi:https://doi.org/10.1111/j.1365-2141.1976.tb03563.x.
- Shafique, S., and S. Tehsin. 2018. Acute Lymphoblastic Leukemia Detection and classification of its subtypes using pretrained deep convolutional neural networks. Technology in Cancer Research and Treatment 17:1–7. doi:https://doi.org/10.1177/1533033818802789.
- Shafique, S., S. Tehsin, S. Anas, and F. Masud. 2019. Computer-assisted acute lymphoblastic leukemia detection and diagnosis. Second International conference on communication, computing and digital systems (C-CODE). Islamabad, Pakistan. 184–89. IEEE. doi:https://doi.org/10.1109/C-CODE.2019.8680972.
- Shemona, J. S., and A. K. Chellappan. 2020. Segmentation techniques for early cancer detection in red blood cells with deep learning-based classifier - a comparative approach. IET Image Processing 14 (9):1726–32. doi:https://doi.org/10.1049/iet-ipr.2019.1067.
- Siegel, L. R., D. K. Miller, E. H. Fuchs, and A. Jemal. 2021. Cancer statistics, 2021. CA: A Cancer Journal for Clinicians 71:7–33. doi:https://doi.org/10.3322/caac.21654.
- Solomon, B., N. Parihar, L. Ayodele, and M. Hughes. 2017. Global incidence and prevalence of acute lymphoblastic leukemia: A 10-year forecast. Journal of Blood Disorder Transfusion 8:08–09. doi:https://doi.org/10.4172/2155-9864-C1-028.
- Thanh, T. T. P., C. Vununu, S. Atoev, S. H. Lee, and K. R. Kwon. 2018. Leukemia blood cell image classification using convolutional neural network. Computational Theory 10:54–58. doi:https://doi.org/10.7763/1198.
- Toğaçar, M., B. Ergen, and C. Zafer. 2020. Classification of white blood cells using deep features obtained from Convolutional Neural Network models based on the combination of feature selection methods. Applied Soft Computing 97:1–10. doi:https://doi.org/10.1016/j.asoc.2020.106810.
- Togacar, M., B. Ergen, Z. Cömert, and F. Ozyurt. 2019. Deep feature learning model for pneumonia detection applying a combination of mRMR feature selection and machine learning models. IRBM 41 (4):211–12. doi:https://doi.org/10.1016/j.irbm.2019.10.006.
- Wang, S. H., V. V. Govindaraj, J. M. Górriz, X. Zhang, and Y. D. Zhang. 2021. Covid-19 classification by FGCNet with deep feature fusion from graph convolutional network and convolutional neural network. An International Journal on Information Fusion 67:208–29. doi:https://doi.org/10.1016/j.inffus.2020.10.004.
- Zhang, J., J. Du, H. Liu, X. Hou, Y. Zhao, and M. Ding. 2019. LU-NET: An improved U-Net for ventricular segmentation. IEEE Access 7:92539–46. doi:https://doi.org/10.1109/access.2019.2925060.