
 ?Mathematical formulae have been encoded as MathML and are displayed in this HTML version using MathJax in order to improve their display. Uncheck the box to turn MathJax off. This feature requires Javascript. Click on a formula to zoom.
ABSTRACT
Coconut copra is the white stout inside a coconut. Besides coconut oil, coconut copra has become a trendy snack and ingredient in cooking, owing to its numerous health merits. A good quality coconut without any infections is maintained by the farmers by employing the procedure of sulfur fumigation over the coconuts. The usage of sulfur is poisonous, and the pollution caused by burning of sulfur is toxic. This sulfur addition creates breathing, skin problems for the consumers. The proposed method is intended to make sure the availability of good quality coconut in the market by assessing the quality of each individual sample going into the production line. The sulfur content in the copra is predicted by the feed-forward machine learning technique. The features of dissimilar kinds of copra are examined and are used to train the machine model. Simulation of the proposed work is carried with MATLAB. From the validation and testing, it is found that 70% of the samples are trained; among them; 15% are validated and 15% are tested. Results indicate that 96.5% accuracy is obtained from the validation.
Introduction
Food and Agriculture Organization (FAO) study reports that the total population is envisaged to hit 9.1 billion in 2050 as reported in Arivazhagan (Citation2010). In this way, the rural formation should be expanded up to 70% to satisfy the food prerequisites of a consistently developing population. Then again, abundant utilization of synthetic mixtures, for example, bactericides, fungicides, and nematicides, to control the plant sicknesses, has been causing unfriendly impacts in the agro-biological system. Presently, there is a requirement for a successful early contamination detection procedure to control the plant infections for food security and supportability of agro-biological system. One specific area of concentration is the coconut copra. There is an increasing demand for coconut and its products. Coconut is enriched with more vitamins and necessary nutrients essential for human bodies. It is commonly consumed in daily diets and acts as a major source of anti-oxidant. India is the third-largest coconut producing country (area-15.5%, coconut production-21%) in the world. In the coconut copra, the addition of sulfur is increasing day to day. Sulfur is fumigated in the form of gas by burning yellow-colored sulfur as stated in Stephen Sagayaraj and Kalavathi Devi (Citation2015). Sulfur is poisonous and toxic, which causes numerous diseases like illness in the respiratory system, leads to cancer, skin rashes, and hair fall in the form of oil, etc. Breathing sulfur gas is toxic, and too much exposure can cause serious illness or possibly even death. Thus sulfur addition in copra causes more health issues that affect the common public.
The proposed method discusses the feed-forward algorithms to predict the content of sulfur present in the copra with the extracted features, which depends upon drying properties as Adel (Bakhshipour Citation2012; Mishra Citation2014) and to classify the sulfur fumigated and non-fumigated copra. Based on the prediction, the non-fumigated copra is used for edible and health care appliances.
Depending on the category of the application, different deep neural network architectures and local binary patterns are used for prediction as stated by Dubey and Jalal (Citation2012). According to Jhuria (Citation2013) it comprises of multi-layer perceptrons (MLP), Long Short Term Memory (LSTM), Recursive Neural Networks (RNN), and CNN (Convolutional Neural Network). Many studies have been done to predict diseases of fruits and vegetables. Models such as Hysplit and KF use the dynamic process in the atmosphere and determine the mechanisms of accumulation and indulgence of pollutants in the atmosphere. Athira et al. (Citation2018) discussed Gaussian Process Regression (GPR) and vSupport Vector Regression (vSVR) and also look how training data size affects the outcome, and it predicts the symptoms that affect the accuracy. A deep learning framework is used in the field of automatic wheat diagnostic system. A random forest algorithm was used for predictive modeling purposes in the farm management system and concert is assessed using Out of bag (OOB). Smart technology currently tends to further development in image processing classification and prediction of leaf and fruit diseases. According to Kumari and Neelamegam (Citation2015) the shape, color, and texture characteristics of the examined fruits are measured using image processing algorithms. Artificial neural network is used to predict the moisture condition of the fruit. Various fruits are analyzed by these methodologies and they are provided with the proper grading system in automation industry. Gray level features, intensity features, and shape features are extracted and performances are measured using probabilistic neural network classifier as reported by Deepa and Geethalakshmi (Citation2013). Apple fruits are graded using a machine vision system. Unay and Gosselin (Citation2010) discussed that it provides an accuracy of 93.5% and cascaded classifier architecture provides more accuracy. The FPGA implementation in the image provides more accuracy by using the Xilinx system generator (Elamaran Citation2012 ; Raut, N. P. Citation2013) . It uses VLSI architecture to implement it in various fields as discussed by (Kalavathi Devi and Venkatesh Citation2010; Thangavel, Palaniappan, and Shanmugam Citation2020). According to Sadegaonkar, Vilas (Citation2013), the quality of fruits, inspecting the diseases finds more accuracy by using statistical classifier methodology whereas, fruit grading through labour is more difficult and it ends in more errors.
To rectify, computer vision is used to sort out the error. Bayesian networks are used in the prediction of fruit yields per hectare as stated in (Jhuria Citation2013; Leemansa Citation2002). Sima, Kumari, (Kumari and Neelamegam Citation2015; Specht Citation1994) discussed about adaptive general regression neural network and adaptive probabilistic regression neural network are advanced methodologies to increase the accuracy in classification. Various methods for analysis of adulteration in fruits have been discussed earlier in the survey. Analysis of sulfur content in copra is a new domain; the sulfur content in copra was analyzed by different feature extraction techniques like K-NN, ANFIS methodologies are used for classification and they provide good accuracy as discussed by Stephen Sagayaraj, Ramya, and Dhanaraj et al. (Citation2016). The features are extracted with the above K-NN, ANFIS methodologies. The extracted features are used to train the neural network; here the feed forward algorithm is used for training the network and perform testing and validation.
This paper is organized as follows: The first section discusses the Introduction and Literature survey which is followed by Materials and Methods Section then followed by Simulation results and discussion.
Materials and Methods
Methodology of Prediction of Sulfur Content in COPRA
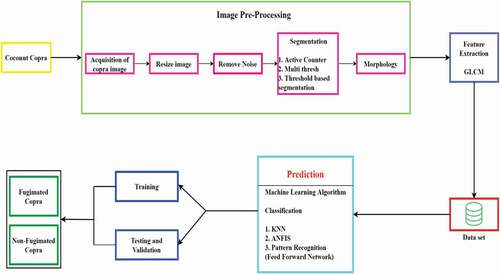
The methodology of predicting sulfur content copra is shown in . Image scquisition is the first step which is done with proper CCD (charge-coupled device). The image is acquired from copra (Dried Coconut). The real-time image taken from the coconut drying industry is with the maximum size. The size of the copra is reduced as it is very easy to implement the image in desired software. The noise present in the image due to the environment is removed using the basic filter. Segmentation of the captured image is done using algorithms as active contour, multi-thresh, and threshold-based segmentation to segment the region of interest which is the white layer of copra. Active contour classifies the white layer of copra with greater accuracy which is used for feature extraction. The segmented image undergoes feature extraction by using the GLCM technique. The extracted features are trained and tested using K-means NN (K means Neural Network), ANFIS (Adaptive Neuro Fuzzy Inference System), and NN pattern recognition- Feed-forward network as implemented in (Vani Ashok, Citation2014; Gokulnath and Usha Devi Citation2020). The classification is to classify the sulfur fumigated and non-sulfur added copra. The following section describes the procedures carried out to implement the proposed method.
Figure 1. Sequential flow for prediction of sulfur content in copra.
An Approach of Image Processing
To differentiate the sulfur fumigated copra from normal copra, the image is acquired and segmentation is carried out using active contour, multi-thresh, and threshold-based segmentation. The Gray Level Co-occurrence Matrix (GLCM) features are extracted using the segmented image.
Image Acquisition of Copra (Dried Coconut)
The image is acquired in the coconut drying industry. The environmental parameter differs from place to place which affects the image quality and results in noises as discussed by Pavan Kumar and Padmaja (Citation2013). The noise affected image is t retrieved using basic filters such as adaptive filter and mean filter as discussed by (Ramesh, Sasikala, and Paramanandham Citation2020; Sasikala and Murugesan Citation2017) . The adaptive filter results with high PSNR value, which is used to recover the image from external noises. The noise removed image undergoes segmentation process.
Segmentation
The segmentation is carried out to differentiate the sulfur and normal coconut. The segmentation is to separate the patches in sulfur fumigated copra. The copra is examined under three methodologies such as active contour, multi-thresh and threshold-based segmentation. Comparing these three methodologies active contour segments the copra with greater accuracy.
Active Contour
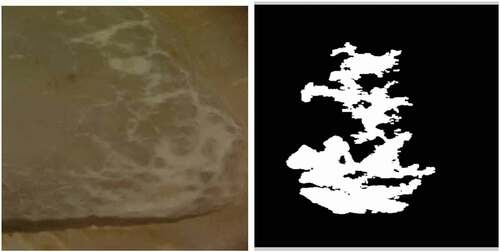
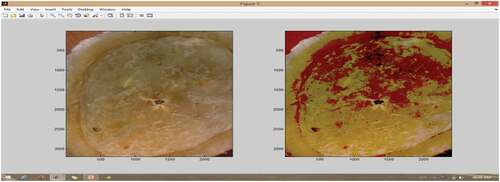
Normally sulfur fumigation over coconut forms a sulfur patch on the white layer of coconut. The active contour separates the sulfur patch (foreground layer) from the white layer (background layer). The mask is applied to the coconut to separate the patch from its background. The mask separates the region of the patch from the background as shown in . This methodology provides a greater accuracy for segmenting the patches present in the copra.
Multi-Thresh
Figure 2. Active contour segmentation of sulfur copra.
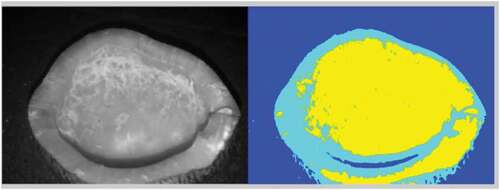
Multi-thresh displays the uniqueness of the system. The multi-thresh is applied to sulfur coconut. Multi-thresh results in three color planes. The Yellow color plane has the same intensity, which has more sulfur content. The segmentation has an uniqueness of 188. The multi-thresh displays the three-color plane which is shown in . This method deploys the accuracy of segmenting the patches in copra.
Threshold-Based Segmentation
Figure 3. Multi-thresh of sulfur copra.
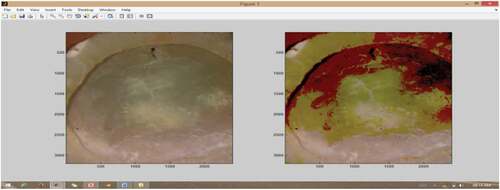
Threshold segmentation highlights the low-intensity region by threshold. The threshold is set to 100. When T < 100 it highlights the region of low intensity. The low-intensity region has low content of sulfur. The region of T > 100 is not highlighted which has more sulfur content. The threshold value is tested for 50 to 150 and chosen as 100. The threshold segmentation is tested for sulfur fumigated image as shown in . The method does not have a greater vision to segment the patches in copra.
Figure 4. Threshold-based segmentation of sulfur added image.
The threshold segmentation is tested for normal coconut image as shown in .
Figure 5. Threshold-based segmentation of normal image.
From the above methodologies active contour results with good segmentation, which classifies the sulfur patches with more accuracy. The active contour covers the entire spaces of white patches, leaving the remaining spaces in copra. The segmented image undergoes feature extraction using GLCM.
Feature Extraction
GLCM Features
The features of normal and sulfur fumigated coconut are measured using GLCM and Intensity features. The feature measures the different properties of copra, which helps to classify the normal and sulfur copra. It is second-order statistical texture feature which is extracted by using co-occurrence matrix as Rampun, Strange, and Zwiggelaar (Citation2013). It measures the variation of gray levels that occurred in an image in which pixels ‘i’ is spatially related with pixels ‘j’ where i and j are gray level pairs, P is a GLCM element, p(i,j) is a joint probability of gray level pairs. The measured GLCM features are listed below.
Contrast
The contrast is pixel variation in grayscale which measure the quality of an image. The contrast of sulfur and normal copra are similar. The value of contrast for sulfur image lies from 0.02 to 0.04. The contrast of normal image is similar to sulfur image which lies from 0.02 to 0.05. The contrast is measured by using the formula which is shown in EquationEquation (1)(1)
(1) .
Correlation
The correlation of image is the difference between each pixel values. The correlation of image for Sulfur and normal copra is 0.9. The correlation is measured using EquationEquation (2)(2)
(2) , where
is the mean of an image and
is the Standard Deviation of an image.
Energy
The energy of image is the confined change in pixels. It is the rate of change in pixel between sulfur and normal copra image. The variation between the pixels in the images is calculated for normal and sulfur fumigated copra using EquationEquation (3)(3)
(3) .
Homogeneity
The homogeneity is the measure of similarity between the pixels in an image. It measures the relation between the neighborhood pixels in the image. The similarity is measured by using EquationEquation (4)(4)
(4) .
describes the feature extracted for sulfur fumigated copra. The GLCM and intensity features are extracted by using the generalized formula which is discussed. The feature which differs for various images and it is given as input to the various classification methods.
Table 1. Feature extracted for sulfured copra image
Intensity Features
Pixel intensities are the simplest available feature that measures entropy, mean, standard deviation, and median. It measures the luminousness and aptness of an image. The intensity features like entropy, mean, standard deviation, median, maximum, and minimum values are measured and listed below.
Entropy
The entropy is the degree of randomness in an image. It is a measure of uncertainty in an image. It is mainly used to mark the texture of an individual image. The entropy is calculated by using EquationEquation (5)(5)
(5) .
Mean
The mean of the image is the average of points in an image. It describes the brightness of color and it is the sum of pixel values to the total number of values. The mean value is represented using EquationEquation (6)(6)
(6) .
Standard Deviation
The standard deviation is the mean square value. SD measures the variation of pixels in an image. It spreads out the image region, which measures the distance from the mean value using EquationEquation (7)(7)
(7) .
Median
The median is a middle value of intensity. The median values lie from 125 to 200 for sulfur copra and 70 to 120 for normal copra images.
Max Intensity and Min Intensity
The maximum intensity is the maximum value of the image and the minimum intensity is the minimum value of an image. The maximum and minimum intensities are measured through EquationEquation (8)(8)
(8) .
describes the feature extracted for normal copra which is not fumigated. It is measured to show the differences of extracted features from sulfur fumigated copra. Both sulfur fumigated copra and normal copra features are extracted to classify both.
Table 2. Feature extracted for normal copra image
System Description and Performance of Parameters with ANFIS, KNN, and Feed Forward
To achieve the purposes of minimizing the prediction error by training and testing similar patterned behavior; and to reduce the number of training examples within a training data set, network training is more efficient. The extracted features from GLCM are trained and tested using K-means NN (K means Neural Network), ANFIS (Adaptive Neuro Fuzzy Inference System), and NN pattern recognition- Feed forward network. When the response variable is categorical, then the problem is called as a classification problem.
Methodology 1: ANFIS
ANFIS provides the accuracy of classification by matching, training, and testing data. The result of classification using ANFIS is shown in . It describes the training data by dot and testing data by asterisk. The 10 inputs are given in the model and it generates 1 output. For each individual input, 10 Gaussian membership functions are generated, which leads to an output.
Figure 6. Classification using ANFIS.
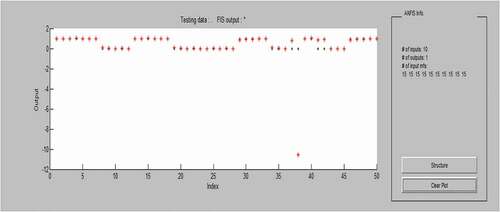
describes about the accuracy of ANFIS which is measured by obtained ANFIS GUI. TP, FP, TN, FN is measured using dotted and asterisk in the output. As a result, sensitivity, accuracy, precision, recall, and F-Measure are calculated using the four parameters (TP, FP, TN, and FN).
Table 3. Accuracy Measures of ANFIS
The ANFIS architecture consist of 10 input layers and 1 output layer. There are 173 trained set of data and 50 test data to measure the classification parameters of ANFIS. As Hyper parameters, the correlation coefficient (R2 value), MSE values are measured. The MSE is 0.8291 for training and 1.5391 for testing. The R2 value is measured as 0.7963. The number of nodes used in ANFIS is 343, linear parameter is 165, and non-linear parameter is 300. The total parameter is 465, and 15 fuzzy rules are used in ANFIS.
Methodology 2: KNN Classifier
KNN classifies the neighbor pixels by joining as a cluster and provides a descent classification with a accuracy of 80%, which is lower than ANFIS. describes about the measure of accuracy parameters similar to the ANFIS parameters. The accuracy of KNN algorithm goes to 81 when k = 3 (i.e. considering the nearest neighbor value is 3). If k value is increased more than 3, the accuracy tends to decrease.
Table 4. Accuracy measures of KNN
Methodology 3: Feed-Forward Network
The structure of the feed-forward network with the hidden layers from the MATLAB simulation is shown in .
Figure 7. MATLAB simulation setup of feed-forward network.
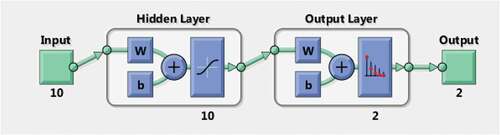
Pattern recognition follows feed forward and it classifies inputs according to the target specified. It is represented by the value ‘1ʹ for a target and ‘0ʹ for rest. The three samples representing training, testing, and validation are divided randomly. The dataset is divided into 70% of training, 15% of validation, and 15% of testing in neural network modeling as discussed by Sada and Ikpeseni (Citation2021). The training algorithm such as LM (Levenberg- Marquardt (LM), Scalar conjugate gradient (SCG), Bayesian Regularization(BR) is determined to measure the best performance. Along with training algorithm activation functions such as tansig, logsig are evaluated to measure the best performance in training and testing. The hyper parameters such as correlation coefficient (R2), MAE, RMSE, Number of Neurons, Activation Function, and Batch Size are measured to determine the accuracy of network as (Athira et al. Citation2018; Selvin et al. Citation2017).
Cross entropy and error percentage are calculated to measure the performance of the network. Minimizing cross entropy gives better performance in classification. Error percentage decides the data that is misclassified. The error percentage should be in minimum condition for a good classification. Confusion matrices in are the consequent for training, testing, and validation. Overall it decides the performance of classification of the sulfur in the copra. All Confusion matrix is used to detect TP, FP, TN, and FN visually and to calculate the classification parameters like accuracy, sensitivity, specificity, precision, and recall. From the confusion matrix the accuracy of training is measured as 98.2% and testing is 92 and overall accuracy of all the confusion matrices is 96.5%. From the value of TP, FP, TN, FN, the sensitivity value is 95, specificity value is 97, precision value is 97, and recall value is 95.
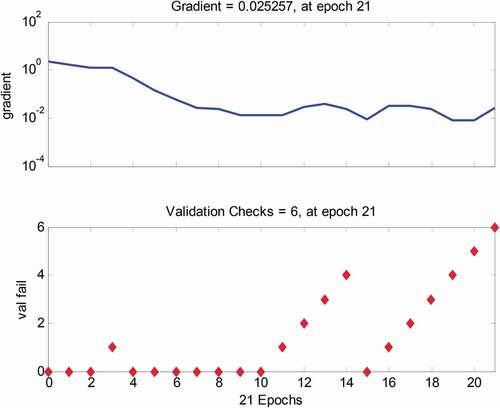
Training state provides the training record of the data in . It has a gradient of 0.025257 at epoch 21. describes the accuracy measures of pattern recognition in which TP, FP, TN, and FN are measured to determine the accuracy parameters such as sensitivity, specificity, precision, recall, and F-Measure.
Table 5. Accuracy measures of NN pattern recognition
Figure 8. Confusion matrix.
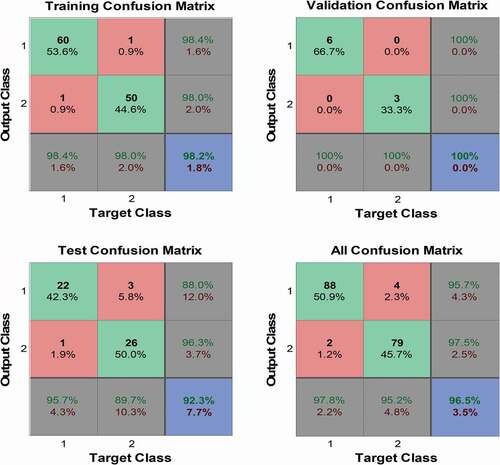
Figure 9. Training performance.
describes hyper parameter values such as MSE, MAE, and R2 are measured for different algorithms. Levenberg-Marquardt (LM) measures mean square value of 0.0287 compared to Scalar conjugate gradient (SCG), Bayesian Regularization (BR).
It also describes the measurement of statistical evaluation of different training algorithms in which LM algorithm measures the highest R2 value of 0.9407. MAE value of LM algorithm is measured as 0.072 for training and 0.0681 for testing, which records the lowest statistical parameter with the lowest error. So LM algorithm is chosen as the best learning algorithm with higher accuracy of classification.
Table 6. Statistical evaluation of different training algorithm
Comparison of KNN, ANFIS, and NN
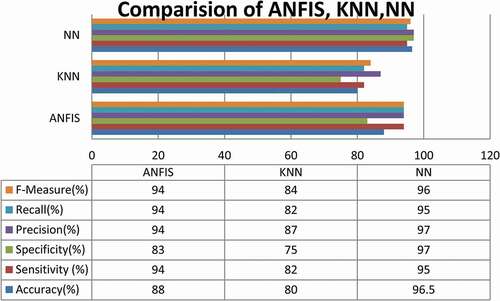
represents the comparison of ANFIS, KNN, and pattern recognition. By comparing other classification methods, the neural network pattern recognition method provides the greatest accuracy as stated in Selvin et al. (Citation2017). Comparison with other classification methods is shown in .
By comparing the hyper parameters of ANFIS and NN Pattern Recognition the R2 values are measured as 0.9407 for NN Pattern recognition and 0.7963 for ANFIS. By comparing MSE value 0.0287 error values for pattern recognition and 0.8291 error value for ANFIS. In the comparison is made by comparing all three classification accuracy parameters. The neural network pattern recognition has more correctness of classification by comparing the other two networks.
Table 7. Comparison of classification method
Figure 10. Comparison chart of classification.
Conclusion
Information obtained from the extraction of the feature is categorized using supervised learning algorithms such as pattern recognition of neural networks, ANFIS, and KNN to differentiate the sulfur fumigated and non-sulfur fumigated copra. By using GLCM and intensity features classification part is successfully determined. The various training and testing parameters are determined to measure to study ANFIS, KNN, and Neural network pattern recognition.
From the result of Pattern recognition, ANFIS, and KNN the accuracy of neural network pattern recognition is high (96.5%) compared to ANFIS and KNN. The pattern recognition is superior to ANFIS by considering the R2 and MSE values. The R2 value is 0.9407 for Pattern Recognition which is loftier than ANFIS. The predicted error value by using MSE is low (0.0287) in NN Pattern recognition and higher (0.8291) in ANFIS. It is concluded that by applying supervised machine learning algorithm for classifying sulfur fumigated and normal copra, NN Pattern recognition classifier shows more accuracy than ANFIS and KNN.
Disclosure Statement
No potential conflict of interest was reported by the author(s).
- Arivazhagan, S. 2010. Fruit recognition using colour and texture features. Journal of Emerging Trends in Computing and Information Sciences 2 (2):90–94.
- Ashok, V., 2014. Automatic quality evaluation of fruit using probabilistic neural network approach. International Conference on Contemporary Computing and Informatics (IC31), Mysore,308–11.
- Aswin, S., P. Geetha, and R. Vinayakumar 2018. Deep learning models for the prediction of rainfall. In 2018 International Conference on Communication and Signal Processing (ICCSP),Chennai(pp. 0657–61). IEEE.
- Athira, V., P. Geetha, R. Vinayakumar, and K. P. Soman. 2018. Deepairnet: Applying recurrent networks for air quality prediction. Procedia Computer Science 132:1394–403. doi:https://doi.org/10.1016/j.procs.2018.05.068.
- Bakhshipour, A. 2012. Vision based features in moisture content measurement during raisin production. World Applied Sciences 7:860–69.
- Deepa, P., and S. N. Geethalakshmi. 2013. Comparative analysis of feature extraction methods for fruit grading classifications. IJETCAS 2 (9):221–25.
- Dubey, S. R., and A. S. Jalal 2012. Detection and classification of apple fruit diseases using complete local binary patterns. IEEE International Conference on Computer and Communication Technology (ICCCT-2012), Allahabad, India,3: 44–58.
- Elamaran, V. 2012. FPGA implementation of point processes using Xilinx system generator. Journal of Theoretical and Applied Information Technology 41 (2):201–06.
- Gokulnath, B. V., and G. Usha Devi. 2020. A survey on plant disease prediction using machine learning and deep learning techniques. Inteligencia Artificial 23 (65):136–54. doi:https://doi.org/10.4114/intartif.vol23iss65pp136-154.
- Jhuria, M. 2013. Image processing for smart farming: Detection of diseases and fruit grading, IEEE Second International Conference on Image Information Processing (ICIIP), India, 521–26.
- Kalavathi Devi, T., and C. Venkatesh. 2010. Wave pipelined VLSI architecture for a viterbi decoder using self reset logic with 0.65 nm technology. International Journal of Applied Science and Engineering 8 (1):65–75.
- Kumari, S., and Neelamegam. 2015. Analysis of apple fruit diseases using neural network. Research Journal of Pharmaceutical, Biological and Chemical Science 2 (2):641–46.
- Leemans, V., Magein, H., & Destain, M. F. 2000. On-line fruit grading according to external quality using machine vision. AgEng Warwick 2000-Abstract part 1-Agricultural engineering into the third millennium, 28-29.
- Mishra, A. 2014. The quality identification of fruits in image processing using MATLAB. International Journal of Research in Engineering and Technology 3 (10):123–29.
- Pavan Kumar, U., and P. Padmaja. 2013. Image enhancement using adaptive filtering. International Journal of Engineering Trends and Technology (IJETT 6 (1):1–4.
- Ramesh, S., S. Sasikala, and N. Paramanandham. 2020. Segmentation and classification of brain tumors using modified median noise filter and deep learning approaches. Multimedia Tools and Applications 1:25.
- Rampun, A., H. Strange, and R. Zwiggelaar, 2013. Texture segmentation using different orientations of GLCM features. Proceedings of the 6th International Conference on Computer Vision/Computer Graphics Collaboration Techniques and Applications, Berlin, Germany (pp. 1–8).
- Raut, N. P. 2013. FPGA implementation for image processing algorithms using Xilinx system generator. IOSR Journal of VLSI and Signal Processing(IOSR-JVSP) 2 (4):26–36. doi:https://doi.org/10.9790/4200-0242636.
- Sada, S. O., and S. C. Ikpeseni. 2021. Evaluation of ANN and ANFIS modeling ability in the prediction of AISI 1050 steel machining performance. Heliyon 7 (2):e06136. doi:https://doi.org/10.1016/j.heliyon.2021.e06136.
- Sasikala, S., and G. Murugesan. 2017. Efficient digit serial architecture for sign based least mean square adaptive filter for denoising of artefacts in ECG signals. International Journal of Biomedical Engineering and Technology 23 (2–4):335–44. doi:https://doi.org/10.1504/IJBET.2017.082672.
- Selvin, S., R. Vinayakumar, E. A. Gopalakrishnan, V. K. Menon, and K. P. Soman, 2017. September. Stock price prediction using LSTM, RNN and CNN-sliding window model. 2017 international conference on advances in computing, communications and informatics (icacci),Udupi, India (pp. 1643–47). IEEE.
- Specht, D. F. 1994. Experience with adaptive probabilistic neural network and Adaptive general regression neural network. In Proceedings of the IEEE International Conference on Neural Networks,Orlando, FS,USA 2: 1203–08.
- Stephen Sagayaraj, A., and T. Kalavathi Devi. 2015. Characteristic recognition of copra using image processing. International Journal of Engineering Science Invention Research & Development II, V:272–79.
- Stephen Sagayaraj, A., G. Ramya, N. Dhanaraj. 2016. Analysis of sulphur content in copra. ICTACT Journal on Image and Video Processing. 9(2):1882–86. doi:https://doi.org/10.21917/ijivp.2018.0267.
- Thangavel, K. D., S. Palaniappan, and S. K. Shanmugam. 2020. Performance analysis of VLSI architecture of viterbi decoder in WLAN using the sleepy keeper technique. comptes rendus de l academie bulgare des sciences 73 (8):1123–31.
- Unay, D., and B. Gosselin. 2010. Automatic grading of Bi-coloured apples by multispectral machine vision. Journal of Computers and Electronics in Agriculture COMPAG-246:1–9.
- Vilas. 2013. Improving quality of apple using computer vision and image processing based grading system. International Journal of Science and Research 4 (4):543–46.