
 ?Mathematical formulae have been encoded as MathML and are displayed in this HTML version using MathJax in order to improve their display. Uncheck the box to turn MathJax off. This feature requires Javascript. Click on a formula to zoom.
ABSTRACT
Taking calculated risks against bowlers plays an imperative role in chasing down a target in cricket. Thus, it becomes important for teams to calculate how many runs they should score off every over they face in an innings. The runs a team should score off an over is a function of the difficulty of scoring against the bowler bowling that over, the runs that have already been scored, the target, and the difficulty of scoring runs against the rest of the bowlers. However, the runs that can be scored in an over produces a state space with a branching factor of 37. Such a large state space makes using an uninformed search algorithm impractical. This research proposes the use of the A* algorithm to search the state space to find the number of runs that should be scored off every over during a run chase.
Introduction
Cricket
Cricket is a sport that is popular in the Indian subcontinent, England, Australia, New Zealand, South Africa, and the Caribbean. It is a bat-and-ball game that has around 2.5 billion fans across the globe, making it the second most popular sport in the world (Altham and Swanton Citation1938) .
Figure 1. The four types of bowlers indicated by each quadrant based on strike rate and economy rate.
A game of cricket is played between two teams, each of which consists of eleven players. Each team takes turns to bat and bowl, the order of which is decided by the team winning the toss.
A match in cricket consists of two innings in the shorter formats and four innings in Test cricket. An innings comprises of one team batting and the other team bowling. The teams swap their roles for the following innings. An innings consists of a specified number of balls in the shorter formats and an unlimited number of balls in Test cricket. A ball is the act of a bowler bowling the ball at a batsman.
An over is supposed to be bowled by one bowler only and no two successive overs can be bowled by the same bowler. A maximum of 10 overs is allowed for a bowler in ODIs whereas, in T20s, a bowler is allowed a maximum of 4 overs.
The game is played in a roughly circular ground with a 22-yard rectangular strip called the pitch in the middle (The pitch Law Citation2017).Two wickets, formed by three stumps and two bails, are placed at either end of the pitch.
During an innings, a batsman stands at either end of the pitch. The bowler bowls from one end to the batsman at the other end. The players from the bowling team, save for the bowler, occupy different positions in the playing field to field the ball struck by the batsman.
Batsmen try to score runs by hitting the ball out of the boundary line or by running from one end of the pitch to the other. Every time the batsmen cross over to the other end, the batting team is given one run. If the ball passes the boundary line without touching the ground, the batting team is awarded six runs while if the ball makes contact with the ground before going over the boundary, four runs are given to the batting side.
An innings ends when ten batsmen are dismissed. When both the innings end, the team that has scored the highest number of runs wins.
A* Algorithm
The A * algorithm is an informed search algorithm that was first published by Hart, Nilsson, and Raphael (Citation1968). Created to plan the path of the Shakey robot, this algorithm helps find the smallest cost path from the start node to a goal node in a graph (Doran and Michie Citation1966).
The algorithm starts from the start node and decides which node to select next based on the cost between the current node and the next node and an estimation of the cost to reach a goal node from the next node. Always the node with the least total cost is selected. This can be defined by the following equation:
Equation 1 Total cost in A* algorithm
Where g(n) is the cost of the path between the current node and the next node and h(n) is a heuristic value that gives an estimate of the cost of the path between the next node and a goal node.
The algorithm adds all the child nodes of the start nodes to a list and selects the node with the least total cost. Once the next node is selected, its child nodes are added to the list and the selected node is removed from the list. The algorithm, then, once again, selects the node with the least total cost and adds its child nodes to the list (Sabri, Radzi, and Samah Citation2018).
The algorithm continues to do this until the node removed from the list is a goal node.
Problem Domain
In cricket, batsmen are expected to score as many runs as possible without getting dismissed. This results in a dilemma for batsmen. Trying to score runs comes at the risk of getting dismissed while without enough runs, the team might lose. So, batsmen look to score runs in such a way that minimizes the risk of losing wicket.
When a team chases a target, i.e., when they bat second, the job of the batsmen becomes easier as they know how much risk they need to take to reach a target, allowing them to plan their innings better.
However, it is a common belief that batting second is tougher than batting first. Dawson et al. found in their study that teams winning the toss and batting first have a significantly higher chance of winning than teams that bat second after winning the toss (Dawson et al. Citation2009). This can be attributed to the absence of a proper batting strategy when chasing a target. Thus, it becomes important to devise an effective batting strategy to help teams successfully chase targets.
Bowlers have a varying set of skills and abilities. Consequently, scoring runs against certain bowlers is easier than against others. So, batsmen try to score as many runs as possible against the easier bowlers while they try to minimize risks against the tougher bowlers. Hence, as to how many runs should be scored in each over against different bowlers becomes a very pertinent problem in cricket.
Therefore, to successfully chase down a target in cricket, it is paramount for batsmen to decide how many runs should be scored against different bowlers in different stages of an innings.
A state space can be created using the possible number of runs that can be scored off every over. The number of levels in the state space will depend on the number of overs that would be bowled in an innings. To find a goal state, the runs corresponding to the chosen state in every level can be summed until the sum is greater than or equal to the target score.
If the extras bowled in cricket are ignored, a team can score anything between zero and thirty-six runs in an over. Thus, the state space will have a branching factor of 37. This makes it unpragmatic to use uninformed search algorithms to find the optimal path. This research proposes the use of the A* algorithm to find the optimal path to the goal state in the state space.
Research Motivation
Teams often fail batting second in cricket because of the absence of an effective strategy. Previous research works have mostly only focused on optimizing the runs scored in the first innings. Moreover, there is a continuous belief among cricket teams that batting first and setting a high score is best way to win a limited-overs match. However, with cricket pitches remaining good for batting throughout a game in recent times, batting first should not offer any advantages. Besides, the psychological disadvantage in batting second has not yet been formally studied. Therefore, the reluctance to chase in cricket can be mostly attributed to the absence of a good batting strategy. This research work takes this as the motivation to introduce a novel method to plan a chase in cricket.
The literature on devising batting strategies to chase a target is scarce. This paper introduces a novel way to formulate a batting strategy while chasing a target using the A* algorithm.
This paper first discusses the problem domain and the importance of devising a chasing strategy, followed by the related work. Then, the research methodology, and the testing strategies are discussed. Finally, this paper discusses the results, interprets the results, and provides a conclusion.
Related Work
Even though analytics in cricket is almost as old as the sport itself, historically, it has been restricted to just crude data analysis using averages and strike rates. Research on advanced data analytics and data-driven strategies is in its nascent stage at the time of writing. One of the major reasons for this is the unavailability of ball-by-ball data in cricket.
Consequently, the literature on formulating batting strategies while chasing a target is minimal. Thus, the proposed research work of devising a batting strategy using the A* algorithm is a novel method that introduces a data-driven approach to constructing the second innings.
A survey that was done of the existing literature as a part of this study found that the existing research work can be categorized into following taxonomies:
Predicting the outcome of a match or innings
Simulating cricket matches
Score revisal
Finding an optimal batting strategy
Predicting the Outcome of a Match or Innings
D. Bose et al. used Cumulative Sum control charts to predict the outcome of a limited-overs game in the second innings (Bose and Chakraborty Citation2019). D. Thenmozhi et al. made use of Gaussian Naïve Bayes, Support Vector Machine, K-Nearest Neighbor, and Random Forest algorithms to predict the result of a T20 match in the Indian Premiere League (Thenmozhi et al. Citation2019). The conditional probability of a win at any stage of a One-Day International game was estimated using a Monte Carlo simulation technique by H. Norton et al (Norton, Gray, and Faff Citation2015). S. Raizada et al. used Binary Logistic Regression to find the outcome of a World Cup One-Day match based on the first innings data (Raizada et al. Citation2019).
Simulating Cricket Matches
This taxonomy is closely related to the taxonomy of predicting the outcome of a match or innings. Both taxonomies include studies that attempt to predict an outcome in cricket. However, this taxonomy (simulating cricket matches) differs from the first taxonomy by attempting to predict outcomes at a more granular level.
For instance, T. Swartz et al. simulated a cricket game by predicting the outcomes of every ball bowled in a match (Swartz, Gill, and Muthukumarana Citation2009).
By analyzing the data of international and domestic T20 matches, T. Lopes et al. produced a ball-by-ball simulation of T20 batting (Lopes et al. Citation2021).
Score Revisal
Score revisal is an important area of research in cricket since weather interruptions often demand the revisal of scores to complete a game. The Duckworth-Lewis-Stern method is by far the most popular method, and is widely used in international as well as domestic games to revise a score in cricket (Stern Citation2016).
A research work carried out by M. Samad et al. (Samad and Sen Citation2021) proposed a score revisal strategy to nullify the batting-first advantage Dawson et al. (Dawson et al. Citation2009) proved that teams have in cricket. The authors argued in their paper that teams that bat first often enjoy superior batting conditions and do not have to contend with the pressure of chasing a score. Thus, they propose a way to revise the target a chasing team has to get to, thereby ensuring parity.
Finding an Optimal Batting Strategy
This taxonomy is closely related to this study as studies in this taxonomy propose different methodologies to devise various batting strategies.
D. Modekurti et al. developed a deterministic model to help a team batting first in a T20 game set an optimal target for the oppositions (Modekurti Citation2020). The model considers the runs scored and wickets lost at different stages of an innings, and the nature of the pitch in finding the optimal target.
A method to optimize batting partnerships was formulated by studying the probability of a batting partnership being broken in the first innings of a limited-overs match by P. Brown (Brown Citation2017).
Studies by I. Preston et al. and P. Norton et al. used dynamic programming techniques to find optimum batting strategies in limited-overs matches (Preston and Thomas Citation2000)(Norton and Phatarfod Citation2008).
I. Preston et al. takes into consideration the runs that have been scored, the target to achieve, and the number of wickets lost to find the optimal rate of scoring. However, the quality of the bowling and the number of overs each bowler has have not been considered.
P. Norton et al. proposed a method to decide whether a ball should be attacked, defended to pushed for a single based on the quality of the ball, the wickets and overs remaining. However, the problem with this method is that it discounts the quality of the batsmen and bowlers. For example, a good ball to one batsman can be a bad ball to another batsman. Besides, if the bowlers who are to bowl the next overs are of a very high quality, then it makes less sense to even defend a good ball in the current over.
Thus, from the literature survey, it can be seen that no study takes into account the quality of bowlers at disposal when devising a batting strategy and this study identifies it as a research gap. By incorporating the quality of bowlers in formulating the batting strategy, this research work can said be the first of its kind.
Methodology
This study took into account the number of runs scored, the number of runs that remains to be scored, and the quality of the bowlers. The number of wickets lost was not considered because the significance of it in a run chase is minimal in comparison to when batting first.
In order to use the A * star algorithm, two functions need to be defined – a cost function and a heuristic function (Hart, Nilsson, and Raphael Citation1968).
The cost of scoring a certain number of runs in an over was defined by the risk and difficulty associated with scoring runs against a bowler. In cricket, there are two types of bowlers who pose a challenge to the batsmen, viz. wicket-taking bowlers and economical bowlers.
Wicket-taking bowlers, as the name implies are bowlers who are adept at dismissing batsmen. The economical bowlers are bowlers who are adept at not giving away runs to the bowlers. The number of balls taken on average to dismiss a batsman (the strike rate) gives an idea of how good a wicket-taker a bowler is. On the other hand, the number of runs given away every over on average (economy rate) gives an indication of how economical a bowler is.
Thus, a batsman should, ideally, not take too many risks against wicket-taking bowlers by minimizing the number of runs they attempt to score. At the same time, batsmen can’t score too many runs against economical bowlers even if they attempt to.
However, these metrics are confounded by the fact that some wicket-taking bowlers could have a high economy rate and some economical bowlers could have a higher strike rate. A wicket-taking bowler having a high economy rate means that while there is a risk of losing wickets, runs can be scored off that bowler. Similarly, an economical bowler having a high strike rate could mean that batsmen may not have attempted to score many runs against the bowler.
Therefore, a metric that combines both the risk and difficulty associated with scoring runs against a bowler had to be used to formulate the cost function. Consequently, the bowling average was chosen as the metric. The bowling average gives the runs given away by the bowler for every wicket they took. A higher average implies that the bowler either has a higher strike rate or a higher economy rate, or both and thus, is someone against whom runs can be scored easily. A lower average implies that the bowler either has a lower strike rate or a lower economy rate, or both and thus, is a difficult bowler to score runs against.
To calculate the cost associated with scoring a certain number of runs in an over against a certain bowler, the number of runs was divided by the average of the bowler. A bowler with a high average will, hence, produce a lower cost and vice versa.
Equation 2 The cost function
The heuristic cost was calculated by subtracting the runs to be scored in an over from the target and then dividing it by the sum of the average of the bowlers who will be bowling the remaining overs.
Equation 3 The heuristic cost function
If a node with fewer runs is selected, then the cost will be less. However, since a node with fewer runs is selected, the number of remaining runs to be scored will be high, making the heuristic cost high. If a node with a lesser heuristic cost is selected, that node will naturally have a higher cost.
This can be visualized via a plot. Let us assume that in a four-over game, 20 runs are needed to be scored to win the game. All the bowlers average 20. So, the cost of scoring x number of runs in the first over can be defined as:
Equation 4 The cost of scoring x runs against a bowler averaging 20
The heuristic cost can be defined as
Equation 5 The heuristic cost after scoring x runs
shows the plot drawn for these two functions.
Figure 2. The red line indicates the cost and the blue line indicates the heuristic cost.
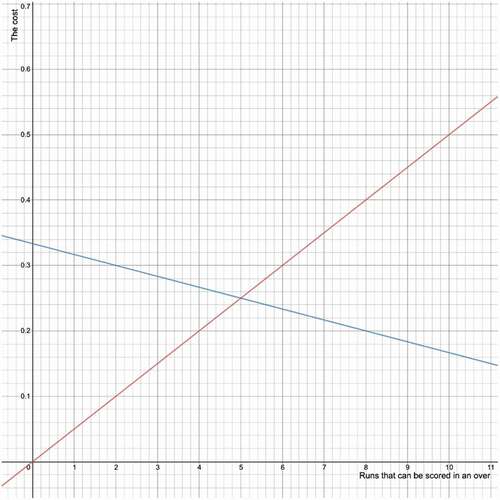
The plot drawn in shows the cost function (indicated by red) and the heuristic cost function (indicated by blue). It can be observed that the cost increases with the number of runs to be scored in an over. This is because the more the runs batsmen attempt to score, the greater the risk of losing their wicket.
The heuristic cost can be seen decreasing with the number of runs to be scored in an over. The heuristic cost gives the cost of scoring runs in the future. If more runs are scored of the current over, then the number of runs to be scored in the following overs will be less. If less runs are to be scored in the following overs, then the heuristic cost will be low. Thus, we can observe the heuristic cost curve descending.
The intersection point of these two lines is the ideal number of runs that should be scored in the first over.
When all the bowlers average the same, the same number of runs should be scored off every over since the difficulty level against every bowler is the same.
Since the target is 20,
Equation 6 The expected number of runs to be scored in an over
The corresponding x-axis value of the intersection point is 5 and that is same as the number of runs that was obtained through the above calculation.
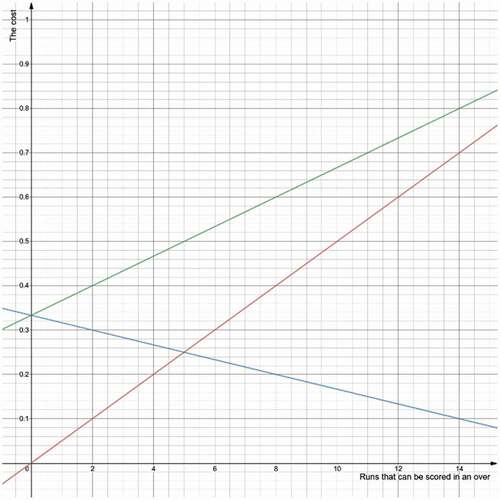
However, since the cost and the heuristic cost are added in the A* algorithm to obtain the total cost, as shown in the plot below, a linearly increasing total-cost line was obtained.
In the A* algorithm, the total cost is the sum of the cost and the heuristic cost. Thus, when linear cost and heuristic functions are used, a linearly ascending total cost curve was obtained as shown in .
Figure 3. The red line indicates the cost, the blue line indicates the heuristic cost, and the green line indicates the total cost.
This resulted in the outputs obtained being optimal yet defying logic. For instance, when the algorithm was run for the above example, the output obtained was 6 runs off the first over, and 7 runs each off the second and third over, the cost of which was:
Equation 7 The obtained total cost
This is the same as the cost of scoring 5 runs off every bowler.
Equation 8 The expected total cost
However, it can be observed that the output of the algorithm completes the chase within three overs and the number of runs to be scored against each bowler is not the same despite all the bowlers having the same average.
This proved that a linear cost function will not be suitable to accomplish the goal of the study. Since the total cost should be high for both the extreme outcomes of an over – i.e., for no runs being scored and the maximum runs being scored – the total cost should take the shape of a parabola.
To obtain a parabolic curve, the function should be converted to a polynomial function. This produced the following cost function:
Equation 9 Polynomial cost function
The heuristic function:
Equation 10 Polynomial heuristic cost function
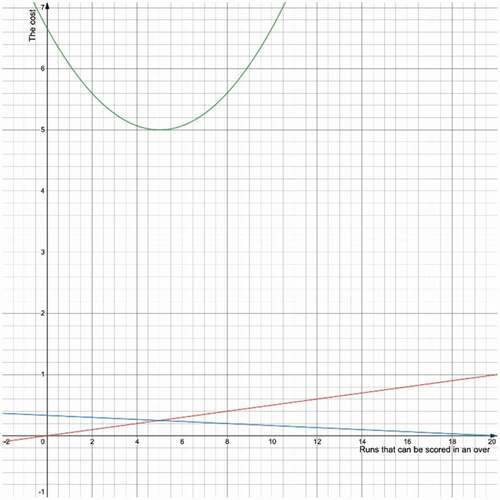
Calculating the total cost using the above functions produced the following plot.
From , it can be observed that the x-axis value of the lowest point of the total cost curve is the same as the x-axis value of the intersection point of the cost and heuristic functions. When the algorithm was run with the updated cost and heuristic functions, the expected outcome of five runs off every over was obtained.
Figure 4. The red line indicates the cost, the blue line indicates the heuristic cost, and the green line indicates the total cost.
The cost value of the previous output of the algorithm computed using the updated cost function is as follows:
Equation 11 The total cost calculated using the polynomial cost function for the output of the linear cost function
The cost value of the current output of five runs off every over computed using the updated cost function is as follows:
Equation 12 The cost of the expected output calculated using the polynomial cost function
Thus, it can be seen that the polynomial cost and heuristic functions produced a more logical output.
The A* algorithm was written using Python and the polynomial cost and heuristic functions (Equation 9 and 10) were implemented. The target score and the bowling order and the bowling average of the bowlers were input into the program to obtain the number of runs that should be scored off every over.
Testing
To test this strategy, data from the first round of the Abu Dhabi T10 tournament that was played in January 2021 was used. The first round consisted of 12 matches. Each game consisted of two innings of 10 overs each.
First, the cost of every over was calculated based on the actual number of runs scored using the cost function. Then, the A* algorithm was run and the runs that should have been scored off every over was obtained. Finally, the relevant cost of scoring the calculated runs off every over was computed and compared against the actual cost.
Since T10 is a fairly new format, the T20 average of bowlers was taken into consideration to provide a better sample space. The average of debutant players was set to the average bowling average of the bowlers who played in the tournament.
Results
shows the results obtained for the first game of the tournament.
Table 1. A comparison between the incurred cost and the calculated cost
The total actual cost for the 12 matches was found to be 781.88. The total computed cost was 660.1. Thus, the proposed batting strategy reduced the cost by 15.57%. A reduced cost means the risk was greatly reduced. Consequently, the batting strategy devised using the A* algorithm could reduce the risk by 15.57%.
Discussion
The A* algorithm is an optimal and complete algorithm, so it is guaranteed to find the least-cost path to the target (Russel and Norvig Citation2010). However, it should be remembered that both the algorithm and the test carried out used the same definition of the cost. Thus, it does not come as a surprise that the algorithm, by virtue of its optimality and completeness, reduced the cost incurred by a team during a run chase.
Nonetheless, the effectiveness of this algorithm during an actual game is contingent on the validity of the cost function. Verifying the validity of the cost function is difficult owing to the absence of a widely accepted mathematical model to predict the result of a cricket game. Obtaining experimental evidence to verify the validity of the cost function will require a cricket team to use the cost function to make decisions over an appreciable number of games and thus, cannot be considered pragmatic either.
Furthermore, the cost function used in this study does not take into account the performance of a certain batsman against a bowler. Thus, defining the cost function based only on the overall average of a bowler may be considered inadequate. Consequently, the average of a bowler against the batsmen who would be facing that bowler would provide a more accurate cost function. However, finding such data is made difficult by the absence of free availability of such statistics in cricket.
Conclusion
The study examined the possibility of the use of the A* algorithm to calculate the number of runs that should be scored off every over in a limited-over innings during a run chase. The cost function was defined as the square of the number of runs to be scored divided by the average of the bowler, and the heuristic function was defined as the square of the difference between the target and the number of runs to be scored, divided by the sum of the average of the remaining bowlers. The study also demonstrated why a polynomial function is more suitable than a linear function to address the problem at hand. In order to test the algorithm, the scorecard from a T10 match was used and the algorithm was proven to reduce the cost incurred by the chasing team by 6.62%.
Disclosure statement
No potential conflict of interest was reported by the author(s).
References
- Altham, H. S., and E. W. Swanton. 1938. A history of cricket. Second Accessed October 20, 2021. https://www.worldcat.org/title/history-of-cricket-second-edition-by-hs-altham-and-ew-swanton-etc/oclc/557645553.
- Bose, D., and S. Chakraborty. 2019. Managing in-play run chases in limited overs cricket using optimized CUSUM charts. Journal of Sports Analytics 5 (4):335–46. doi:https://doi.org/10.3233/JSA-190342.
- Brown, P. O. 2017. Optimising Batting Partnership Strategy in the First Innings of a Limited Overs Cricket Match.
- Dawson, P., et al. 2009. To bat or not to bat: An examination of match outcomes in day-night limited overs cricket. Journal of the Operational Research Society60(12):1786–93. doi:https://doi.org/10.1057/JORS.2008.135.
- Doran, J. E., and D. Michie. 1966. Experiments with the graph traverser program. Proceedings of the Royal Society of London. Series A, Mathematical and Physical Sciences 294:1437. doi:https://doi.org/10.1098/rspa.1966.0205.
- Hart, P. E., N. J. Nilsson, and B. Raphael. 1968. A formal basis for the heuristic determination of minimum cost paths. IEEE Transactions on Systems Science and Cybernetics 4 (2):100–07. doi:https://doi.org/10.1109/TSSC.1968.300136.
- Lopes, T., D. Goble, B. Olivier, S. Kerr, et al. 2021. Novel twenty20 batting simulations: A strategy for research and improved practice [version 1; peer review: 2 approved with reservations]. F1000Research 10:411. doi:https://doi.org/10.12688/F1000RESEARCH.52783.1.
- Modekurti, D. P. V. 2020. Setting final target score in T-20 cricket match by the team batting first. Journal of Sports Analytics 6 (3):205–13. doi:https://doi.org/10.3233/JSA-200397.
- Norton, H., S. Gray, and R. Faff. 2015. Yes, one-day international cricket “in-play” trading strategies can be profitable! Journal of Banking and Finance 61:S164–S176. doi:https://doi.org/10.1016/J.JBANKFIN.2015.08.031.
- Norton, P., and R. Phatarfod. 2008. Optimal strategies in one-day cricket. Asia-Pacific Journal of Operational Research 25 (4):495–511. doi:https://doi.org/10.1142/S0217595908001833.
- Preston, I., and J. Thomas. 2000. Batting strategy in limited overs cricket. Journal of the Royal Statistical Society Series D: The Statistician 49 (1):95–106. doi:https://doi.org/10.1111/1467-9884.00223.
- Raizada, S., et al. 2019. Predicting the outcome of ICC cricket world cup matches. International Journal of Physiology, Nutrition and Physical Education 4 (1):119–122.
- Russel, S., and P. Norvig. 2010. Artificial intelligence. 3rd ed. London: Pearson, p. 95
- Sabri, A. N., N. H. M. Radzi, and A. A. Samah. 2018. A study on Bee algorithm and A* algorithm for pathfinding in games. ISCAIE 2018-2018 IEEE Symposium on Computer Applications and Industrial Electronics, Penang, Malaysia, 224–29. doi:https://doi.org/10.1109/ISCAIE.2018.8405474.
- Samad, M. D., and S. Sen. 2021. A probabilistic approach to identifying run scoring advantage in the order of playing cricket. International Journal of Sports Science & Coaching 16 (4):1011–20. doi:https://doi.org/10.1177/17479541211000333.
- Stern, S. E. 2016. The Duckworth-Lewis-Stern method: Extending the Duckworth-Lewis methodology to deal with modern scoring rates. Journal of the Operational Research Society 67 (12):1469–80. doi:https://doi.org/10.1057/JORS.2016.30.
- Swartz, T. B., P. S. Gill, and S. Muthukumarana. 2009. Modelling and simulation for one-day cricket. Canadian Journal of Statistics 37 (2):143–60. doi:https://doi.org/10.1002/CJS.10017.
- The pitch Law. 2017. Accessed October 20, 2021. https://www.lords.org/mcc/the-laws-of-cricket/the-pitch.
- Thenmozhi, D. et al. 2019. ‘MoneyBall - Data mining on cricket dataset. ICCIDS 2019-2nd International Conference on Computational Intelligence in Data Science, Proceedings. Institute of Electrical and Electronics Engineers Inc., Chennai, India. doi:https://doi.org/10.1109/ICCIDS.2019.8862065.