
 ?Mathematical formulae have been encoded as MathML and are displayed in this HTML version using MathJax in order to improve their display. Uncheck the box to turn MathJax off. This feature requires Javascript. Click on a formula to zoom.
ABSTRACT
It is essential to develop infrared (IR) thermogram identification technologies to establish automatic diagnosis systems in power substations. The convolutional neural network (CNN) based methods show the highest accuracy in this field. The IR thermograms of electrical equipment are very different from general digital images, which means the present methods need further improvements. For data-driven CNN methods, it is necessary to study the characteristics of the IR data. This paper collected 11817 thermograms from substations and structured the dataset according to equipment types. The statistical features of mean, variance, skewness, kurtosis and contrast are analyzed and compared with other five image datasets. Several tricks are revealed from the analysis and tested on CNN models. Firstly, greycaling the Iron pseudo-color images extracts the temperature information and makes it possible to design models with fewer channels. The test shows it could reduce over 35% computational costs. Secondly, the sparse information of color and edges of thermograms makes it necessary to keep the original aspect ratio. The image preprocessing method of cropping shows better performance than padding and rescaling. Thirdly, the 0–1 normalization can boost the training process for about 100 epochs, which is related to the particular background of thermograms.
Introduction
The infrared (IR) thermogram shows the surface temperature of electrical equipment clearly, and it can be used to analyze various abnormal conditions. Thermographic inspection has many technical advantages (Alfredo Osornio-Rios, Antonino-Daviu, and de Jesus Romero-Troncoso Citation2019) such as follows. 1) Non-contact, fast, reliable and accurate detection. 2) The image data can be stored easily for further processing and analysis. 3) There is no effect on the working equipment. 4) The severity of the defect can be quantified. It is a widely used electrical equipment detection method in substations at present. Most equipment in substation must be regularly inspected and analyzed following the standards (Administration of National Energy, Citation2016). The process of image collection, data sorting and defect analysis are all done by engineers, and it is low efficient. Therefore, it is necessary to develop automated technologies. In recent years, On-rail robot (Silva et al. Citation2018) has been increasingly used in substations. It can automatically capture IR images of equipment. Some IR cameras are fixed to monitor key equipment and establish the substation Industrial Internet of Things (Usamentiaga et al. Citation2018). These devices already have some automatic diagnosis capabilities, but their limited abilities of shootinhowairg and diagnosis still cannot replace manual inspection by experts.
Earlier works in this field usually segment the device area or heating area by setting thresholds and then extract features for analyzing. For example, Huda and Taib (Citation2013) used Kapur thresholding to segment the background and selected the best features and used multilayer perceptron (MLP) to determine whether there are defects. Zou and Huang (Citation2015) used K-means clustering to divide multiple temperature ranges and used support vector machine (SVM) to determine defects based on regional features. However, these methods only work well on specific equipment, cannot be applied to all types of substation equipment directly. One idea is to identify the equipment accurately before further analysis and diagnosis.
Deep learning methods show apparent advantages in the field of image recognition, object detection and so on, especially convolutional neural networks (CNN) based methods. Deep learning is a mathematical model based on artificial neural networks (ANN), using a large number of units and organized them into multiple layers. For CNN, the units only calculate data in small windows of the input matrices. These units follow the same basic calculation method as ANN, that is, weighted summation and nonlinear transformation.
Many studies have applied them to substation equipment identification in IR images. Ullah et al. (Citation2020) used CNN to extract features of IR images and studied the applicability of different classifiers. Zhao et al. (Citation2017) input the CNN features into a Vector of Locally Aggregated Descriptors (VLAD) aggregator to locate the insulator. Liu et al. (Citation2020) implemented an insulator positioning model based on YOLOV3 and compared it with Faster RCNN, where YOLO and Faster RCNN are both object detection methods based on CNN. Gong et al. (Citation2018) constructed a CNN-based target detection model that can identify the shooting orientation and some parts of equipment. Jiang et al. (Citation2020) proposed a method based on Mask R-CNN to detect the transformer bushings and analyzed the defects through multi-threshold segmentation. In our previous work (Han et al. Citation2020), we trained an equipment recognition model based on MobileNet and designed a fast ROI selection algorithm. The method can distinguish five types of equipment with complex backgrounds accurately.
These CNN-based studies have shown good test results. However, there are two key requirements to realize the industrial application of them: enough data and powerful AI inference ability. On the one hand, the IR images of normal equipment are readily available, but maybe not for faulty equipment. For example, faulty equipment only accounts for 2% of our dataset. The limit of data volume is considerable. On the other hand, real-time analysis is of great significance for substations, but it is also a significant challenge to the edge devices. Hence, it is necessary to search CNN methods dedicated to IR images and electrical equipment.
It is instructive to analyze the statistical features of the data, as deep learning belongs to the statistical learning methods. Several operations are proposed from this point of view in this paper, and the remaining parts are arranged as follows: In Section 2, the digital IR images are analyzed, and it reveals only Iron pseudo-color is suitable for greyscaling. In Section 3, an IR dataset of 20 types of substation equipment is built, and the statistical characteristics are analyzed and compared with the visible light (VL) images of equipment and other IR datasets. In section 4, some ideas about CNN model design and training are proposed based on the analysis, which is helpful to improve the accuracy and efficiency; In section 5, the methods are compared through equipment classification tests.
Analysis of infrared digital thermograms
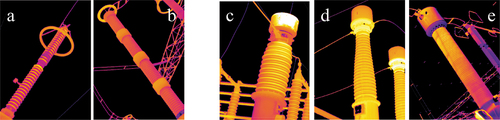
The images of diagnostic measurement are collected using hand-hold IR thermal imagers. The pseudo-color is generally used to enhance the temperature expressiveness for human vision. The pseudo-color algorithms can transfer the temperature matrix into a colored image. Specifically, these algorithms use three nonlinear smoothing functions about temperature to generate the red, green and blue (RGB) matrixes. shows several typical pseudo-color palettes in thermograms.
Figure 1. The IR images with different pseudo-color palettes: (a) Iron, (b) Arctic, (c) Rainbow, (d) High Contract.
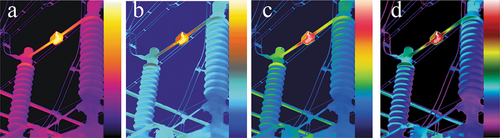
At present, there are no regulations about pseudo-color palettes in the field of IR diagnosis. However, Iron palette is used as the default in most cases. In the Iron palette, White and black represent the hottest and coldest point which is the most contrasting color pairs. Yellow and violet represent hotter and colder areas, respectively, and they are opposite in the color wheel.
Digital IR images are generally encoded as 24-bit RGB. It means the elements of RGB matrices are integers from 0 to 255. The end-to-end CNN methods take these matrices as the input of the model. For the computer, RGB matrices are redundant and multiply the calculational cost, compared with the original temperature matrix. However, reducing computational cost is one of the biggest challenges in applying deep CNN methods. The temperature matrix is the ideal data to replace RGB, but it is difficult to obtain due to camera limitations.
shows the relationship between temperature and the pixel intensity of different palettes. The Tmin and Tmax are the temperature limits of the palettes set by users, and the axis of temperature is linear. (a-c) shows the Iron palettes of different imagers, and they are what we focus on below. The intensity-temperature curves of them could be different but demonstrate similar trends and characters. The blue component to temperature conversion is a multi-valued function. All of the red, green and blue components have saturation regions, causing detail losses in the corresponding range. Therefore, none of them can replace the temperature matrix. Besides, greyscaling is widely used to process IR images, so we also analyze gray value as the black curves show. The greyscaling formula we used is:
Figure 2. The relationship between temperature and pixel intensity: (a) Iron of Flir, (b) Iron of Yossen, (c) Iron of Fluke, (d) Rainbow, (e) Arctic, (f) High Contract.

Where, G is the gray scale matrix of the image, Ir,Ig and Ib are RGB matrices, x
is the integer-valued function.
As the black curves show, the gray intensity is basically linear with the temperature, and there are no saturation parts in Iron palettes. shows images of different color channels. Red and blue are unacceptable obviously. Green seems good because human pay more attention to highlight areas and can rebuild the shadow area in mind (Ramachandran Citation1988). Nevertheless, the loss of edge information in the green channel would make it difficult to identify for a computer.
Figure 3. Comparison of different color channels in an Iron thermogram.
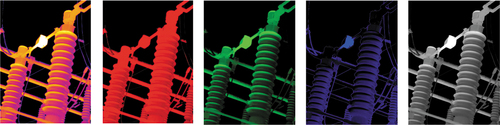
In contrast, the other palettes do not meet the same conclusions. As -f) shows, all the channels are multi-valued curves, including grayscale.
Hence, it is reasonable to use the grayscale matrix of the IR image to complete equipment identification tasks, which conforms to the Occam’s razor principle. For deep learning methods and edge computing, it helps improve efficiency and reduce hardware requirements. The default objects of image processing and analysis below are grayscale images.
Statistical characteristics of substation equipment infrared images
This paper analyzes the statistical features of substation thermograms based on a large sample and compared with other datasets. Five statistical features including mean, variance, skewness, kurtosis and contrast are calculated considering the following items:
Many previous studies believe that IR images have noise and low contrast. They could be fatal to the CNN method because of specific noise can deceive CNN (Wang et al. Citation2018). In recent years, thermal imaging cameras have been greatly improved (López-Pérez Citation2017), and the situation may have changed.
For the diagnosis of substation equipment, the shooting angle, background, and temperature range of the image are relatively fixed. Hence, these thermograms should have some unique features.
Machine learning is based on statistical learning theory. The statistical features of the target can guide method optimization. For example, contrast can affect face recognition and natural image recognition (Sanchez Citation2016).
Datasets for the analysis and test
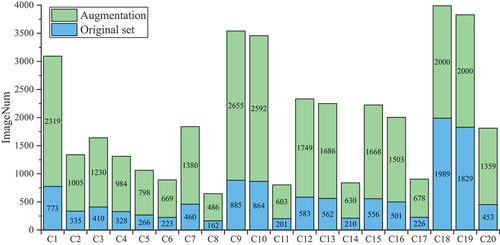
The IR dataset of substation equipment of this paper contains 11817 images. The images in 50 substations were measured in the past five years, using FLIR T6xx series, which are commonly used cameras for diagnostic measurement in substations. The dataset contains 20 types of substation equipment, and shows the composition. The original set means the original 11817 images, and the augmentation means the generated data. The statistical characteristics are obtained from the original dataset. All the redundant information is deleted from the images, including texts, color bar and marks. The augmentation is used for the training of the CNN models, and it flips, zooms in or crops images randomly.
Figure 4. Composition of the IR image dataset: C1 – GIS, C2 – inductor, C3~ C4 – arrester (110kV, 220kV), C5 – capacitor bank, C6 – transformer, C7 – insulator string, C8 – oil conservator, C9~ C11 – current transformer (110kV, 220kV, 500kV), C12~ C14 – potential transformer (110kV, 220kV, 500kV), C15~ C17-breaker (110kV, 220kV, 500kV), C18~ C20 – disconnect switches (110kV, 220kV, 500kV).
There are five other datasets for comparison, and their sizes and introduction are shown in . The VL images of electrical equipment are one-to-one correspond to the IR images because they are saved by the IR camera synchronously. Many images are collected at night, and they are meaningless, so we select 300 VL images with good light from each type. The common scenarios are collected using the same IR cameras. The datasets of powerline ([dataset] Yetgin Citation2017), traffic (Bahnsen and Moeslund Citation2019) and human body (Palmero et al. Citation2016) are open access.
Table 1. Datasets for analysis and comparison
Normalized histogram
The normalized histogram shows the estimation of the probability of occurrence of the gray level. As shown in , the gray values are divided into 32 levels evenly in the histograms. Considering the unbalance of the samples of different types, the normalized histogram is calculated as follow:
Figure 5. Grey level histograms of different kinds of images: (a)-(f): datasets D1~ D6.
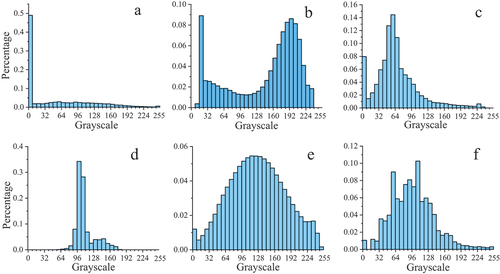
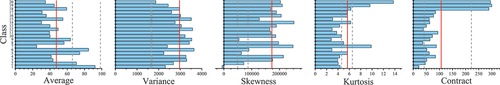
Figure 6. Statistical Features of different equipment.
Step 1: Calculate the histogram of image G as follow:
is the gray level and l = 0, 1, 2 … 31;g (i, j) is the grayscale intensity of pixel (i, j);pG is the value of the histogram of image G, Nl is the number of pixels with gray level l, m is the length of the image, n is the width. The pG(l) is an estimate of the probability of occurrence of gray level l.
Step 2: Calculate the mean histogram in type t:
Where Nt is the number of images of equipment type t and t = 1, 2 …, 20.
Step 3: Average all mean histograms as the global feature of substation equipment:
Step 4: Calculate the mean histograms of all samples directly for the non-device datasets.
The globally normalized histograms of different datasets are shown in . Obviously, there are some unique features of IR images of substation equipment. Almost half of the pixels have a gray intensity within 0 ~ 7, and other pixels are evenly distributed in the intervals. It is because the engineers used to filter out the low-temperature background area by adjusting the temperature limits during shooting. It means the backgrounds are almost black. The motivation is to facilitate the observation of the equipment and make a slight temperature difference could also be displayed in the image.
Statistical features
The statistical features of mean, variance, skewness, kurtosis and contrast are calculated to analyze the characteristics. These features could have different calculation methods for different targets. The algorithms used here are as follows:
Mean intensity μ reflects the overall lightness of the grayscale images. The larger mean reveals higher global brightness. It also represents the proportion of equipment in the view here, considering the black backgrounds.
Variance σ2 represents the uniformity of the temperature distribution in the whole image. Skewness S reflects the mainly concentrated temperature range in the thermogram. A positive value means that the target above the median temperature occupies the main area. Kurtosis K represents whether there is a large area where the temperature is approximately equal. The contrast C we used is based on the gray-level co-occurrence matrix (GLCM) (Hall-Beyer Citation2017). The GLCM represents the correlation between local pixels, and C reflects the amount of local textures and sensitive to noises.
shows the statistical features of the datasets. Considering that different equipment could have different features, the features of each type of equipment are also compared, as shown in . The red lines represent their average value, and dotted lines are the two closest values of contrasting datasets in , respectively. It can be seen that most types have similar feature values. Except for some types such as GIS, conductor and transformer occupy larger areas in the images, their mean and skewness are more extensive and less respectively. Also, the disconnect switches show higher contrast and the kurtosis corresponds to their voltage classes.
Table 2. Statistical Features of different datasets
We can draw the following conclusions based on the analysis: 1) It has the smallest average value because nearly half of the area is the black background; 2) The IR and VL images of equipment have large variances. Because the equipment area and surrounding sky background have a significant difference; 3) Most of the equipment has a large skewness. It could be counterintuitive that the skewness is positive according to the histogram. It is because the mean is so small that most equipment areas are much hotter than it. The GIS has a negative skewness because it is always larege and takes up most of the image; 4) It has large contrast, which means that the texture is clear and the slight difference in observable, and it is advantageous for general identification. We did not find a suitable indicator to evaluate noises. Consequently, we randomly selected 200 images to observe the details, and there is almost no noticeable noise.
Applicability analysis of CNN-based methods
For infrared diagnosis, we mainly focus on solving image recognition problems, including pattern recognition, object detection and semantic segmentation. A critical step to solve these problems is to select or design a suitable backbone CNN to extract feature maps layer by layer. However, there is no complete CNN design theory yet. Researchers need to make repeated adjustments and tests according to similar research ideas to find the best models. Experiments are carried out for applicability analysis. In this section, we put forward some tricks from three perspectives, based on the characteristic analysis to improve the accuracy.
Avoid rescaling
The bottom convolutional layers can extract detailed information of images, such as colors, edges and textures. As mentioned earlier, the IR image is equivalent to its grayscale matrix. The gray values change with temperature limits settings, so IR images do not have reliable color information. The textures are not suitable to distinguish the type of substation equipment. Therefore, edge information needs to be utilized as much as possible.
Intuitively, the original aspect ratio is important. Different electrical equipment has many similar structures, such as insulators, grading rings and link fittings. For humans, the difference in their appearance is the different proportions of each part. For example, the left image in ) shows a 220kV arrester, and the right shows a 500kV potential transformer. It is also necessary to distinguish the voltage level of the equipment for defect inspection. ) shows the current transformers of 110kV, 220kV and 500kV. The main difference is that the equipment with higher voltage is slenderer because it has longer insulation distance. Therefore, the scale conversion with random angles will bring challenges to equipment identification. Hence, keeping the original aspect ratio should be helpful to improve the CNN performance.
Figure 7. Samples of similar equipment: (a) arrester, (b) PT, (c-e) CT of 110kV, 220 kV and 500kV.
The length and width of the input image are always specified for a CNN model. The input size is generally set to be equal in length and width, such as 224 × 224 in this paper. Nevertheless, the aspect ratio of IR images used to be 4:3 or 5:4. It means the original image needs to be rescaled or cropped to fit the input size. Rescaling is widely used because it is compatible and performances well in most cases. Rescaling changes the original aspect ratio, so it is contrary to the analysis. Cropping images into the specific ratio is also used, especially in ROI-based methods. It discards parts of the image and loses the information. Another feasible method is padding, which means to extends the images to change the aspect ratio. The expanded areas can be filled with 0, which is similar to the background. Padding is rarely used to preprocessing because it is not suitable for other images.
Data formatting
The analysis shows that gray intensities of the background area are 0 or very small. In CNN, intensities are multiplied with the elements of convolution filters. In this case, the model is insensitive to the background area, which may be beneficial. However, the state of the art methods used to transform pixel intensity into a floating-point (−1 ~ 1 or 0 ~ 1) linearly before training, considering that the neural units are more sensitive to the input near 0. In some cases, further centralization and normalization would be performed, and it often depends on experience. However, keeping the background at 0 makes a strong prior knowledge for our problem. Because the product of these pixels and weight is always 0. It makes the background pixels perform the same response pattern independent of the filters’ weight. Dividing the original data by 255 without any other processing is one way to keep this feature.
Structure of CNN model
The CNN model needs to tradeoff accuracy and efficiency according to specific application requirements. A suitable model needs to be adjusted and tested repeatedly, which is a time-consuming task. The primary basis for model design is the experience and tricks of existing research.
In principle, the existing methods and models can also be applied to IR images. The point worth thinking about is that the input is a grayscale image. The input image can also be regarded as a layer of CNN, the input layer. And the width of it becomes one-third of the color image. The width represents the number of feature maps at the current depth. It indicates that the next layer can also use a smaller width because fewer feature maps are available. Research shows that a good CNN structure has high accuracy for both color images and grayscale images without any change. However, the computational cost is proportional to the square of width, which is adverse to industrial applications.
In order to reduce the time consumption of training during model iteration, we can train a lightweight model with 1/3 widths of the reference. Then, increase the width and train the model step by step, until the accuracy meets the requirement or stops improving.
Tests and analysis
The CNN model for the tests
MobileNetV1 is used as the basic CNN for the tests, and here are some reasons. The MobileNet is proposed by Google, which is suitable for mobile devices, and it is popular in industrial applications. The MobileNetV1 contains all the necessary operations without special modules (Howard and Menglong et al., Citation2017), and it makes the test results more universal. In addition, MobileNet is friendly to the width multiplier. The width multiplier α∈ (0,1] is a parameter to thin a network uniformly at each layer.
The structure of the test model is shown in . The input images are rescale or cropped into 224 × 224. The graying process is alternative. The test uses different width factors for comparison, and the width of layer n is denoted as wn. It should be noted that the Conv1 is the standard convolution and other convolution layers are depthwise separable convolution layers. shows the models we used for comparison. The numbers of the parameters and mult-add operations are provided, they imply that the computational cost is reducing by roughly α2.
Table 3. Parameters of the models with different width
Figure 8. The structure of the test model.
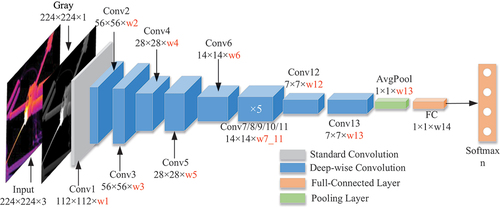
The first convolutional layer (Conv1) is significant and research found that at least the width of 24 are required (Lu et al. Citation2017). As shown in , the width of the Conv1 layer is small when α is less than 0.5. Here we added some width of Conv1 and denote as the modified model as MobileNet*.
The test method is training an equipment classification model using the training set and evaluates the model on the validation set. The 20% images from each type are selected randomly as the validation set, and the others as the training set. The deep learning framework is TensorFlow 2.2, and the GPU for training is NVIDIA RTX 2080Ti 11 G. The optimizer is SGD, the initial learning rate is 0.01 in the first 100 epochs, and set the 0.00001 decay in the last 100 epochs, the batch size is 32.
Tests and results
Preprocessing
The alternative image preprocessing methods include greyscaling, rescaling, cropping and padding. The paper randomly initializes and train the 1.0MobileNet for comparison. shows an example of different preprocessing, and the red box shows the original size. This paper crops the central part in the test instead of ROI selection methods to prevent any other prior. The padding takes the original image as the center as well. shows the results of the comparison, and All the methods have high training and validation accuracy after adequate training. It demonstrates the deep CNN methods can identify most equipment in IR images accurately. All the results of the training set are close to 100%. So, we evaluate different methods by validation accuracy, and it reflects the generalization ability of models.
Figure 9. Different alternative image pre-processing methods: (a) color and cropping, (b) grayscale and cropping, (c) rescaling, (d)padding.
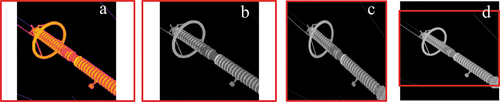
Figure 10. Comparisons of different image pre-processing.
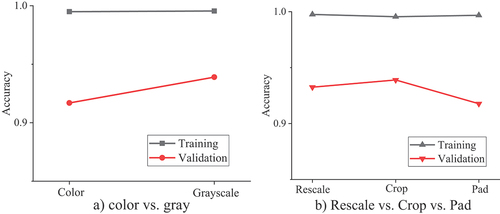
) shows that the accuracy of gray images is 2.21% higher than color images, although they are equivalent theoretically. The reason could be (1) is unknown to the model, which makes the training more difficult. In other words, the greyscaling adds a priori knowledge about temperature calculation to the deep learning model, which is beneficial to the training.
) shows the results of the aspect ratio tests. The cropping shows the highest accuracy and padding shows the lowest. We analyzed the error samples and found that the padding method tends to misclassify images with complex backgrounds. The boundary between the background and padding may mislead the model. These images accounted for approximately 30% of the error samples. It shows that cropping is the best method even lost some areas and indicates that keeping the original ratio is beneficial.
The preprocessing method of graying and central cropping adapt to the issue that this paper focuses on best. The ROI-based cropping methods may further improve the accuracy. Besides, the model works well on the validation set. It also indicates the images have little noise and cannot affect recognition.
Data formatting
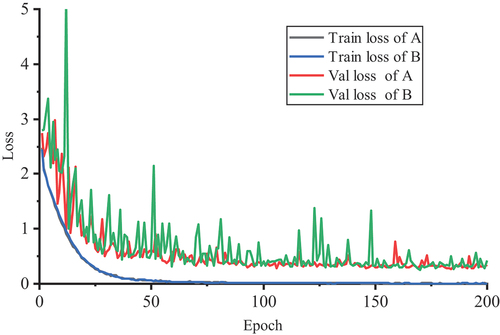
The paper test two widely used data formats: normalizing the intensity into 0 ~ 1 (group A) and −1 ~ 1 (group B). shows the training process of the tests. The loss function of the test is categorical cross entropy (CCE):
Figure 11. Training process of different data format.
Where NC = 20 is the number of equipment types, yc and ŷc represent the true label and inference result about type c, respectively.
On the training set, the loss reduction process of the two groups is basically the same. On the validation set, the loss curve of group B is unstable in the first 150 epochs. The group A get a stable result before 100 epochs. Moreover, their final losses are close. We repeated this test several times and got the same conclusion. The result proves that normalizing the original data to the interval of 0 ~ 1 is much more helpful for training.
Width of models
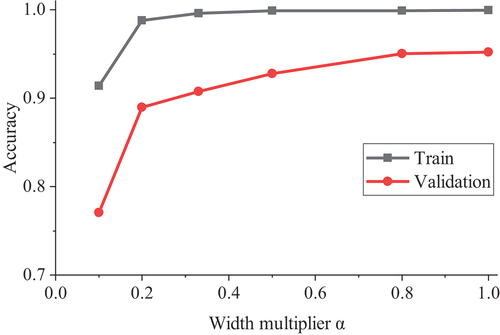
The width reduction method is tested, and shows that the accuracy of different width multiplier α. The results show the training accuracy is high if α > 0.5, and the validation accuracy decreases with α if α < 0.8. It indicates the best α is between 0.8 and 1, which reduce the parameters without sacrificing accuracy.
Figure 12. Results of width reduction test.
The highest accuracy is not always necessary in applications, considering the computational cost and algorithm latency. Almost all calculations are multiplication and addition in CNN models, and the sum of mult-add operations are used to evaluate the computational cost. shows the tradeoff between efficiency and accuracy of the tests. Where the IR images are the test results using MobileNetV1, and IR images* are using modified MobileNet*. They are corresponding to the . The result on ImageNet is provided by Google as a reference. Moreover, it is the test accuracy of classifying 1000 targets in VL images, using the MobileNet with different α.
Figure 13. Trade-off between computation and accuracy.
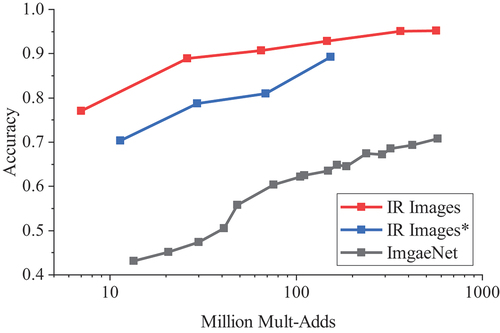
As shows, the mult-add reduces by about 90% if α = 0.33, but the accuracy on the validation set only reduced by 4.5%. The width increase of Conv1 is not helpful. It reveals the IR images does not need so many feature maps as VL images. The comparison with ImageNet indicates that the task of identify 20 types of equipment is much easier for CNN-based models. Their tradeoff curves are similar, but the accuracy of grayscale images decreases more slowly with fewer parameters.
Conclusion
The IR image recognition technology of substation equipment is essential to developing automatic diagnosis systems, and CNN-based methods perform well in this field. This paper analyzed over 11k images and proposed some tricks to improve the CNN methods from three perspectives. For image preprocessing, Greyscaling the pseudo-color IR images and cropping images without aspect ratio changes are helpful to improve the accuracy. The greyscaling only makes sense with Iron palettes. Padding the bounds could also be used to keep the aspect ratio, but it is not robust to the intricate backgrounds. For the data formatting, normalize the pixel intensities into 0 ~ 1 shows better performance than −1 ~ 1, because it weakens the influence of background areas. For the model optimizing, the CNN models with fewer widths could be used for grayscale IR images. It would not lead to accuracy decrease within a specific range, which is significant for industrial applications. The work of this paper can contribute to design better CNN models dedicated to IR images to improve the identification performance further.
Acknowledgments
The work was supported by the STATE GRID of China corporation headquarter’s science and technology project (Study on Infrared Image Intelligent Diagnosis of Substation Equipment, grant number 5200-201915256A). The authors would like to thank Ömer Emre Yetgin, Bahnsen Chris H. and Palmero Cristina et al. who provided IR image datasets to support our research.
Disclosure statement
No potential conflict of interest was reported by the author(s).
Additional information
Funding
References
- [dataset] Yetgin, Ö. 2017. Powerline image dataset (Infrared-IR and Visible Light-VL). Mendeley Data v7. doi:10.17632/n6wrv4ry6v.7.
- Administration of National Energy, China, 2016. Application rules of infrared diagnosis for live electrical equipment.
- Alfredo Osornio-Rios, R., J. A. Antonino-Daviu, and R. de Jesus Romero-troncoso. 2019. Recent industrial applications of infrared thermography: A review. IEEE Trans Ind Inform 15:350–368. doi:10.1109/TII.2018.2884738.
- Bahnsen, C. H., and T. B. Moeslund. 2019. Rain removal in traffic surveillance: Does it matter? IEEE Trans Intell Transp 20 (2802–2819). doi: 10.1109/TITS.2018.2872502.
- Gong, X., Q. Yao, M. Wang, and Y. Lin. 2018. A deep learning approach for oriented electrical equipment detection in thermal images. IEEE Access 6:41590–97. doi:10.1109/ACCESS.2018.2859048.
- Hall-Beyer, M., 2017. GLCM texture: a tutorial v. 3.0. http://www.ucalgary.ca/UofC/nasdev/mhallbey/research.htm
- Han, S., F. Yang, G. Yang, B. Gao, N. Zhang, and D. Wang. 2020. Electrical equipment identification in infrared images based on ROI-selected CNN method. Electr Pow Syst Res 188:106534. doi:10.1016/j.epsr.2020.106534.
- Howard, A. G., and Menglong, Z. et al, MobileNets: Efficient convolutional neural networks for mobile vision applications. https://arxiv.org/abs/1704.04861
- Huda, A. S. N., and S. Taib. 2013. Suitable features selection for monitoring thermal condition of electrical equipment using infrared thermography. Infrared Phys Techn 61:184–91. doi:10.1016/j.infrared.2013.04.012.
- Jiang, J., Y. Bie, J. Li, X. Yang, G. Ma, Y. Lu, and C. Zhang. 2020. Fault diagnosis of the bushing infrared images based on mask R-CNN and improved PCNN joint algorithm. High Voltage. doi:10.1049/hve.2019.0249.
- Liu, Y., X. Ji, S. Pei, Z. Ma, G. Zhang, Y. Lin, and Y. Chen. 2020. Research on automatic location and recognition of insulators in substation based on YOLOv3. High Voltage 5 (1):62–68. doi:10.1049/hve.2019.0091.
- López-Pérez, J. A. A. D., 2017. Failure detection in industrial electric motors through the use of infrared-based isothermal representation., Proc. 43rd Annu. Conf. IEEE Ind. Electron. Soc., Beijing, China, pp. 3822–27.
- Lu, Z., H. Pu, F. Wang, Z. Hu, and L. Wang, 2017. The Expressive Power of Neural Networks: A View from the Width.
- Palmero, C., A. Clapés, C. Bahnsen, A. Møgelmose, T. B. Moeslund, and S. Escalera. 2016. Multi-modal RGB–Depth–Thermal human body segmentation. Int J Comput Vision 118 (2):217–39. doi:10.1007/s11263-016-0901-x.
- Ramachandran, V. S. 1988. Perception of shape from shading. Nature (6152):163. doi:10.1038/331163a0.
- Sanchez, A. M. A. B. 2016. Analyzing the influence of contrast in large-scale recognition of natural images. Integr Comput-Aid E 3 (3):221–35. doi:10.3233/ICA-160516.
- Silva, B. P. A., R. A. M. Ferreira, S. C. Gomes, F. A. R. Calado, R. M. Andrade, and M. P. Porto. 2018. On-rail solution for autonomous inspections in electrical substations. Infrared Phys Techn 90:53–58. doi:10.1016/j.infrared.2018.01.019.
- Ullah, I., R. U. Khan, F. Yang, and L. Wuttisittikulkij. 2020. Deep learning image-based defect detection in high voltage electrical equipment. Energies (Basel) 13 (2):392. doi:10.3390/en13020392.
- Usamentiaga, R., M. A. Fernandez, A. F. Villan, and J. L. Carus. 2018. Temperature monitoring for electrical substations using infrared thermography: Architecture for industrial internet of things. IEEE Trans Ind Inform 14 (12):5667–77. doi:10.1109/TII.2018.2868452.
- Wang, F., L. Chen, C. Li, S. Huang, Y. Chen, C. Qian, and C. C. Loy, 2018. The Devil of Face Recognition is in the Noise.
- Zhao, Z., X. Fan, G. Xu, L. Zhang, Y. Qi, and K. Zhang. 2017. Aggregating deep convolutional feature maps for insulator detection in infrared images. IEEE Access 5:21831–39. doi:10.1109/ACCESS.2017.2757030.
- Zou, H., and F. Huang. 2015. A novel intelligent fault diagnosis method for electrical equipment using infrared thermography. Infrared Phys Techn 73:29–35. doi:10.1016/j.infrared.2015.08.019.