
 ?Mathematical formulae have been encoded as MathML and are displayed in this HTML version using MathJax in order to improve their display. Uncheck the box to turn MathJax off. This feature requires Javascript. Click on a formula to zoom.
ABSTRACT
Studies reported that playing video games with harmful content can lead to adverse effects on players. Therefore, understanding the harmful content can help reduce these adverse effects. This study is the first to examine the potential of interpretable machine learning (ML) models for explaining the harmful content in video games that may potentially cause adverse effects on players based on game rating predictions. First, the study presents a performance analysis of the supervised ML models for game rating predictions. Secondly, using an interpretability analysis, this study explains the potentially harmful content. The results show that the ensemble Random Forest model robustly predicted game ratings. Then, the interpretable ML model successfully exposed and explained several harmful contents, including Blood, Fantasy Violence, Strong Language, and Blood and Gore. This revealed that the depiction of blood, the depiction of the mutilation of body parts, violent actions of human or non-human characters, and the frequent use of profanity might potentially be associated with adverse effects on players. The findings suggest the strength of interpretable ML models in explaining harmful content. The knowledge gained can be used to develop effective regulations for controlling identified video game content and potential adverse effects.
Introduction
Since their introduction around 40 years ago, video games have become one of the most popular leisure technologies globally. With their various platforms, video games have reached many different levels of players. According to market analysis, the widespread popularity of video games produced 159.3 billion dollars in 2020 (Field Level Media Citation2020). According to a survey in 2020, 75% of Americans had at least one video game player in their household. In total, 214.4 million people played video games, of whom 51.1 million were kids (under 18) and 163.3 million adults (above 18). Further, the average age of players ranged from 35 to 44. Regarding the devices owned by players, 73% played on a game console, 43% on a handheld system, 29% on a virtual reality (VR) device, and 25% on a mobile VR device. Most players said that video games offered mental stimulation (80% of respondents) and relaxation (79% of respondents) for the human body (ESA Citation2020).
Nowadays, the increasing popularity of video games has attracted numerous researchers. Most researchers focus on the player–video game interactions (Caroux et al. Citation2015) and user experience (Bernhaupt and Mueller Citation2016; Boyle et al. Citation2012). Another community of researchers focuses on game development and design (Duarte, Silveira, and Battaiola Citation2017; Engström et al. Citation2018). Despite the popularity of video games, considerable discussion remains about their potential positive and negative effects on individuals and society. Several studies have shown positive outcomes of video games, especially educational games. These studies reported that playing video games was connected with a range of positive outcomes with respect to perceptual, cognitive, behavioral, affective, and motivational factors (Boyle et al. Citation2016). Other positive effects of video games have also been reported, such as enhancing the academic achievement of students (Karakoç et al. Citation2020), critical thinking (Mao et al. Citation2021), and positive feelings (Quwaider, Alabed, and Duwairi Citation2019).
Adverse effects of gaming have also been reported. Lee et al. (Lee, Kim, and Choi Citation2021) found that playing violent games correlated with physical and verbal aggression. Further, in their experimental study on the effects of playing violent, sexist video games, Gabbiadini et al. (Gabbiadini et al. Citation2016) identified that playing such games reduced males’ empathy for female victims of violence. This reduction in empathy arose because the video games increased masculine beliefs, such as confidence in being a “real” man, dominant, and aggressive. Furthermore, violent games are associated with significant impacts on blood pressure and appetite perceptions, which can increase the risk of hypertension and weight gain (Siervo et al. Citation2013). Other adverse effects, such as game addiction (Gros et al. Citation2020), anger and hostility (Lee, Kim, and Choi Citation2021), gaming disorders (WHO Citation2018), and hallucinations (Griffiths Citation2005), have also been reported. In a specific group of gamers, Nguyen and Landau (T. Nguyen and Landau Citation2019) reported that excessive gaming was strongly associated with social isolation and depression in children. In another survey, lack of physical movement, eyesight disorders, and anxiety (Sălceanu Citation2014) were reported as adverse effects. As previously mentioned, most video game players are adolescents. Many experimental studies have shown that playing video games enhances adolescents’ aggressive behavior (J. Y. Li, Du, and Gao Citation2020). Adolescents who play for an excessively long time were also found to develop depressive, musculoskeletal, and psychosomatic symptoms (Hellström et al. Citation2015). In their experimental study on the effects of emotional arousal on swearing fluency, Stephens and Zile (Stephens and Zile Citation2017) found that the swearing fluency of adults was strongly associated with raised emotional arousal after playing a shooter game.
In order to avoid the negative effects of video games, various organizations have proposed a game rating system to control their harmful content and to advise consumers about the games they want to play. Parents use these guidelines to control what video games can be played by children and adolescents. Depending on differences in society, culture, and political aspects, several organizations have proposed game rating systems: the Pan European Game Information (PEGI) for Europe (PEGI Citation2021), the Entertainment Software Rating Board (ESRB) for North America (ESRB Citation2021), the Australian Classification Board (ACB) in Australia (ACB Citation2021), the Office of Film and Literature Classification (OFLC) in New Zealand (OFLC Citation2021), the Computer Entertainment Rating Organization (CERO) in Japan (CERO Citation2021), the Media Development Authority (MDA) in Singapore (MDA Citation2021), and the Game Rating Board (GRB) for South Korea (GRB Citation2021). Based on their classification methods, such rating systems can minimize children’s and teenagers’ access to possibly harmful content. The findings of various studies support this claim. A rating system helps parents protect their children from the adverse effects of video games (Felini Citation2015). Furthermore, Laczniak et al. (Laczniak et al. Citation2017) reported that the kids of parents who used the game rating system tended to play less violent games and were less likely to be engaged in negative actions at school.
Despite the promising results of game rating systems for minimizing the negative consequences of video games, the rating systems do not explain which types of harmful content may potentially these adverse effects. To the best of our knowledge, this issue has not been investigated elsewhere. Therefore, understanding the potentially harmful content in video games is essential, as it can provide early warning information with which to evaluate a game’s content. Also, the knowledge gained from this study is beneficial because it (a) allows policy-makers to evaluate the policy decisions about the harmful content in video games (Laczniak et al. Citation2017), (b) allows the game developers to create an optimal gaming profile for a specific group of users based on game rating systems (Hamid and Shiratuddin Citation2016), and (c) allows researchers to confirm existing knowledge regarding harmful content in video games (Langer et al. Citation2021).
Explainable artificial intelligence (XAI) is a relatively new technique that explains the underlying processes in ML models in a way that humans can understand (Barredo Arrieta et al. Citation2020). Various studies have started to take advantage of this technique. In experimental studies, Parsa et al. (Parsa et al. Citation2020) leveraged the XAI technique to explain the occurrence of traffic accidents using several types of real-time data, including traffic, network, demographic, land use, and weather features. Chakraborty et al. (Chakraborty, Başağaoğlu, and Winterle Citation2021) employed the XAI technique to explain the inflection points in the climate predictors of hydro-climatological data sets. The XAI technique has also been utilized in the medical field. For example, it has delineated the area of tumor tissue in patches extracted from histological images (Palatnik de, Rebuzzi Vellasco, and Da Silva Citation2019) and explained the occurrence of Parkinson’s disease in a public data set of 642 brain images of Parkinson’s patients (Magesh, Myloth, and Tom Citation2020). Although previous studies have demonstrated the promise of the XAI technique regarding interpretability analysis, no study has used it to examine video games. Current research studies attempt to obtain metrics with the highest prediction accuracy (Alomari et al. Citation2019) but lack a thorough analysis of the harmful content in video games. The fact that no game studies focus on explainability has also been raised in previous review studies (Barredo Arrieta et al. Citation2020; Tjoa and Guan Citation2020). Our study addresses these research omissions identified in previous experimental and review papers.
Research questions and hypotheses
This paper aims to examine the potential of an interpretable ML model for explaining the harmful content in video games that may potentially cause adverse effects on players based on a multi-class classification of game ratings. The hypotheses of this study are twofold.
First, this study comprised empirical experiments with the supervised ML models to predict the well-known public ESRB game rating system. Specifically, this study compared the ensemble and non-ensemble ML models to understand their performance in predicting ESRB game rating systems.
Secondly, based on the comparison results, this study utilized the best ML model to explain the potentially harmful content that may cause adverse effects on players using global and local interpretability analysis.
This study notes that the terms content and feature are semantically identical. The former is used to explain a video game’s content descriptors or harmful content, and the latter is usually applied to explain the technical term in the machine learning field. These two terms are used interchangeably throughout the paper.
The rest of this paper is organized as follows. Section 2 presents a short literature review on XAI. Section 3 provides the methodology of this study, while Section 4 presents the results and discussion of the experiments. Finally, Section 5 answers the research questions and summarizes the essential findings and implications of this work.
Explainable artificial intelligence
In the literature, the term explainability of artificial intelligence or explainable artificial intelligence is often misused or confused with other terms, such as interpretability (Tjoa and Guan Citation2020), explainability (Guidotti et al. Citation2018), comprehensibility (Fernandez et al. Citation2019), and transparency (Lipton Citation2018). Explainability refers to explaining the reason behind the prediction of a specific machine learning model that humans can understand, and such explanations can be used to formulate new assumptions or to validate existing knowledge (Belle and Papantonis Citation2021; Linardatos, Papastefanopoulos, and Kotsiantis Citation2021; Lipton Citation2018).
A published review study classified the explainability of artificial intelligence techniques based on scope, methodology, and model usage (Das and Rad Citation2020). In scope, explanations can be local or global, and some methods can be applied to both. Locally explainable methods represent the individual feature attributions of a single instance of input data from the all-data population and show a user why a specific choice was made. The study’s examples of local explanation are Activation Maximizations, Saliency Map Visualizations, Layer-Wise Relevance Backpropagations (LRP), Local Interpretable Model-Agnostic Explanations (LIME), and SHapley Additive exPlanations (SHAP). In contrast, globally explainable methods attempt to understand each feature that contributes to how the model makes its choice over all of the data. Examples of global explanation are Global Surrogate Models, Class Model Visualizations, LIME Algorithm for Global Explanations, Concept Activation Vectors (CAVs), Spectral Relevance Analyses (SpRAy), Global Attribution Mapping, and Neural Additive Models (NAMs).
Furthermore, the principal algorithmic concept behind the explainable model can be classified based on implementation methodology. Typically, both local and global explainable algorithms can be classified as either backpropagation-based or perturbation-based methods. In backpropagation-based methods, the explainable algorithm performs one or more forward passes through the neural network, then produces attributions using partial derivatives of the activations during the backpropagation stage. Examples of backpropagation-based include Saliency Maps, Gradient Class Activation Mapping (CAM), Salient Relevance (SR) Maps, Attribution Maps, and Desiderata of Gradient-Based Methods. On the other hand, perturbation-based methods aim to change the feature set of a given input instance by utilizing occlusion, partly switching features with filling operations or generative algorithms, masking, and conditional sampling. In most cases, a single forward pass is sufficient to build attribution representations, and back-propagating gradients are not required. Examples of perturbation-based methods are Deconvolution Nets for Convolution Visualizations, Prediction Difference Analysis, Randomized Input Sampling for Explanation (RISE), and Randomization and Feature Testing.
A well-built explainable method with a defined scope and approach can be integrated inside the neural network model or used as an external algorithm for explanation at the model usage or implementation level. Any explainable algorithm that is dependent on the model architecture falls into the model-intrinsic group. Model-intrinsic algorithms are specific models, which means explainability is built into the neural network architecture and cannot be transferred to other architectures. Model-intrinsic examples are Trees and Rule-Based Models, Generalized Additive Models (GAM), Sparse LDA, and Discriminant Analysis. Conversely, model-agnostic post-hoc explanations are not dependent on the model architecture and can be implemented with neural networks that have previously been trained. Post-hoc methods are frequently used in various input modalities, including photos, text, and tabular data.
Why SHapley Additive exPlanations (SHAP)?
SHAP is an explainable method based on game theory, and it provides a powerful and insightful measure of a feature’s relevance in a model (Parsa et al. Citation2020). The SHAP technique is a feature attribution method that allocates a value to each feature for each prediction, making it easier to evaluate the prediction result. The method ensures feature consistency and model stability, significantly improving the original Shapley Value estimation method (Meng et al. Citation2021). The global and local explainability of the interpretable ML model can be analyzed by using the SHAP frameworks. SHAP can reveal the global order of importance of the predictor variables in estimating the target (i.e., game rating categories) and highlight the local dependencies or interactions among the independent and dependent variables. SHAP can also quantify the independent variables’ inflection points that trigger the prediction (Chakraborty, Başağaoğlu, and Winterle Citation2021).
In the last year, SHAP has successfully been implemented in numerous areas, such as traffic accidents (Parsa et al. Citation2020), climatology (Chakraborty, Başağaoğlu, and Winterle Citation2021), medicine (Palatnik de, Rebuzzi Vellasco, and Da Silva Citation2019), human decision support systems (Knapič et al. Citation2021), and anomaly detection (Antwarg et al. Citation2021). Recently, Moscato et al. (Moscato, Picariello, and Giancarlo Citation2021) compared SHAP and LIME performances in explaining the predictions of ML models. They found that SHAP achieved statistically more reliable results. These findings are in line with previous studies that reported SHAP outperformed the LIME method in terms of robustness (Antwarg et al. Citation2021).
Furthermore, SHAP’s ability was also proved to boost the prognostic performance and confirm its value in AI-based reliability research. Nor et al. (Nor et al. Citation2021) utilized the SHAP technique to explain gas turbine prognostication. They revealed that the SHAP technique could improve prognostic performance, aspects that have not been considered in the literature of prognostic and health management-XAI. They found that the gas turbines’ prognostic findings improved by up to 9% in root mean square error and 43% in early prognosis due to SHAP. They improved the prognostic performance by using the best set of features according to contribution order from the SHAP summary plot. In short, the previous studies have proved the ability of the SHAP technique to explain the predictions of ML models. For this reason – and taking into account the research omissions identified by the previous studies described in the last section – this study proposes using the SHAP technique for explaining the harmful content in video games that may cause adverse effects on players based on game rating prediction.
Materials and methods
The ESRB data set was sourced from the Kaggle website for data science and machine learning (Kaggle Citation2021). The data set contained the title of the game, 30 content descriptors, and 4 game rating categories (i.e., everyone [E], everyone 10+ [E10+], teen [T], mature 17+ [M17+]). A detailed description of the game rating categories or game rating classes and game content descriptors are given in Appendixes A and B. PlayStation and Xbox were the most used video game platforms. The training data set comprised 1,895 games with 30 ESRB content descriptors, and the testing data set included 500 games with 30 ESRB content descriptors. The experiments were performed on a Windows 10 platform with a 16 GB graphics processing unit (GPU), 256 GB of SSD storage, a 1.80 GHz Intel Core i7 processor, and 8 GB of RAM. The Python environment (version 3.7.6), Scikit-learn. and the Keras library were used to develop algorithms. Finally, the SHAP framework was used for the global and local interpretability analysis.
Development of machine learning models and interpretable models
The development process of ML models and interpretable models is displayed in . The first step was data processing, in which all the features (independent variables) from the ESRB data set and the game rating classes (dependent variables) were combined. Then, the data were converted into binary values (1 or 0). shows a matrix of input features, where the columns represent the presence (1) or absence (0) of a particular feature in a specific game. The column of the game rating class represents the output and indicates whether a game is classified as E, E10+, T, or M17 + .
Table 1. Representation of the Binary Matrix
Figure 1. Graphical description of the development process of ML and interpretable models.
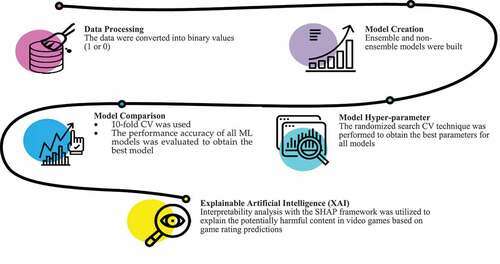
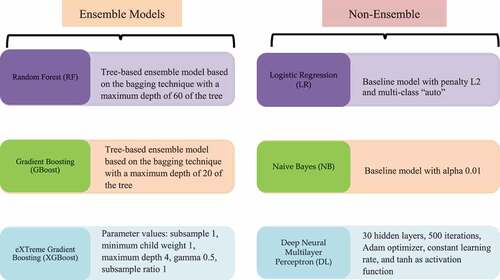
The complete data set was divided into a training and a testing data set, which were utilized to predict the performance of the ML models in estimating the game rating categories. The next step was model creation. In this step, several ML models were developed, including ensemble models (i.e., random forest [RF], gradient boosting [GBoost and XGBoost]) and non-ensemble models (i.e., logistic regression [LR], naive Bayes [NB], and deep neural multilayer perceptron classifier [DL]). To achieve the best performance of the algorithm, the hyper-parameter technique was performed using the randomized search cross-validation (CV) technique (Bergstra and Bengio Citation2012). Appendix C presents the randomized search CV technique results. Moreover, each model was executed 10 times using 10-fold CV to obtain the best model for the interpretability analysis step. Four metrics were used, including accuracy, precision, recall, and the F1 score. The accuracy is the percentage of correct instances classified by the model. The precision is the number of instances that fit the given class and the instances classified into that class, while the recall or sensitivity describes the true positive prediction rate. The F1 score or F1 measure describes the classification accuracy concerning the average precision and recall values. F1-score values closer to 1 indicate a better classification accuracy. The evaluation metrics are calculated in (1), (2), (3), and (4):
where TP is a true positive, FN is a false negative, and FP is a false positive. Finally, the global and local interpretability analyses were performed to explain the results.
Results
Performance analysis of predictive ML models
This section presents the comparative performance of ML ensemble (i.e., RF, GBoost, and XGBoost) and non-ensemble models (i.e., LR, NB, and DL). The model details and the configuration-based randomized search CV are depicted in . All models were evaluated using four metrics on the test data, as depicted in .
Table 2. Comparison of Predictive Accuracy of the ML Models
Figure 2. Details of the ML models.
The overall performance revealed that RF model outperformed the other models in predicting game rating categories. The RF showed the best performance compared with other models with 84.90% overall performance. Experimental findings revealed that the performance of ensemble learning (i.e., RF) is better than the other models. This finding is in line with the previous results that reported the supremacy of ensemble models (Y. Li and Chen Citation2020; Kiziloz Citation2021; K. A. Nguyen et al. Citation2021). Thus, our study used the RF model for the next section of global and local interpretability analysis using the SHAP framework.
In terms of accuracy metrics, shows that the XGBoost performed best, with a prediction accuracy of 84.60%, and both GBoost and RF achieved a comparable performance of 84.20%. In other studies, XGBoost exhibited higher prediction accuracy than RF in predicting PM2.5 concentrations in the air using satellite and meteorological data (Zamani Joharestani et al. Citation2019). However, Kabiraj et al. (Kabiraj et al. Citation2020) found that RF outperformed the XGBoost model in predicting breast cancer risk. Further, Lu et al. (Lu et al. Citation2021) reported that RF performed better than GBoost in predicting false invoicing feature identification and risk prediction. Contrary, Golden, Rothrock, and Mishra (Golden, Rothrock, and Mishra Citation2019) found the opposite results, reporting that the GBoost model outperformed the RF model in predicting the prevalence of Listeria spp. in pastured poultry farm environments.
Regarding precision, recall, or sensitivity and F1 score metrics, XGBoost outperformed the RF model for predicting mortality of patients with acute kidney injury in recall and F1 metrics. Also, Kardani et al. (Kardani et al. Citation2021) reported that XGBoost performed better than RF for predicting slope stability (i.e., the condition of inclined soil slopes to withstand movement) in all metrics. On the contrary, the RF model outperformed the XGBoost model in precision. Additionally, the GBoost model outperformed the RF model in predicting landslide susceptibility mapping in all metrics (Liang, Wang, and Jan Khan Citation2021).
Our results and the findings of previous studies demonstrated that the models, such as RF, GBoost, XGBoost, and DL, achieve a comparable performance. Although the findings showed the comparable performance of the models, the authors noted that the performance of algorithms is influenced by various factors, such as the model’s complexity and configuration and the quality of data.
Evaluation results of the global interpretability analysis
This section presents the results of the global interpretability analysis using the RF model utilizing the SHAP technique. As depicted in , the SHAP for the global interpretability analysis uncovered the relative order of the importance of features (Blood > Fantasy Violence > Strong Language > Blood and Gore). For example, the ML model pushed the rating predictions higher (i.e., higher Shapley values for the output) when Blood, Fantasy Violence, Strong Language, and Blood and Gore were high. Such a representation of the underlying physical processes shows that models can reveal meaningful physical interactions between the features (independent variables) and the game rating classes (dependent variables).
Figure 3. Global interpretation plots of the RF game rating categories.
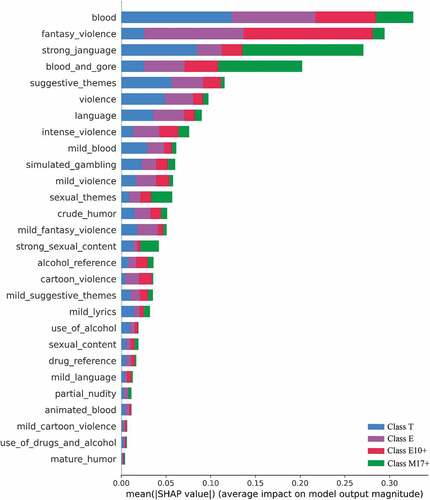
The essential values from the SHAP global interpretability analysis for the rating classes are shown in . The results indicate that the influence of a feature slightly differs in each prediction class (i.e., E, E10+, T, M17+). In prediction class E, the order of the most important features was Fantasy Violence > Blood > Blood and Gore > Suggestive Themes, while, in class E10+, the order was Fantasy Violence > Blood > Blood and Gore > Strong Language. In class T, the model revealed an order of Blood > Strong Language > Suggestive Themes > Violence. On the other hand, Strong Language > Blood and Gore > Blood and Sexual Themes were the features with the highest importance in prediction class M17 + .
Evaluation results of the local interpretability analysis
To further investigate the prominent feature interactions that drive the game rating prediction, this study performed a local interpretability analysis, as depicted in . (a) shows the global interpretability analysis for prediction class E. Almost all features (y-axis) and the SHAP values (x-axis) are on the positive side (a low value in a blue dot), indicating that lower values of these features drive the prediction of class E. Fantasy Violence and Blood have a strong influence on the positive side when the feature value is low. Thus, it is expected that a low percentage of harmful content (i.e., Fantasy Violence and Blood) in a game leads to the game being rated E. The local interpretability analysis also gives an overview of the influence of each feature on the model prediction, as depicted in (b). For the right y-axis, 1 means the presence and 0 the absence of a feature. For the left y-axis, a positive SHAP value means that it pushes the model toward predicting an E rating, and a negative SHAP value means that lower values of the feature contribute negatively to predicting an E rating. As can be seen in (b), the negative SHAP value of Blood and Fantasy Violence in a game contributes negatively to the game being rated E. In contrast, the positive SHAP value of Mild Fantasy Violence means that this feature substantially influences the model in deciding an E classification. In other words, the lower the percentage of Fantasy Violence and Blood and the higher the percentage of Mild Fantasy Violence in a game, the more likely the game is rated E. Blood, Blood and Gore, and Strong Language substantially impact the positive side when the feature value is low. In contrast, Fantasy Violence strongly affects the positive side when the feature value is high. This condition drives the model output toward predicting an E10+ classification. The local interpretability analysis in (b) reveals that Blood, Blood and Gore, and Strong Language contribute negatively to predicting E10 + . On the other hand, Fantasy Violence contributes positively toward predicting E10 + . Thus, it is expected that a lower percentage of Blood, Blood and Gore, and Strong Language and a higher percentage of Fantasy Violence both lead to the prediction of an E10+ grade. In other words, the lower the percentage of Blood, Blood and Gore, and Strong Language and the higher the percentage of Fantasy Violence in a game, the more likely the game is rated E10 + .
Figure 4. Global (a) and local (b) interpretation plots of RF for predicting the E rating.
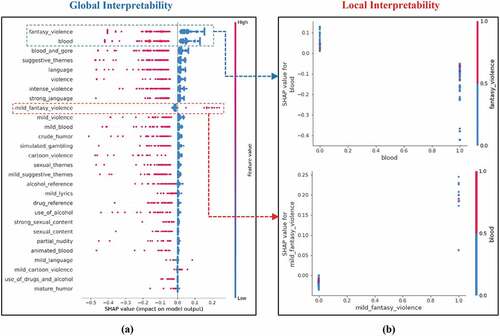
Figure 5. Global (a) and local (b) interpretation plots of RF for predicting the E10+ rating.
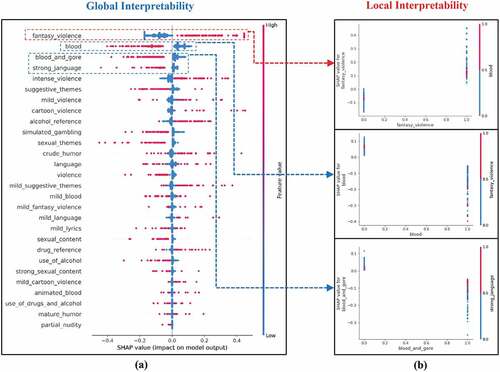
Figure 6. Global (a) and local (b) interpretation plots of RF for predicting the T rating.
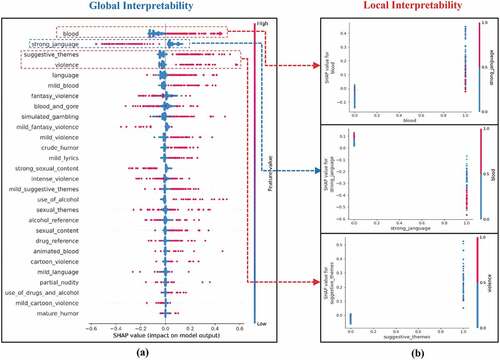
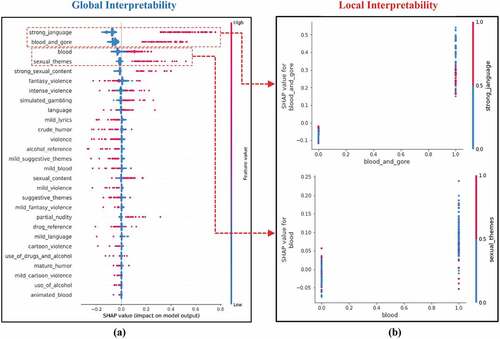
Figure 7. Global (a) and local (b) interpretation plots of RF for predicting the M17+ rating.
As for the global interpretability analysis of class T, (a) shows that Strong Language affects the positive side when the feature value is low. In contrast, Blood, Suggestive Themes, and Violence significantly impact the positive side when the feature value is high. Their SHAP value is positive, meaning that this feature raises the prediction value and contributes to the T prediction. The local interpretability analysis also indicates that Strong Language contributes negatively to predicting T. On the other hand, Blood, Suggestive Themes, and Violence contribute positively toward predicting T, as depicted in (b). Thus, it can be inferred that the lower the percentage of Strong Language and the higher the percentage of Blood, Suggestive Themes, and Violence in a game, the more likely the game is rated T.
Finally, (a) and 7 (b) present the global and local interpretability analysis, showing that Strong Language, Blood and Gore, Blood, and Sexual Themes strongly influence the prediction of an M17+ rating. In other words, the higher the percentage of those types of content in a game, the higher the probability of that game being rated M17 + .
Discussion
This section discusses the analysis of the potentially harmful content in video games and compares it with findings of previous studies. The results of the global interpretability analysis show that the following features (in order of importance) contribute most to the game rating prediction: Blood > Fantasy Violence > Strong Language > Blood and Gore. When a video game has these types of content, the game is more likely to be classified into one of the game rating categories (i.e., E, E10+, T, M17+).
As for the local interpretability analysis, the results indicate that Fantasy Violence, Blood, and Mild Fantasy Violence are significant features for an E rating. Meanwhile, for the E10+ and T ratings, Fantasy Violence, Blood, Blood and Gore, Strong Language, Suggestive Themes, and Violence are found to be the essential features. On the other hand, Strong Language, Blood and Gore, Blood, and Sexual Theme are the common features for the M17+ rating. An examination of the interpretability analysis revealed several types of harmful content that might potentially relate to adverse effects on players. Such content included the depictions of blood, the mutilation of body parts, violent actions of human or non-human characters, and the frequent use of profanity (see Appendix B).
A limitation of our study is that the interpretability analysis was based on the ESRB game rating system, so other game rating systems were not explored (e.g., PEGI, ACB, OFLC, CERO). Future studies should use another data set to investigate whether our findings can be confirmed. Furthermore, in our study, the presence or absence of a game feature or content descriptor was expected to be a binary variable. However, in addition to the base presence of a content descriptor, the quantity of a content descriptor (e.g., how many violent scenes a game contains) may also influence the game rating prediction (e.g., M17+). This study abstained from exploring the number of content descriptors included in a game because of the qualitative nature of measuring a game’s content types. Thus, future work should explore metrics that define the number of specific content descriptors included in a game (i.e., objectively estimating the amount of harmful content in a game) to investigate the impact of the quantity of game content on the model prediction. Another limitation is that this study examined only PlayStation and Xbox game platforms. Thus, similar studies using different game platforms, such as mobile platforms, may be conducted in the future.
This study does not claim that our findings, the harmful content, will directly harm players; instead, based on data analysis, this study emphasizes that harmful content frequently appears in games and that it may potentially have an adverse effect on players. However, more experimental studies, such as studies using questionnaires and interviews, are needed to investigate the direct effects of harmful content.
Overall, it is found that interpretable ML models display promising results regarding the harmful content in video games. This technique successfully captures the underlying process in the ML model and how it constructs predictions. The interpretable ML models are believed to satisfy specific curiosities, aims, hopes, requirements, and needs regarding artificial systems (Langer et al. Citation2021). This study demonstrates that interpretable ML models can reveal potentially harmful content in video games. Combining global and local explanations presents an accurate picture of the real-world game rating system and offers a simple explanation for human understanding.
Conclusions
The main goal of this study is to examine the potential of an interpretable ML model for explaining the harmful content in video games that may potentially cause adverse effects on players based on a multi-class game rating classification. This study employed the ESRB game rating system using the interpretable ML model. In total, 1,895 games and 500 games with 30 ESRB content descriptors were used to test the model.
The first hypothesis was examined through the performance of ensemble and non-ensemble ML models using the hyper-parameter technique (i.e., randomized search CV and 10-fold CV). The results showed that ensemble models (i.e., RF) outperformed the other models in predicting game rating categories. Therefore, the RF was chosen for the interpretability analysis, resulting in an accuracy of 84.20%, a precision of 85.00%, a recall of 84.00%, and an F1 score of 84.00%.
The second hypothesis was examined using the global and local interpretability analysis of the SHAP framework for the RF model. The global interpretability analysis revealed several types of harmful content in the following order: Blood > Fantasy Violence > Strong Language > Blood and Gore. When a video game contains these elements, it drives the model to predict one of the game rating categories (i.e., E, E10+, T, M17+). However, to assess the importance of an individual feature, a local interpretability analysis should be conducted. The local interpretability analysis quantified the essential inflection points in each predictor that drives the model’s prediction, finding high Mild Fantasy Violence and low Fantasy Violence and Blood rates for the E game rating. Further, a lower rate of Blood, Blood and Gore, and Strong Language and a higher rate of Fantasy Violence both lead to predicting an E10+ game rating. In comparison, a lower rate of Strong Language and a higher rate of Blood, Suggestive Themes, and Violence drive the model to predict a T rating. For the M17+ rating, Strong Language, Blood and Gore, Blood, and Sexual Themes significantly influence the prediction. Our analysis confirmed that the feasibility of this interpretable ML model was enhanced when the models were coupled with the global and local interpretability analysis. An examination of the interpretability analysis revealed several types of harmful content that might potentially relate to adverse effects on players. Such content included depictions of blood, the mutilation of body parts, violent actions of human or non-human characters, and the frequent use of profanity.
In general, the results showed that the interpretable ML model could successfully identify several types of harmful content that may cause adverse effects on players of video games. These findings demonstrate the strength of this technique in explaining the harmful content in video games. Also, interpretable ML models can provide new insights for stakeholders (e.g., domain experts, parents, teachers, game developers, and policy-makers) and forge a better integration of video game research and applications. The SHAP framework offers valuable insights for explaining the results from an advanced algorithm, such as RF. The technique can evaluate the importance of a feature and track and elucidate the complex and detailed impacts on the model’s output. In particular, the different effects of various types of content on the game rating prediction provided essential information that cannot be obtained by the game rating systems themselves. Finally, the knowledge gained from this study can help several stakeholders, such as those evaluating policy decisions, in developing effective regulation to mitigate the adverse effects of video games in real life, understanding the existing knowledge regarding the harmful content in video games, and creating optimal gaming profiles for specific groups of users.
As future works, this study would like to incorporate our analysis into the positive side of video games using the same method, explaining the positive content in video games that may cause constructive effects on players based on game rating predictions. Our study will also be extended to other video games platforms, such as PC and Mobile games. In this way, we could help understand the positive effects of a group of users in a broader way.
Supplementary Online Materials
Appendix A-C (https://bit.ly/3oh7D6q)
Author Contributions
Authors contributed equally to this work. All authors have read and agreed to the published version of the manuscript.
Acknowledgments
The authors would like to thank the Kaggle website for providing the data set on their webpage.
Disclosure Statement
No potential conflict of interest was reported by the author(s).
Data Availability Statement:
Data available in a publicly accessible repository, see Section Materials and Methods. https://www.kaggle.com/imohtn/video-games-rating-by-esrb
Correction Statement
This article has been republished with minor changes. These changes do not impact the academic content of the article.
Additional information
Funding
References
- ACB. 2021. “The australian classification board.” 2021. https://www.legislation.gov.au/Details/C2017C00267 .
- Alomari, K. M., A. Q. Alhamad, H. O. Mbaidin, and S. Salloum. 2019. Prediction of the digital game rating systems based on the ESRB. Opcion 35 (19):1368–563.
- Antwarg, L., R. M. Miller, B. Shapira, and L. Rokach. 2021. Explaining anomalies detected by autoencoders using shapley additive explanations[formula presented]. Expert Systems with Applications 186 (August):115736. doi:10.1016/j.eswa.2021.115736.
- Alejandro Barredo Arrieta, Natalia Díaz-Rodríguez, Javier Del Ser, Adrien Bennetot, Siham Tabik, Alberto Barbado, Salvador Garcia, Sergio Gil-Lopez, Daniel Molina, Richard Benjamins, Raja Chatila, Francisco Herrera. 2020. Explainable artificial intelligence (XAI): Concepts, taxonomies, opportunities and challenges toward responsible AI. Information Fusion 58: 82–115. ISSN 1566-2535. doi:10.1016/j.inffus.2019.12.012.
- Belle, V., and I. Papantonis. 2021. Principles and practice of explainable machine learning. Frontiers in Big Data 4 (July):1–25. doi:10.3389/fdata.2021.688969.
- Bergstra, J., and Y. Bengio. 2012. Random search for hyper-parameter optimization. Journal of Machine Learning Research 13:2.
- Bernhaupt, R., and F. F. Mueller. 2016. “Game user experience evaluation.” In Proceedings of the 2016 CHI Conference Extended Abstracts on Human Factors in Computing Systems - CHI EA ’16, San Jose, United States. https://doi.org/10.1145/2851581.2856683 .
- Boyle, E. A., T. M. Connolly, T. Hainey, and J. M. Boyle. 2012. Engagement in digital entertainment games: A systematic review. Computers in Human Behavior 28 (3):771–80. doi:10.1016/j.chb.2011.11.020.
- Boyle, E. A., T. M. Thomas Hainey, G. G. Connolly, J. Earp, M. Ott, T. Lim, M. Ninaus, C. Ribeiro, and J. Pereira. 2016. An update to the systematic literature review of empirical evidence of the impacts and outcomes of computer games and serious games. Computers & Education 94:178–92. doi:10.1016/j.compedu.2015.11.003.
- Caroux, L., K. Isbister, L. Le Bigot, and N. Vibert. 2015. Player-video game interaction: A systematic review of current concepts. Computers in Human Behavior 48:366–81. doi:10.1016/j.chb.2015.01.066.
- CERO. 2021. “Computer entertainment rating organization.” 2021. https://www.cero.gr.jp/en/publics/index/17/ .
- Chakraborty, D., H. Başağaoğlu, and J. Winterle. 2021. Interpretable vs. noninterpretable machine learning models for data-driven hydro-climatological process modeling. Expert Systems with Applications 170 (May):2020. doi:10.1016/j.eswa.2020.114498.
- Das, A., and P. Rad. 2020. Opportunities and challenges in explainable artificial intelligence (XAI): A survey. ArXiv 1–24. https://arxiv.org/abs/2006.11371 .
- Duarte, L., C. Silveira, and A. L. Battaiola. 2017. Distinctive features and game design. Entertainment Computing 21:83–93. doi:10.1016/j.entcom.2017.03.002.
- Engström, H., B. B. Marklund, P. Backlund, and M. Toftedahl. 2018. Game development from a software and creative product perspective: A quantitative literature review approach. Entertainment Computing 27:10–22. doi:10.1016/j.entcom.2018.02.008.
- ESA. 2020. “2020 essential facts about the video game industry.” Entertainment Software Association. https://www.theesa.com/resource/2020-essential-facts/ .
- ESRB. 2021. “The Entertainment Software Rating Board (ERSB).” 2021. https://www.esrb.org/.
- Felini, D. 2015. Beyond today’s video game rating systems: A critical approach to PEGI and ESRB, and proposed improvements. Games and Culture 10 (1):106–22. doi:10.1177/1555412014560192.
- Fernandez, A., F. Herrera, O. Cordon, M. J. Del Jesus, and F. Marcelloni. 2019. Evolutionary fuzzy systems for explainable artificial intelligence: why, when, what for, and where to? IEEE Computational Intelligence Magazine 14 (1):69–81. doi:10.1109/MCI.2018.2881645.
- Gabbiadini, A., P. Riva, L. Andrighetto, C. Volpato, and B. J. Bushman. 2016. Acting like a tough guy: violent-sexist video games, identification with game characters, masculine beliefs, & empathy for female violence victims. PLoS ONE 11 (4):1–14. doi:10.1371/journal.pone.0152121.
- Golden, C. E., M. J. Rothrock, and A. Mishra. 2019. Comparison between random forest and gradient boosting machine methods for predicting listeria spp. prevalence in the environment of pastured poultry farms. Food Research International 122:47–55. doi:10.1016/j.foodres.2019.03.062.
- GRB. 2021. “Game rating board.” 2021. https://www.grac.or.kr/english/ .
- Griffiths, M. 2005. Video games and health. BMJ (Clinical Research Ed.) 331 (7509):122–23. doi:10.1136/bmj.331.7509.122.
- Gros, L., N. Debue, J. Lete, and C. van de Leemput. 2020. Video game addiction and emotional states: Possible confusion between pleasure and happiness? Frontiers in Psychology 10 (January):1–21. doi:10.3389/fpsyg.2019.02894.
- Guidotti, R., A. Monreale, S. Ruggieri, F. Turini, D. Pedreschi, and F. Giannotti. 2018. A survey of methods for explaining black box models. ArXiv 51:5.
- Hamid, R. S., and N. Shiratuddin. 2016. Filtering violence and sexual content: The necessities of digital games content rating system for malaysia’s environment. Journal of Telecommunication, Electronic and Computer Engineering 8 (8):83–89 .
- Hellström, C., K. W. Nilsson, J. Leppert, and Å. Cecilia. 2015. Effects of adolescent online gaming time and motives on depressive, musculoskeletal, and psychosomatic symptoms. Upsala Journal of Medical Sciences 120 (4):263–75. doi:10.3109/03009734.2015.1049724 .
- Joharestani, Z., C. C. Mehdi, N. Xiliang, B. Bashir, and S. Talebiesfandarani. 2019. PM2.5 prediction based on random forest, xgboost, and deep learning using multisource remote sensing data. Atmosphere. doi:10.3390/atmos10070373.
- Kabiraj, S., M. Raihan, N. Alvi, M. Afrin, L. Akter, S. A. Sohagi, and E. Podder. 2020. “Breast cancer risk prediction using XGBoost and random forest algorithm.” In 2020 11th International Conference on Computing, Communication and Networking Technologies (ICCCNT), 1–4, Kharagpur, India. https://doi.org/10.1109/ICCCNT49239.2020.9225451 .
- Kaggle. 2021. “ESRB rating dataset.” https://www.kaggle.com/imohtn/video-games-rating-by-esrb .
- Karakoç, B., K. Eryılmaz, E. T. Özpolat, and İ. Yıldırım. 2020. The effect of game-based learning on student achievement: A meta-analysis study. Technology, Knowledge and Learning. doi:10.1007/s10758-020-09471-5.
- Kardani, N., A. Zhou, M. Nazem, and S.-L. Shen. 2021. Improved prediction of slope stability using a hybrid stacking ensemble method based on finite element analysis and field data. Journal of Rock Mechanics and Geotechnical Engineering 13 (1):188–201. doi:10.1016/j.jrmge.2020.05.011.
- Kiziloz, H. E. 2021. Classifier ensemble methods in feature selection. Neurocomputing 419:97–107. doi:10.1016/j.neucom.2020.07.113.
- Knapič, S., A. Malhi, R. Saluja, and F. Kary. 2021. Explainable artificial intelligence for human decision support system in the medical domain. Machine Learning and Knowledge Extraction 3 (3):740–70. doi:10.3390/make3030037.
- Laczniak, R. N., L. Carlson, D. Walker, and E. Deanne Brocato. 2017. Parental restrictive mediation and children’s violent video game play: The effectiveness of the Entertainment Software Rating Board (ESRB) rating system. Journal of Public Policy & Marketing 36 (1):70–78. doi:10.1509/jppm.15.071.
- Langer, M., D. Oster, T. Speith, H. Hermanns, L. Kästner, E. Schmidt, A. Sesing, and K. Baum. 2021. what do we want from explainable artificial intelligence (XAI)? – A stakeholder perspective on XAI and a conceptual model guiding interdisciplinary XAI research. Artificial Intelligence 296:103473. doi:10.1016/j.artint.2021.103473.
- Lee, E. J., H. S. Kim, and S. Choi. 2021. Violent video games and aggression: stimulation or catharsis or both? Cyberpsychology, Behavior and Social Networking 24 (1):41–47. doi:10.1089/cyber.2020.0033.
- Li, J. Y., Q. Du, and X. Gao. 2020. Adolescent aggression and violent video games: The role of moral disengagement and parental rearing patterns. Children and Youth Services Review 118 (2):105370. doi:10.1016/j.childyouth.2020.105370.
- Li, Y., and W. Chen. 2020. A comparative performance assessment of ensemble learning for credit scoring. Mathematics 8 (10):1–19. doi:10.3390/math8101756.
- Liang, Z., C. Wang, and K. U. Jan Khan. 2021. Application and comparison of different ensemble learning machines combining with a novel sampling strategy for shallow landslide susceptibility mapping. Stochastic Environmental Research and Risk Assessment 35 (6):1243–56. doi:10.1007/s00477-020-01893-y.
- Linardatos, P., V. Papastefanopoulos, and S. Kotsiantis. 2021. Explainable Ai: A review of machine learning interpretability methods. Entropy 23 (1):1–45. doi:10.3390/e23010018.
- Lipton, Z. C. 2018. The mythos of model interpretability. Queue 16 (3):31–57. doi:10.1145/3236386.3241340 .
- Lu, Y., Z. Xu, Y. Kang, Y. Cao, B. Liu, L. Pei, R. Wang, and R. Wang. 2021. “False invoicing feature identification and risk prediction.” In 2021 36th Youth Academic Annual Conference of Chinese Association of Automation (YAC), 809–14, Nanchang, China. https://doi.org/10.1109/YAC53711.2021.9486639 .
- Magesh, P. R., R. D. Myloth, and R. J. Tom. 2020. An explainable machine learning model for early detection of parkinson’s disease using LIME on DaTSCAN imagery. Computers in Biology and Medicine 126 (July):104041. doi:10.1016/j.compbiomed.2020.104041 .
- Mao, W., Y. Cui, M. M. Chiu, and H. Lei. 2021. Effects of Game-based learning on students’ critical thinking: A meta-analysis. Journal of Educational Computing Research 59(8): 1682-1708. 07356331211007098 .
- MDA. 2021. “Media development authority.” 2021. https://www.imda.gov.sg/regulations-and-licensing-listing/content-standards-and-classification/standards-and-classification/video-games .
- Media, F. L. 2020. “Report: gaming revenue to top $159B in 2020.” Reuters. https://www.reuters.com/article/esports-business-gaming-revenues-idUSFLM8jkJMl .
- Meng, Y., N. Yang, Z. Qian, and G. Zhang. 2021. What makes an online review more helpful: An interpretation framework using xgboost and shap values. Journal of Theoretical and Applied Electronic Commerce Research 16 (3):466–90. doi:10.3390/jtaer16030029 .
- Moscato, V., A. Picariello, and S. Giancarlo. 2021. A benchmark of machine learning approaches for credit score prediction. Expert Systems with Applications 165:113986. doi:10.1016/j.eswa.2020.113986 .
- Nguyen, K. A., W. Chen, B.-S. Lin, and U. Seeboonruang. 2021. Comparison of ensemble machine learning methods for soil erosion pin measurements. ISPRS International Journal of Geo-Information 10 (1):42. doi:10.3390/ijgi10010042 .
- Nguyen, T., and S. Landau. 2019. Effects of gaming on children’s brains: Depression and social isolation. Advances in Social Sciences Research Journal 6 (9):291–302. doi:10.14738/assrj.69.4856 .
- Nor, A. K. M., S. R. Pedapati, M. Muhammad, and V. Leiva. 2021. “Explainable artificial intelligence for anomaly detection and prognostic of gas turbines using uncertainty quantification with sensor-related data explainable artificial intelligence for anomaly detection and prognostic of gas turbines using uncertainty Q,” no. September. DOI:10.20944/preprints202109.0034.v2 .
- OFLC. 2021. “Office of film & literature classification, New Zealand.” 2021. https://www.msd.govt.nz/about-msd-and-our-work/publications-resources/journals-and-magazines/social-policy-journal/spj19/censorship-new-zealand-challenges19-pages1-13.html .
- Palatnik de, S. I., M. M. B. Rebuzzi Vellasco, and E. C. Da Silva. 2019. Local interpretable model-agnostic explanations for classification of lymph node metastases. Sensors (Switzerland) 19 (13):7–9. doi:10.3390/s19132969 .
- Parsa, A. B., A. Movahedi, H. Taghipour, S. Derrible, and A. (Kouros) Mohammadian. 2020. Toward safer highways, application of XGBoost and SHAP for real-time accident detection and feature analysis. Accident Analysis and Prevention 136 (October 2019):105405. doi:10.1016/j.aap.2019.105405 .
- PEGI. 2021. “The Pan European Game Information (PEGI).” 2021. https://pegi.info/what-do-the-labels-mean .
- Quwaider, M., A. Alabed, and R. Duwairi. 2019. The impact of video games on the players behaviors: A survey. Procedia Computer Science 151 (2018):575–82. doi:10.1016/j.procs.2019.04.077 .
- Sălceanu, C. 2014. The influence of computer games on children’s development. Exploratory study on the attitudes of parents. Procedia - Social and Behavioral Sciences 149:837–41. doi:10.1016/j.sbspro.2014.08.323.
- Siervo, M., S. Sabatini, M. S. Fewtrell, and J. C. K. Wells. 2013. Acute effects of violent video-game playing on blood pressure and appetite perception in normal-weight young men: A randomized controlled trial. European Journal of Clinical Nutrition 67 (12):1322–24. doi:10.1038/ejcn.2013.180.
- Stephens, R., and A. Zile. 2017. Does emotional arousal influence swearing fluency? Journal of Psycholinguistic Research 46 (4):983–95. doi:10.1007/s10936-016-9473-8.
- Tjoa, E., and C. Guan. 2020. A survey on explainable artificial intelligence (XAI): Toward medical XAI. IEEE Transactions on Neural Networks and Learning Systems November:1–21. doi:10.1109/TNNLS.2020.3027314.
- WHO. 2018. “World health organization.” https://www.who.int/features/qa/gaming-disorder/en/.