
 ?Mathematical formulae have been encoded as MathML and are displayed in this HTML version using MathJax in order to improve their display. Uncheck the box to turn MathJax off. This feature requires Javascript. Click on a formula to zoom.
ABSTRACT
The number of people suffering from epilepsy in the world exceeds 50 million and around 20% of this group refers to patients who have psychogenic nonepileptic seizures (PNES). Unlike epilepsy, PNES requires psychological treatment. When not correctly diagnosed, these patients can be submitted to a treatment based on antiepileptic drugs besides specific procedures for epilepsy. In this work, we propose the identification of patients with PNES from those with epilepsy using electroencephalogram (EEG) signals. Discrete Wavelet Transform (DWT) decomposition and a Support-Vector Machine (SVM) classifier were employed. Common types of wavelet families and SVM kernels were combined and compared. The results obtained for accuracy, sensitivity, and specificity are equal to 100% for the set of configuration parameters composed of windows encompassing whole seizures, wavelet Coiflet 1, and SVM kernel sigmoid or RBF. The proposed method is efficient and feasible to be applied to new patients admitted in a hospital center, even without having their previous EEG signals already collected. The main advantages of the proposed work are not requiring the use of accelerometer nor electromyographic signals, not being patient specific and outperforming other works results.
Introduction
According to the World Health Organization, it is estimated that the number of people suffering from epilepsy in the world exceeds 50 million (World Health Organization Citation2020). Santos et al. (Citation2014) affirm that around 20% of this group refers to patients who have the so-called psychogenic nonepileptic seizures (PNES). Unlike epilepsy, PNES is of psychogenic nature and requires psychological treatment. When not correctly diagnosed, these patients can be submitted to a common treatment based on antiepileptic drugs besides specific procedures for epilepsy.
Based on the previously presented scenario and the negative impact caused to the PNES patient who receives a wrong diagnosis, there are many studies attempting to distinguish between epileptic seizures (ES) and PNES. Bolen, Koontz, and Pritchard (Citation2016) tried to show the difference in Magnetic Resonance Imaging (MRI) images between epilepsy patients with temporal focal lesion and patients with PNES with multifocal lesions. This multifocal nature may explain the higher probability of psychiatric comorbidities in PNES patients. Kerr et al. (Citation2017) used review-of-systems questionnaires (RoSQs) and multivariate logistic regression as an early screening tool to differentiate PNES from other seizure types. Although patients with PNES reported more than twice as many symptoms than the other studied groups, the accuracy of the method was not significantly high. Asadi-Pooya, Tinker, and Fletman (Citation2017) classified PNES seizures based on the video-EEG monitoring in order to investigate the seizure variability. Four classes were distinguished based mainly on the motor response of the patient, and some of them still presented seizures with more than one class. Since the variability increases with the number of classes the authors concluded that neither the stereotypy nor the variability of PNES can or should be used as a marker of the disease and to differentiate PNES from epilepsy.
In the previous examples, the accuracy of the methods was the main bottleneck in the differentiation of the groups. In order to improve these analyses and considering the advance of technology, machine learning has been applied as a more reliable tool (Obermeyer and Emanuel Citation2016). For example, when combined with EEG signal decomposition techniques, such as the Wavelet Transform (Mallat Citation1989), it is possible to detect or even predict epileptic seizures as can be observed in the works Rosado and Rosa (Citation2016); Satapathy, Jagadev, and Dehuri (Citation2017); Kitano et al. (Citation2018); Qaraqe et al. (Citation2016).
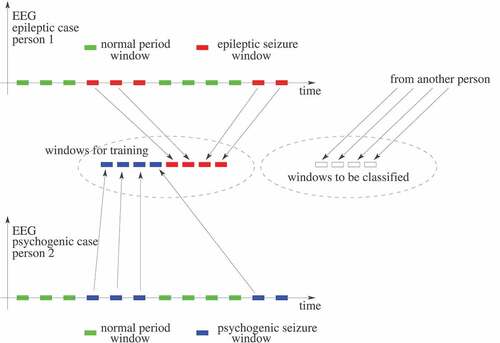
In the literature, there are several published works about detecting epileptic seizures in the EEG of a patient, as Tzallas, Tsipouras, and Fotiadis (Citation2009), Guo et al. (Citation2010), Yuan et al. (Citation2012), Wang et al. (Citation2015), Hassan and Haque (Citation2015), Bhardwaj et al. (Citation2016), Hassan, Siuly, and Zhang (Citation2016), Upadhyay, Padhy, and Kankar (Citation2016), Hassan and Subasi (Citation2016), Kabir, Zhang, and Zhang (Citation2016), Vidyaratne and Iftekharuddin (Citation2017), Achilles et al. (Citation2018), Subasi, Kevric, and Canbaz (Citation2019), Tian et al. (Citation2019), Hassan, Subasi, and Zhang (Citation2020) and Siddiqui et al. (Citation2020). It is worth noting that detecting an epileptic seizure is not the same problem as differentiating an epileptic seizure from a PNES. In about epileptic seizures detection, a hypothetical EEG signal from a patient is represented along the time. In it, time windows without seizures are represented in green and epileptic seizures windows in red. A detection system is trained using both types of windows (with and without seizures) and evaluated later, normally using other EEG windows from the same patient. Unlike that, differentiating epileptic seizures from PNES is as depicted in in which there is an EEG signal from an epileptic patient (at the top) and an EEG signal from a PNES patient (at the bottom), who is another person. From both types of EEG signals, only seizures windows are extracted for training. Thus, contrary to the epileptic seizures detection system strategy, this differentiating system is trained using only seizures windows, but from different patients. Then the evaluation phase is performed on EEG signals from new patients not yet known in the training process. So we assume in this work that an epileptic seizures detection system results are not directly comparable to a system aimed to differentiate epileptic seizures from PNES.
Figure 1. Epileptic seizure detection process in an EEG signal.
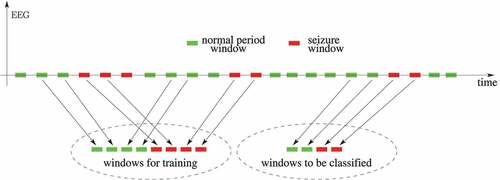
Figure 2. Learning model to the process aimed at differentiating epileptic seizures from PNES.
In this sense, considering the focus on distinguishing PNES from ES, the number of works using machine learning combined with other techniques has grown in recent decades (Obermeyer and Emanuel Citation2016). Kusmakar et al. (Citation2015) collected the signals from 10 different upper muscles using an accelerometer during epilepsy seizures and PNES. Combining those measures and the electromyography (EMG) of the muscles, an algorithm to classify PNES was proposed. The variation coefficients obtained from Discrete Wavelet Transform (DWT) generated the vectors used by the SVM (Support Vector Machine) classifier. An accuracy of 88.57% was achieved. Gubbi et al. (Citation2016) proposed a wearable device with accelerometers to detect and classify PNES. An algorithm based on k-means and SVM using dyadic scale features resulted in accuracies between 60% and 90%. Although Beniczky et al. (Citation2016) affirm that there is a distinction in EMG signals of epileptic and psychogenic seizures, it is important to note that not all seizures present muscular contractions as observed by Asadi-Pooya, Tinker, and Fletman (Citation2017). Therefore, atonic seizures are excluded from the evaluation when EMG signals are used.
Gasparini et al. (Citation2018) classified PNES patients from healthy control subjects by using a Deep Learning (DL) Stacked Auto Encoders (SAE) architecture composed of two hidden layers of 50 and 20 neurons. Continuous Wavelet Transform was considered and a comparison with other techniques such as SVM, LDA (Linear Discriminant Analysis), and QDA (Quadratic Discriminant Analysis) was performed, resulting in an accuracy of 86%. Vasta et al. (Citation2018) also compared PNES and healthy individuals through Random Forest (RF) algorithm and biomarkers based on video-EEG which resulted an accuracy of about 75%. Varone et al. (Citation2020) developed a software pipeline using statistical features extracted from the power spectral density of the EEG signals. It should be noted that the purpose of these works was to differentiate PNES from control healthy cases having no seizures whereas our purpose was to differentiate PNES from epileptic cases.
Several papers concentrate on the identification of subclasses of PNES. Magaudda et al. (Citation2016) aimed to the validation of a novel classification for the diagnosis of PNES, dividing the patients into four distinct groups: Hypermotor (H), Akinetic (A), Focal Motor (FM), and with Subjective Symptoms (SS). The classification was performed by epileptologists and psychiatrist based on video-EEG recordings and the seizures were assigned to a given class in 83.6% of the cases. In contrast, the artificial neural network (ANN) classified PNES in 86.7%. Duwicquet et al. (Citation2017) evaluated how reliable are the methods to classify PNES. Through the statistical method of Cohen’s Kappa the inter-rater reliability (IRR) of five existing clinical PNES classifications was determined. They concluded that IRR was only moderate and the difficulty was attributed to the analysis of motor signals.
Pippa et al. (Citation2016) investigated the use of machine learning for automatic classification of ES and PNES based on multi-channel EEG signals. The signal patterns in the time domain and in the frequency domain were determined and then combined, generating the vectors used in the different machine learning techniques: BayesNet, Random Committee, Random Forest, K-Nearest Neighbors, SMO (Sequential Minimal Optimization). The best result was achieved by BayesNet with accuracy of 96%. In a subsequent work, Pippa et al. (Citation2017) focused on the dimensionality reduction of the EEG data to distinguish PNES from ES. They used three different fusion schemes to combine the information across the channels and concluded that late-integration (LI) scheme with global model was the best, presenting an accuracy of 97%. Ahmadi et al. (Citation2018) studied the use of Imperialist Competitive Algorithm (ICA) to find the most important features extracted from the five sub-bands Wavelet Transform. Different classifiers have been tested and SVM with RBF kernel has achieved the best result with 95% of accuracy. Further on, Ahmadi et al. (Citation2020) presented a work using short-term EEG data, the classification of epilepsy and PNES subjects based on signal, functional network, and EEG microstate features. They concluded that the beta-band and the coverage are the most important features for classification of epilepsy and PNES patients and achieved an accuracy of around 80% when the classification was computed based on the microstate features extracted from the beta-bands. It should be noted that one merit of that work was that it only used seizures free EEG temporal windows, which probably makes the classification problem more difficult than when using windows containing seizures.
It may be noticed that the possibilities for research in this field are vast. Much has been studied but there is still much to be improved. In this work, we propose the identification of patients with PNES from those with epilepsy using only EEG signal DWT decomposition and an SVM classifier. A system based on this strategy would be useful as a tool for a fast diagnosis between these two possibilities. Furthermore, it would be even better if there is no need to have previous known EEG signals of a newly admitted patient. Thus, this would contribute to the proper treatment for this patient.
Method
The experimental data consists of EEG signals in 18 channels, sampled at 200 Hz, bandpass filtered from 0.3 to 35 Hz by the NeuroWorkbench software, collected as Video-EEG signals by an EEG-1200 Diagnostic and Monitoring Platform. The signals came from 12 PNES patients (3 males and 9 females) and 21 epileptic patients (9 males and 12 females) aged from 6 to 57 years old. The number of PNES occurrences in the first group ranged from 1 to 17 per patient and the number of epileptic seizures in the second group ranged from 1 to 29 per patient. All data were collected from spontaneous (not induced) events. These data are presented in detail in and . In those tables, the term window refers to the EEG temporal fragmentation to be explained further in this section. Ethical approval for this study was obtained from Local and National Ethics Committee (CAAE:. 49495715.4.0000.0068).
Table 1. PNES patients and data characteristics
Table 2. Epilepsy patients and data characteristics
presents the classification process steps used in this work.
Figure 3. Process steps used to differentiate between PNES and ES in EEG signals.
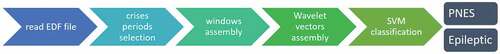
The EEG signals used in this work were encoded in European Data Format (EDF) files. They have been read using the function edfRead in Matlab software. In the signals, seizures periods have been previously identified by a specialist analyzing Video-EEG records.
In the windows assembly step, two alternatives have been explored: windows having fixed one second duration and windows encompassing whole seizures periods. The numbers of available windows in these alternatives are shown in the last two columns of and . The one second duration in the first alternative has been chosen because in EEG epileptic signals, there are spike waves characterized by a pointed peak with a duration of 20–70 ms and sharp waves with a duration of 70–200 ms (Puspita et al. Citation2017). One second windows are able to encompass them. All these windows were extracted from seizures periods.
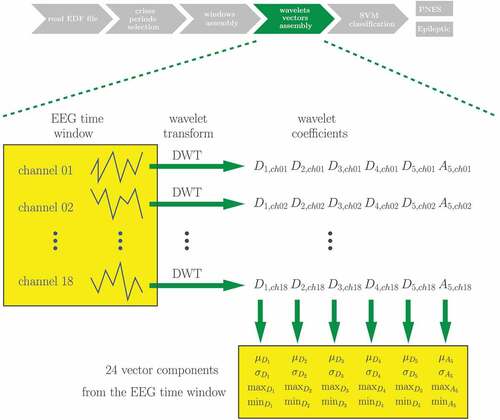
The next step can be better understood from . For the Wavelet vectors assembly, the wavelets families Coiflet 1 and Daubechies 4 have been alternatively employed when the Discrete Wavelet Transform (DWT) (Mallat Citation1989) has been applied to each channel of each EEG time window assembled in the previous step. The same scheme is used for both one second windows and windows encompassing the whole seizures periods. The choice of these wavelets families is based on the works of Indiradevi et al. (Citation2008) and Gandhi, Panigrahi, and Anand (Citation2011), who have studied what are the most suitable wavelets families to extract EEG characteristics in this context. The DWT has been performed using Matlab software. For each time window, the corresponding characteristic vector has been assembled receiving the average (), standard deviation (
), maximum (max) and minimum (min) values of the coefficients at each DWT resolution level for all EEG channels. There were coefficients at five detail levels (
to
) and the approximation coefficients (
). Each of the parameters
,
, max, and min has been calculated from the set containing the coefficients at the same detail level for all channels. This resulted in 24 components for each vector, four components for each wavelet level. The resultant characteristic vectors have then been normalized to have values between
and
.
Figure 4. Vectors assembly step.
In the SVM classification step, three alternative kernels have been used: linear, sigmoid, and RBF. The SVM implementation used in this work has been the LIBSVM (Chang and Lin Citation2011) inside Matlab. Training an SVM consists in solving an optimization problem, in which data examples and their corresponding classes are provided as inputs and an optimal separator between the classes is found as the result (Cortes and Vapnik Citation1995). Details about the SVM training process as implemented in LIBSBM are explained in Chang and Lin (Citation2011). When training examples are imbalanced (i.e. one class has more examples than the other), the success of the SVM may be compromised (Akbani, Kwek, and Japkowicz Citation2004). In the present work, although the training data were imbalanced, very good results were obtained without taking any measures to cope with this.
To ensure that the method is not patient specific, test data always comes from patients other than that of the training data. Four groups of experiments were performed, each one partitioning the set of patients into patients for training and patients for test, as can be observed in column training patients in . All seizures and all 1-s windows of the test patients are used in each corresponding test. Their numbers are also indicated for each partition in the column training patients in .
Table 3. Experimental results
Results
presents the experimental results. The columns represent, in this order: the time windows duration, the patients used in the training (all the others were used in the test), the wavelet type, the SVM kernel employed, the classification accuracy, sensitivity, and specificity. For these last two measures, which require the specification of which samples are positive or negative, the epilepsy seizures and the PNES cases were considered, respectively, as being the positive samples and the negative samples. As can be observed in boldface in , there is a set of parameters which consistently achieved 100% accuracy for all the partitions. This set is composed of windows encompassing whole seizures, wavelet Coiflet 1, and SVM kernel sigmoid or RBF.
In the results obtained in the present work are compared to that of other works which aimed also to distinguish PNES from epileptic seizures. The columns represent, in this order: the research work, the techniques used there, the accuracy, the sensitivity, the specificity, the number of PNES examples, and the number of epilepsy examples.
Table 4. A best result from this work compared to results from other works whose objective was to distinguish PNES from epileptic seizures
Experiments have also been performed by assembling the vectors directly from the samples in the time domain, without using the Wavelet transform. In these experiments, the vectors features have been the samples averages, standard deviations, maximum and minimum values per channel per window. Their results have been inferior to that obtained using DWT and have not been explored further. The same happened with the experiments based on the SVM classifier with polynomial kernel.
Discussion
Machine learning techniques have been applied to different aspects of epilepsy treatment. These techniques are especially valuable for processing brain signals due to the ability of their computational algorithms to deal with noisy conditions (Acharya, Hagiwara, and Adeli Citation2018). Employing of machine learning to classify between PNES and ES can potentially improve the quality of life of PNES patients, since they are frequently treated with multiple drugs, causing delays in appropriate treatment (Bruni et al. Citation2017). The utilization of video-EEG (gold-standard diagnostic for PNES) is expensive, because it requires hospitalization, and moreover, it is unavailable in many hospital centers (Vasta et al. Citation2018). The use of machine learning can, thus, alleviate these issues, as well as help physicians to diagnose PNES.
In the present work, we applied a machine learning technique called SVM to differentiate patients with PNES from those with ES. To improve the differentiation between both classes, three types of SVM kernels were studied: linear, RBF, and sigmoid. Polynomial kernel was also tried but with unsatisfactory results. Other published studies have also employed SVM for identifying PNES, however there are crucial differences concerning the input signals applied to the classifier. For example: Gubbi et al. (Citation2016) used, as input, measures from accelerometers arrangement on patient muscles; Kusmakar et al. (Citation2015) utilized similar accelerometer signals combined with EMG measures; Ahmadi et al. (Citation2018) applied ICA to extract the features from EEG signals in sub-bands of its wavelet transform. Later, Ahmadi et al. (Citation2020) studied the EEG microstates and the functional brain neural network in several classifiers. None of these studies reached an accuracy greater than 95% in the PNES identification. In this work, we employed DWT decomposition of the EEG signals with Coiflet 1 and Daubechies 4 families as inputs to the SVM classifier. Gasparini et al. (Citation2018) also applied wavelet transform to extract features from EEG signals and reached an accuracy of 86% using Mexican hat as the mother wavelet. The literature survey performed shows that the best overall accuracy to differentiate PNES from ES was 97% (Pippa et al. Citation2017).
In , the results obtained for accuracy, sensitivity, and specificity are equal to 100% for the set of configuration parameters composed of windows encompassing whole seizures, wavelet Coiflet 1, and SVM kernel sigmoid or RBF. For the 1-sec windows group the results were also satisfactory, varying from 95% to 100%, depending on the wavelet type and SVM kernel.
In order to analyze the statistical reliability of the results presented, after having obtained them, their statistical relevance must be calculated. Normally, in binary classification problems, the results are presented also in the form of confusion matrices or in the form of ROC curves. But after comparing the different system configurations presented in , we concluded that the ideal configuration is that which uses windows encompassing whole seizures, Coiflet 1 wavelet in the extraction step and RBF or sigmoid kernel in the SVM. Therefore, for an ensuing practical application, this ideal configuration may be adopted and the others abandoned. And as indicated in (lines in boldface), for this ideal configuration, the accuracy, the sensitivity, and the specificity are always equal to 100%. In this scenario, confusion matrices and ROC curves become trivial, not bringing any additional information. But according to the law of large numbers (Papoulis Citation1991), it is possible to calculate a margin to the accuracy results obtained here as a function of the number of test samples used in the experiments. That law states that
where is an estimated parameter mean obtained from a sample containing
elements of a population,
is the true parameter mean (from the whole population) and
is a margin to the estimation. In this work, we attempt to estimate the true classifier accuracy using a limited set of test examples. Thus, the parameter
whose mean is being estimated is the success (equal to 1) or the failure (equal to 0) of the classifier when trying to determine if a test sample corresponds to an epileptic seizure or to a PNES, so
is here the reported accuracy for each experiment performed on
test examples.
Among the four partitions used in the experiments, the second one in is that which used more seizures as test examples, seizures. So statistically the results for this partition are the most conclusive. Adopting
in (1), one obtains
which means that the probability that the estimated accuracy is within from its true value is greater than 77%. Repeating this calculation using
, one obtains the result that the probability that the estimated accuracy is within
from its true value is greater than 53%.
Focusing attention now on the experiments using 1-s windows, still in the second partition, the number of test examples is 1-s windows. Now, for
, one obtains the result that the probability that the estimated accuracy is within
from its true value is greater than 99%. Narrowing
to 0.01, one verifies that the probability that the estimated accuracy is within
from its true value is greater than 62%. So although the results obtained using windows encompassing the whole seizures are apparently superior to that using 1-s windows, the latter are statistically more reliable due to the availability of much more test examples.
In this sense, it is important to consider that, whatever system is implemented, it is capable of being constantly updated with new data obtained from new patients, always improving its performance.
Unlike other studies related with epilepsy, our proposal is not patient specific. This means that our system may be applied to new patients admitted in a hospital center, even without having their previous EEG signals already collected. Thus, as can be seen, the present work has the advantages of not requiring the use of accelerometer nor electromyographic signals, not being patient specific, and also presenting very good results.
Disclosure Statement
No potential conflict of interest was reported by the author(s).
Additional information
Funding
References
- Acharya, U. R., Y. Hagiwara, and H. Adeli. 2018. Automated seizure prediction. Epilepsy & Behavior 88:251–614. doi:10.1016/j.yebeh.2018.09.030.
- Achilles, F., F. Tombari, V. Belagiannis, A. M. Loesch, S. Noachtar, and N. Navab. 2018. Convolutional neural networks for real-time epileptic seizure detection. Computer Methods in Biomechanics and Biomedical Engineering: Imaging & Visualization 6 (3):264–69.
- Ahmadi, N., E. Carrette, A. P. Aldenkamp, and M. Pechenizkiy. 2018. Finding predictive EEG complexity features for classification of epileptic and psychogenic nonepileptic seizures using imperialist competitive algorithm. In 2018 IEEE 31st International Symposium on Computer-Based Medical Systems (CBMS), Karlstad, Sweden, pp. 164–69. IEEE.
- Ahmadi, N., Y. Pei, E. Carrette, A. P. Aldenkamp, and M. Pechenizkiy. 2020. EEG-based classification of epilepsy and PNES: EEG microstate and functional brain network features. Brain Informatics 7 (1):1–22. doi:10.1186/s40708-020-00107-z.
- Akbani, R., S. Kwek, and N. Japkowicz. 2004. Applying support vector machines to imbalanced datasets. In European conference on machine learning, Pisa, Italy, pp. 39–50. Springer.
- Asadi-Pooya, A. A., J. Tinker, and E. W. Fletman. 2017. How variable are psychogenic nonepileptic seizures? A retrospective semiological study. Journal of the Neurological Sciences 377:85–87. doi:10.1016/j.jns.2017.03.054.
- Beniczky, S., I. Conradsen, R. Pressler, and P. Wolf. 2016. Quantitative analysis of surface electromyography: Biomarkers for convulsive seizures. Clinical Neurophysiology 127 (8):2900–07. doi:10.1016/j.clinph.2016.04.017.
- Bhardwaj, A., A. Tiwari, R. Krishna, and V. Varma. 2016. A novel genetic programming approach for epileptic seizure detection. Computer Methods and Programs in Biomedicine 124:2–18. doi:10.1016/j.cmpb.2015.10.001.
- Bolen, R. D., E. H. Koontz, and P. B. Pritchard III. 2016. Prevalence and distribution of MRI abnormalities in patients with psychogenic nonepileptic events. Epilepsy & Behavior 59:73–76. doi:10.1016/j.yebeh.2016.02.036.
- Bruni, A., I. Martino, G. Borz, A. Gambardella, P. De Fazio, and A. Labate. 2017. The mystery of unexplained traumatic sudden falls. a clinical case that adds a new feasible cause. Neurological Sciences 38 (6):1115–17. doi:10.1007/s10072-017-2843-7.
- Chang, -C.-C., and C.-J. Lin. 2011. LIBSVM: A library for support vector machines. ACM Transactions on Intelligent Systems and Technology 2 (27):1–27. 27.Software available at doi:10.1145/1961189.1961199.
- Cortes, C., and V. Vapnik. 1995. Support-vector networks. Machine Learning 20 (3):273–97. doi:10.1007/BF00994018.
- Duwicquet, C., B. de Toffol, P. Corcia, M. Bonnin, W. El-Hage, and J. Biberon. 2017. Are the clinical classifications for psychogenic nonepileptic seizures reliable?. Epilepsy & Behavior 77:53–57. doi:10.1016/j.yebeh.2017.09.013.
- Gandhi, T., B. K. Panigrahi, and S. Anand. 2011. A comparative study of wavelet families for EEG signal classification. Neurocomputing 74 (17):3051–57. doi:10.1016/j.neucom.2011.04.029.
- Gasparini, S., M. Campolo, C. Ieracitano, N. Mammone, E. Ferlazzo, C. Sueri, G. Tripodi, U. Aguglia, and F. Morabito. 2018. Information theoretic-based interpretation of a deep neural network approach in diagnosing psychogenic non-epileptic seizures. Entropy 20 (2):43. doi:10.3390/e20020043.
- Gubbi, J., S. Kusmakar, A. S. Rao, B. Yan, T. O’Brien, and M. Palaniswami. 2016. Automatic detection and classification of convulsive psychogenic nonepileptic seizures using a wearable device. IEEE Journal of Biomedical and Health Informatics 20 (4):1061–72. doi:10.1109/JBHI.2015.2446539.
- Guo, L., D. Rivero, J. Dorado, J. R. Rabunal, and A. Pazos. 2010. Automatic epileptic seizure detection in EEGs based on line length feature and artificial neural networks. Journal of Neuroscience Methods 191 (1):101–09. doi:10.1016/j.jneumeth.2010.05.020.
- Hassan, A. R., and A. Subasi. 2016. Automatic identification of epileptic seizures from EEG signals using linear programming boosting. Computer Methods and Programs in Biomedicine 136:65–77. doi:10.1016/j.cmpb.2016.08.013.
- Hassan, A. R., A. Subasi, and Y. Zhang. 2020. Epilepsy seizure detection using complete ensemble empirical mode decomposition with adaptive noise. Knowledge-Based Systems 191:105333. doi:10.1016/j.knosys.2019.105333.
- Hassan, A. R., and M. A. Haque. 2015. Epilepsy and seizure detection using statistical features in the complete ensemble empirical mode decomposition domain. In TENCON 2015-2015 IEEE region 10 conference, Macao, pp. 1–6. IEEE.
- Hassan, A. R., S. Siuly, and Y. Zhang. 2016. Epileptic seizure detection in EEG signals using tunable-q factor wavelet transform and bootstrap aggregating. Computer Methods and Programs in Biomedicine 137:247–59. doi:10.1016/j.cmpb.2016.09.008.
- Indiradevi, K., E. Elias, P. Sathidevi, S. D. Nayak, and K. Radhakrishnan. 2008. A multi-level wavelet approach for automatic detection of epileptic spikes in the electroencephalogram. Computers in Biology and Medicine 38 (7):805–16. doi:10.1016/j.compbiomed.2008.04.010.
- Kabir, E., S. Zhang, Y. Zhang . 2016. Epileptic seizure detection from EEG signals using logistic model trees. Brain Informatics 3 (2):93–100. doi:10.1007/s40708-015-0030-2.
- Kerr, W. T., E. A. Janio, C. T. Braesch, J. M. Le, J. M. Hori, A. B. Patel, S. E. Barritt, N. L. Gallardo, J. Bauirjan, A. M. Chau, et al. 2017. Diagnostic implications of review-of-systems questionnaires to differentiate epileptic seizures from psychogenic seizures. Epilepsy & Behavior 69:69–74. doi:10.1016/j.yebeh.2016.11.002.
- Kitano, L. A. S., M. A. A. Sousa, S. D. Santos, R. Pires, S. Thome-Souza, and A. B. Campo. 2018. Epileptic seizure prediction from EEG signals using unsupervised learning and a polling-based decision process. In International Conference on Artificial Neural Networks, Rhodes, Greece, pp. 117–26. Springer.
- Kusmakar, S., J. Gubbi, B. Yan, T. J. O’Brien, and M. Palaniswami. 2015. Classification of convulsive psychogenic non-epileptic seizures using muscle transforms obtained from accelerometry signal. In 2015 37th Annual International Conference of the IEEE Engineering in Medicineand Biology Society (EMBC), Milano, Italy, pp. 582–85. IEEE.
- Magaudda, A., A. Laganà, A. Calamuneri, T. Brizzi, C. Scalera, M. Beghi, C. M. Cornaggia, and G. Di Rosa. 2016. Validation of a novel classification model of psychogenic nonepileptic seizures by video-EEG analysis and a machine learning approach. Epilepsy & Behavior 60:197–201. doi:10.1016/j.yebeh.2016.03.031.
- Mallat, S. G. 1989. A theory for multiresolution signal decomposition: The wavelet representation. IEEE Transactions on Pattern Analysis and Machine Intelligence 7 (7):674–93. doi:10.1109/34.192463.
- Obermeyer, Z., and E. J. Emanuel. 2016. Predicting the future—big data, machine learning, and clinical medicine. The New England Journal of Medicine 375 (13):1216. doi:10.1056/NEJMp1606181.
- Papoulis, A. 1991. Probability, random variables, and stochastic processes. 3 ed. McGraw-Hill, Inc.
- Pippa, E., E. I. Zacharaki, I. Mporas, V. Tsirka, M. P. Richardson, M. Koutroumanidis, and V. Megalooikonomou. 2016. Improving classification of epileptic and non-epileptic EEG events by feature selection. Neurocomputing 171:576–85. doi:10.1016/j.neucom.2015.06.071.
- Pippa, E., E. I. Zacharaki, M. Koutroumanidis, and V. Megalooikonomou. 2017. Data fusion for paroxysmal events’ classification from eeg. Journal of Neuroscience Methods 275:55–65. New York, U.S.A. doi:10.1016/j.jneumeth.2016.10.004.
- Puspita, J., G. Soemarno, A. Jaya, and E. Soewono. 2017. Interictal epileptiform discharges (IEDs) classification in EEG data of epilepsy patients. In Journal of Physics: Conference Series, Volume 943, pp. 012030. IOP Publishing.
- Qaraqe, M., M. Ismail, E. Serpedin, and H. Zulfi. 2016. Epileptic seizure onset detection based on EEG and ECG data fusion. Epilepsy & Behavior 58:48–60. New Jersey, U.S.A. doi:10.1016/j.yebeh.2016.02.039.
- Rosado, A., and A. C. Rosa. 2016. Automatic detection of epileptiform discharges in the eeg. arXiv Preprint arXiv:1605.06708 2016.
- Santos, N. D. O., G. R. G. Benute, A. Santiago, P. E. Marchiori, and M. C. S. D. Lucia. 2014. Psychogenic non-epileptic seizures and psychoanalytical treatment: Results. Revista Da Associação Médica Brasileira 60 (6):577–84. doi:10.1590/1806-9282.60.06.018.
- Satapathy, S. K., A. K. Jagadev, and S. Dehuri. 2017. An empirical analysis of different machine learning techniques for classification of EEG signal to detect epileptic seizure. Informatica, an International Journal of Computing and Informatics 41:2017.
- Siddiqui, M. K., R. Morales-Menendez, X. Huang, and N. Hussain. 2020. A review of epileptic seizure detection using machine learning classifiers. Brain Informatics 7 (1):1–18. doi:10.1186/s40708-020-00105-1.
- Subasi, A., J. Kevric, and M. A. Canbaz. 2019. Epileptic seizure detection using hybrid machine learning methods. Neural Computing & Applications 31 (1):317–25. doi:10.1007/s00521-017-3003-y.
- Tian, X., Z. Deng, W. Ying, K.-S. Choi, D. Wu, B. Qin, J. Wang, H. Shen, and S. Wang. 2019. Deep multi-view feature learning for EEG-based epileptic seizure detection. IEEE Transactions on Neural Systems and Rehabilitation Engineering 27 (10):1962–72. doi:10.1109/TNSRE.2019.2940485.
- Tzallas, A. T., M. G. Tsipouras, and D. I. Fotiadis. 2009. Epileptic seizure detection in EEGs using time–frequency analysis. IEEE Transactions on Information Technology in Biomedicine 13 (5):703–10. doi:10.1109/TITB.2009.2017939.
- Upadhyay, R., P. Padhy, and P. Kankar. 2016. A comparative study of feature ranking techniques for epileptic seizure detection using wavelet transform. Computers & Electrical Engineering 53:163–76. doi:10.1016/j.compeleceng.2016.05.016.
- Varone, G., S. Gasparini, E. Ferlazzo, M. Ascoli, G. G. Tripodi, C. Zucco, B. Calabrese, M. Cannataro, and U. Aguglia. 2020. A comprehensive machine-learning-based software pipeline to classify EEG signals: A case study on PNES vs. control subjects. Sensors 20 (4):1235. doi:10.3390/s20041235.
- Vasta, R., A. Cerasa, A. Sarica, E. Bartolini, I. Martino, F. Mari, T. Metitieri, A. Quattrone, A. Gambardella, R. Guerrini, et al. 2018. The application of artificial intelligence to understand the pathophysiological basis of psychogenic nonepileptic seizures. Epilepsy & Behavior 87:167–72. doi:10.1016/j.yebeh.2018.09.008.
- Vidyaratne, L. S., and K. M. Iftekharuddin. 2017. Real-time epileptic seizure detection using eeg. IEEE Transactions on Neural Systems and Rehabilitation Engineering 25 (11):2146–56. doi:10.1109/TNSRE.2017.2697920.
- Wang, G., Z. Sun, R. Tao, K. Li, G. Bao, and X. Yan. 2015. Epileptic seizure detection based on partial directed coherence analysis. IEEE Journal of Biomedical and Health Informatics 20 (3):873–79. doi:10.1109/JBHI.2015.2424074.
- World Health Organization. 2020. Epilepsy. Accessed July 15, 2020. https://www.who.int/news-room/fact-sheets/detail/epilepsy
- Yuan, Q., W. Zhou, Y. Liu, and J. Wang. 2012. Epileptic seizure detection with linear and nonlinear features. Epilepsy & Behavior 24 (4):415–21. doi:10.1016/j.yebeh.2012.05.009.