
ABSTRACT
This study aims to identify telecom customer segments by utilizing machine learning and subsequently develop a web-based dashboard. The dashboard visualizes the cluster analysis based on demographics, behavior, and region features. The study applied analytic pipeline that involved five stages i.e. data generation, data pre-processing, data clustering, clusters analysis, and data visualization. Firstly, the customer’s dataset was generated using Faker Python package. Secondly was the pre-processing which includes the dimensionality reduction of the dataset using the PCA technique and finding the optimal number of clusters using the Elbow method. Unsupervised machine learning algorithm K-means was used to cluster the data, and these results were analyzed and labeled with labels and descriptions. Lastly, a dashboard was developed using Microsoft Power BI to visualize the clustering results in meaningful analysis. According to the results, four customer clusters were obtained. An interactive web-based dashboard called INSIGHT was developed to provide analysis of customer segments based on demographic, behavioral, and regional traits; and to devise customized query for deeper analysis. The correctness of the clustering results was evaluated and achieved a satisfactory Silhouette Score of 0.3853. Hence, the telecom could target their customers accurately based on their needs and preferences to increase service satisfaction.
Introduction
Md Isa et al. (Citation2020) reported that it is essential for the telecom industry to have a deep understanding of customer’s behavior in order to stay competitive and achieve financial gain especially in the mobile sector. The latest statistics show that there are about 7.71 billion mobile phone users in the world and 66.53% of the mobile phone users are smartphone users. In parallel with the development of mobile telecommunications that is increasing throughout the years, it is important for the telecom industry to understand the customer’s behavior and needs so that they can provide better services to their customers. Aheleroff (Citation2011) declared that the insufficient understanding of different customers and their various behavioral patterns increases the challenges to furnish the customers with satisfactory services, since the telecommunication companies cannot depend on price only to gain and retain customers; they must guarantee that customers are satisfied by providing customized services (Briganty Citation2019).
Particularly, telecommunication industry is considered to have extensive amount of customer data which is utilized in several ways. For example, customer data for churn prediction, acquiring customers and service personalization, as well as analyses of mobile user’s characteristics to develop different customer segments (Konopnicki and Shmueli-Scheuer Citation2013). However, the manual method of gathering, analyzing, and segmenting the massive amount of subscriber’s behavioral data is inefficient (Namvar, Ghazanfari, and Naderpour Citation2017). Consequently, mobile data analytics in the telecommunication market is used to assist marketers to enhance their understanding and knowledge of the customer. This is achieved by analyzing the data provided when customers use their phone, such as interests, preferences, and usage behavior. As a result, this leads to successful business and breaking through the barriers of marketing by targeting the right customer with the appropriate service (Dow Citation2013).
Customer segmentation is the partition of customers into groups of similar patterns and traits (Manero, Rimiru, and Otieno Citation2018). With the gradual growth in the telecommunication industry, the segmenting of customers is an effective process to assist in marketing and retention planning in order to keep up the leadership of the market (Zhang et al. Citation2016). Previously, the majority of industries were only concerned with demographic segmentation which is insufficient; hence, behavioral segmentation is essential as it gives more details on customers preferences and what are their activity patterns when interacting with a service or product (Deasi Citation2020). Machine learning techniques are useful to extract meaningful insights or patterns from the data by segmenting the customers (C. Kidd Citation2019). This project emphasizes on customer behavioral segmentation and analysis in telecom mobile analytics using machine learning by collaborating with a Malaysian mobile service provider.
The main objective of this paper is to construct a clustering model to segment telecom customers’ dataset and to analyze the results using an interactive web-based dashboard. Furthermore, the analysis of the clusters produced is based on three aspects, demographic, behavioral, and regional aspect of the telecom users.
The rest of this paper is organized as follows: Section 2 discusses the overview of the related studies, Section 3 explains in detail the methodology manipulated to implement the project. Next, Section 4 illustrates the results obtained and the evaluation of the algorithm implemented, it also demonstrates the developed dashboard that visualizes the clustering results analysis. Lastly, Section 5 provides some concluding remarks
Background study
Mobile behavioral analytics and behavioral segmentation
There is a vital number of research papers which have studied customer’s behavioral segmentation in various domains and industries such as the telecommunication market. Additionally, different approaches and methodologies have been manipulated to segment customer’s data and extract useful insights.
Tabb (Citation2019) stated that mobile behavioral analytics reveals new insights into the behavior of users on mobile phones. Behavioral analytics utilizes the massive volumes of users’ event data captured during sessions in which users use an application, game, or website. One important area in analyzing mobile user behaviors is advancing with more meaningful and effective customer segments for businesses. Ezenkwu, Ozuomba, and Kalu (Citation2015) defined that the segmentation process refers to the division of market or customers into groups called segments, where each customer segment shares similar traits.
Segmentation is implemented in several businesses using various methods and algorithms to overcome the limitation of understanding customers and eventually increase company’s profitability, decrease functional cost, and improve customer’s services as mentioned from (Ezenkwu, Ozuomba, and Kalu Citation2015). Segmentation techniques using machine learning are discussed in the following sections.
Segmentation techniques
Hamka et al. (Citation2014) proposed that data mining techniques such as clustering are proven to be very efficient in revealing insights hidden within a dataset. In this section three significant techniques will be briefly explained, which are K-means, Kohonen Self Organizing Map (SOM) and the Recency, Frequency and Monetary (RFM) Model which is a complementary technique used with clustering algorithms (e.g., K-means) to provide advanced analysis about customers.
Firstly, Hagen et al. (Citation2020) pointed out that K-means is one of the most popular and simple clustering algorithms used in numerous domains. It is described as an iterative algorithm and approach for categorizing unlabeled data into K unique clusters. K-means requires the number of clusters to be initiated in advance, then the algorithm defines the clusters based on the minimal variation of each data point from its centroid and other centroids.
Secondly, Hanafizadeh and Mirzazadeh (Citation2011) outlined that Kohonen SOM was introduced by in 1981 and the algorithm is used in various engineering fields. It is further explained that SOM basis is that high-dimensional spaces are mapped into spaces with two or three-dimensions, such that information loss is minimized, and hidden information is able to be shown and discovered. Zhang et al., (Citation2016) explained SOM as a two layered neural network, which are the input and output layers. Information is represented as weight vectors and are transmitted from the input layer to the output layer that consists of competed neurons, and the resultant output is based on self-organizing mechanism.
The RFM model defined three attributes as follows: Recency is how recent a customer has purchased the product, Frequency is how frequent a customer purchased the product and Monetary is how much money is spent by a customer during a purchase. Tavakoli et al., (Citation2018) noted that the RFM model promotes an efficient analysis for making marketing decisions to target the right customers and generate suitable strategies based on customer’s purchasing behavior. RFM analysis represents a behavioral-based model that captures customer’s profiles by means of their recency, frequency and monetary values that measures customer’s buying behavior whether it is continuous over time. (Citation2018) stated that a scoring method is generated to evaluate the scores of the three variables stated. Furthermore, the score values are used to develop a customer segmentation model that is used in any clustering algorithm such as K-means algorithm.
Related works
This section describes four studies which have adopted machine learning to segment telecommunication customers by emphasizing on their behavioral usage as well as revenue.
Ghnemat and Jaser (Citation2015) conducted a study that uses Kohonen Self Organizing Map (SOM) to perform customer segmentation in mobile telecommunication industry manipulating an excessive sample of customer’s mobile usage data acquired from a significant mobile operator in Jordan. the study was performed using a data set describing customer’s behavioral profiles containing 6315 customers; furthermore, each profile compromises of 10 attributes which represents voice and data usage (e.g., calling behavior). Accordingly, SOM technique was implemented to cluster customers based on the stated attributes. The results were 6 segments of unique labels and descriptions.
Another study in Kenya telecom was conducted in 2018 to segment the customer’s behavioral data using K-means algorithm as well as Principle Component Analysis (PCA) technique. The study has utilized the customer’s call detail record to come up with a segmentation model based on the customer’s lifecycle. The model generated considered the customer’s past contribution, potential value and churn probability. Eventually, Manero, Rimiru, and Otieno (Citation2018) showed that the loyalty of different customer segments is clearly provided to facilitate effective decision-making and strategic planning.
Sujah and Rathnayaka (Citation2019) have performed K-means and Artificial Neural Networks (ANN) approaches to categorize 10,000 telecom customers based on their behavioral patterns which involved 15 attributes. The study attempts to label the clusters based on their profitability level, for example, high, average, and low profitable customers. Eventually, the study has obtained 6 clusters using K-means that will advance service providers to introduce promotions to the lowest profitable cluster to ensure its retention.
Lastly, Anitha and Patil (Citation2019) conducted customer segmentation based on purchase behavior. To illustrate that, the RFM analysis was executed after data pre-processing that is to examine the recent purchases, frequency, and amount spent by customers. As a result, every customer was scored based on the three factors. Following that, K-means algorithm was implemented twice, that is to segment customers based on amount spent with recent purchases and also amount spent based on frequent transactions. The study evaluated K using the Silhouette score as 3 and 5, and the result showed that 3 was the optimal number of clusters.
The four related studies are compared in terms of various criteria, which are the study objective, the type of customer data used, technique implemented, number of records, and the results. The comparison is presented in .
Table 1. Related works comparison
Methodology
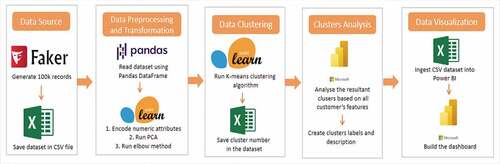
In this section, the end-to-end process is explained five main stages as follows: data source, data pre-processing, and transformation, data clustering, clusters analysis, and data visualization. The methodology is shown in . Each of the stages is discussed in detail in the following subsections.
Figure 1. The stages in the methodology.
Data source
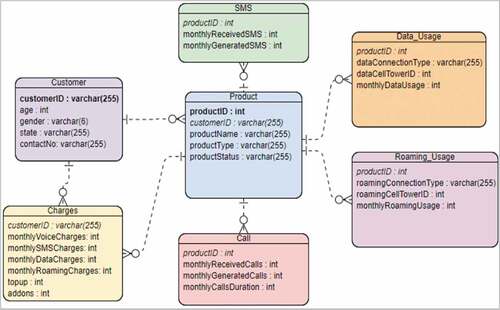
The initial stage was the generation of the telecom customer’s dataset based on the data model agreed with the research’s collaborator which is a telecom company in Malaysia. The company was unable to provide an actual customer’s dataset due to customer data confidentiality. The data model using ER diagram has seven entities and each of the entity has its attributes as illustrated in . Then, Faker package 4.4.0 is used for generating the dataset, and the code is executed in PyCharm IDE.
Figure 2. Telecom customer data model.
The dataset involved 100 K records which was practicable to provide reasonable results and to form the clustering model. The data sample was aligned with the company realistic data which makes the data well distributed and built based on the realistic data. For instance, the products names and types were generated according to the company’s offered products, and the customer’s behavioral usage was according to the services provided by the company. Then, the dataset was written into a CSV file using Pandas 1.1.2 DataFrame. Nevertheless, the K-means algorithm is only capable of handling a single CSV file. Thus, all entities in the data model were transformed into one flat file to fit into the clustering model.
Dataset pre-processing and transformation
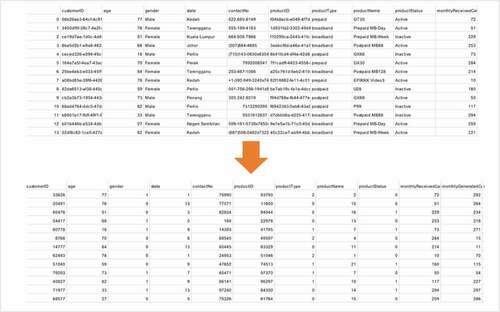
In this stage, the encoding of the dataset was firstly performed, which refers to transforming all categorical attributes into numeric (e.g., gender, state, product_name, product_type, etc.) as shown in the comparison in . The transformation is required for the purpose of data clustering using K-Means in the following stage. The Pandas library was used to execute the encoding. For example, the product types involve prepaid, postpaid, and broadband, during encoding the numbers 0, 1 and 2 were assigned to every product type and the same applies for other categorical data.
Figure 3. Telecom customers dataset before and after encoding.
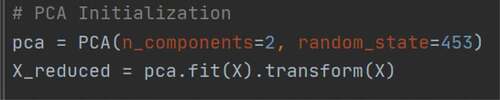
Lastly, the encoded dataset was written into another CSV file using Pandas DataFrame. Next, the PCA technique was implemented to reduce the dataset dimensionality. Manero, Rimiru, and Otieno (Citation2018) illustrated the concept behind PCA is converting a dataset into a new one consisting of linearly independent variables, known as Principle Components. In addition, each component in the set attempts to take as much variance as possible from the data. Eriksson (Citation2020) further described that the Principle Components are generated by utilizing and finding the variance or spread of every variable and also the correlation between variables in the original dataset. Our dataset consists of 26 features that are complicated and will negatively impact the clustering algorithm performance. Therefore, the number of principal components selected was 2 as shown in , that is to plot the data points in a two-dimensional graph.
Figure 4. PCA implementation code snippet.
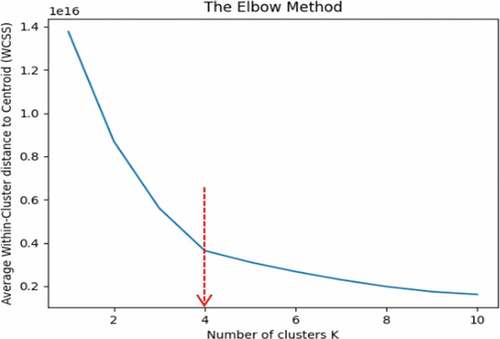
Subsequently, the optimal number of clusters was determined by using the Elbow Method and computing the Within Cluster Sum of Squares (WCSS) score. Cui (Citation2020) mentioned the WCSS variable or score, which computes the difference within every cluster where the lower the WCSS value the more effective clustering. Cui also stated that with the increase of the number of K, the WCSS score will decrease, and K is selected on the decrease point which is viewed as an “elbow” in the curve. The implementation of the Elbow method is shown in code snippet. The results of the Elbow method indicate that the optimal number of K is four as shown in the graph in where the elbow is pointing at the number 4. Hence, the K-means algorithm considered four as the K number.
Figure 5. The Elbow method code snippet.
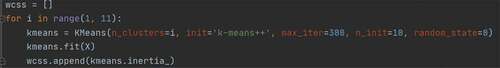
Figure 6. The Elbow method result.
Data clustering
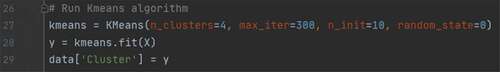
In this stage, K-means clustering algorithm was executed using the Scikit-learn machine learning Python library. Several steps of the algorithm are as follows (refers ):
Specify the number of clusters based on Elbow method result.
Initialize K as the centroids randomly.
Calculate the Euclidean distance of every data point from every centroid in the space.
Allocate every data point to the nearest centroid based on the calculated distance.
Iterate until centroids and data points remain the same and fixed.
Figure 7. Code snippet of K-means model initialization.
Clusters analysis
The clusters were analyzed to understand the traits in each cluster. This process was executed by visualizing the trends between all the customer’s features for every segment by using Microsoft Power BI. The segments were analyzed first prior labeling. The analysis involved the following:
Demographic Analysis: covered analyzing what age group and gender are dominant in every segment. Besides, the population of customers in every segment in all 14 Malaysian states is analyzed.
Revenue analysis: covered analyzing which segment contributes the highest revenue in what service (e.g., voice calls, SMS, mobile data etc.).
Product subscription analysis: included identifying the top segment subscribing for every product named in the dataset.
Behavioral analysis: a detailed analysis of every behavioral usage trait in the dataset (e.g., monthly average voice calls usage, monthly average SMS usage, monthly average data usage and monthly average roaming usage). It involves listing down the segment having the highest average usage for all the behavioral traits mentioned.
Next, the significant trait or feature in every segment is listed and compared to other segments. This process is intended to label the segments by extracting the unique attributes in every segment and to distinguish it from other segments.
Data visualization
The clustering results obtained were visualized into an interactive web-based dashboard called INSIGHT that is developed using Power BI tool by Microsoft. Power BI is a business intelligence and analytics suite used for analyzing, reporting and visualizing numerous data types to generate insights and reports which can be embedded in a website to assist organizations in the business (Power Power BI with Stitch: Analyze all your data sources today Citation2020).
Firstly, the final dataset result (i.e., including the “Cluster” label column) of telecom customers is stored to Azure cloud database of Power BI. Subsequently, a dashboard is designed and categorized into four modules namely segments demographic analysis, segments behavioral analysis, segments regional analysis, and customized dataset query. The dashboard displayed valuable information to analyze the customers insights.
Results & evaluation
In this section, the results obtained from the K-means algorithm implementation are illustrated and explained including evaluation of the algorithm. Besides, the system development is described in terms of the design and analysis features.
Segmentation results
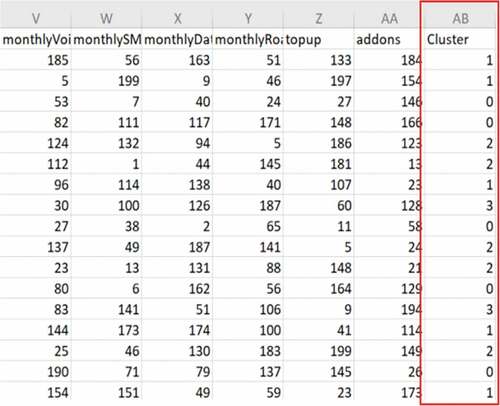
As elaborated in the previous section, K-means algorithm was run to produce 4 clusters as obtained from the elbow method results. After initializing the K-means model and running the algorithm, the result was a column ‘Cluster’ added to the data table to indicate every row belongs to which cluster (refer ). The file containing the ‘Cluster’ label was used in the data visualization step.
Figure 8. Appended dataset with the column “Cluster.”
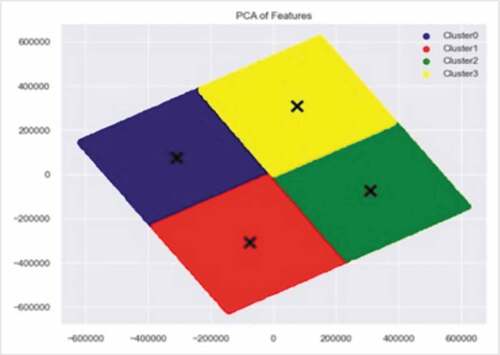
Apart from that, the data points and centroids (i.e., the K) were plotted in order to visualize the uniqueness of the clusters and the centroids as shown in .
Figure 9. Customer data points in the centroids plot.
Finally, the customer segments were labeled as Passive Users, Moderate Users, Communications Users and International Users based on the clusters analysis process conducted (refer section 3.4). The labels used are based on Ghnemat and Jaser (Citation2015) which depends on the characteristics and traits of customer’s behavioral usage. The user labels are described in .
Table 2. Telecom costumer segments label and description
Algorithm correctness
In this project, the quality and correctness of the K-means clustering algorithm results is evaluated using the Silhouette Score from the Scikit-learn machine learning library as shown in the code snippet in . Kumar (Citation2020) stated that two distances are computed to find the Silhouette score which are:
The mean distance between a specified data point and all other data points within the same cluster (also known as mean intra-cluster distance).
The mean distance between a specified data point and all other data points in the nearest cluster (also known as, mean nearest-cluster distance).
Figure 10. Implementation of the silhouette score.
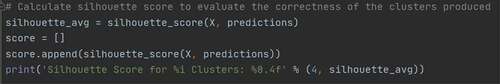
The score obtained was 0.3853 which indicates that the clusters are well distinguishable, and each is having its own significant customer traits. According to Bhardwaj (Citation2020) the Silhouette score output ranges from −1 to 1 and can be interpreted as follows:
1: The clusters are dense, clearly differentiated and well-separated.
0: The clusters are having an insignificant difference and are overlapping.
-1: The clusters are wrong and the samples might have got assigned.
The dashboard
Architecture and design
INSIGHT is a web-based interactive dashboard build for the industry collaborator, a telecom company in Malaysia. The dashboard aims to promote an efficient tool for analyzing the telecom customer’s segments and behavioral data. It advances the telecom industry with deep understanding and valuable insights of their customers to enhance their services and decision-making. demonstrates the conceptual architectural of the dashboard to describes the logical flow between the main components involved.
Figure 11. INSIGHT conceptual architecture.
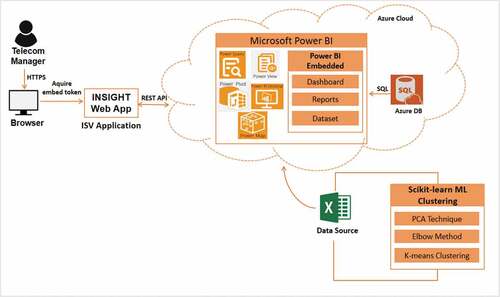
The website is accessed using HTTPS from the Browser by the client (i.e., telecom manager). INSIGHT website is an Independent Software Vendor (ISV) cloud client that integrated with the Microsoft Power BI by acquiring an embed token. The dashboard embedded on the INSIGHT is part of the Power BI Embedded. The data represented on the website is stored and retrieved from Azure SQL Database. The content data in the cloud is originally sourced from an external CSV file. The file consists of the labeled telecom customers segments.
The dashboard consists of four main sections which are described as follows:
Segments Demographic Analysis: provides analysis of the telecom customer’s segments based on their age, gender and state of residency. In addition, the revenue contributed by every segment is analyzed for various services.
Segments behavioral Analysis: provides analysis of the telecom customer’s segments based on their behavioral usage. For instance, the monthly average usage of voice calls, SMS, data and roaming.
Segments Regional Analysis: provides analysis of the telecom customer’s segments based on the state they reside, also in accordance with the demographics and connection type used.
Customized Dataset Query (Analysis of entire dataset): enables the user to customize the dataset by filtering the preferred customer’s traits (e.g., age, gender, and different behavioral usage), that is to narrow down the dataset and only view the interesting data patterns, which facilitates advanced analysis of smaller groups of customers.
INSIGHT dashboard user interface
In this section, six screenshots from every section in the dashboard are depicted in the figures below. The figures illustrate the significant graphs in each section, such as the revenue analysis, mobile data and roaming usage, connection types, regional analysis, and finally the customization of the behavior of users in using mobile data and roaming.
Firstly, the revenue analysis of the telecom customers is shown in . The monthly average charges spent on different Telecom services is shown in the area chart for the four clusters. The service charges involve voice charges, SMS charges, data charges, roaming charges, addons, and top up. The table under the chart shows a clearer summary of the average monthly revenue obtained from the four segments including monthly voice charges, monthly SMS charges etc.
Figure 12. Clusters revenue analysis based on various services spending.

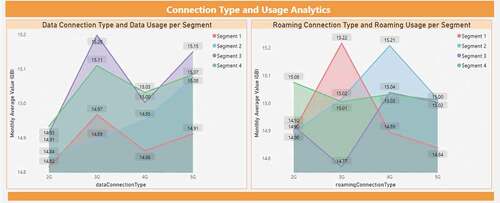
The clusters behavioral monthly usage is shown in . First of all, shows a line chart trends comparison of the monthly average GB used by every cluster for mobile data and roaming. Next, highlights the monthly average GB usage of the four clusters based on the connection type used (e.g. 2 G, 3 G, 4 G, and 5 G).
Figure 13. Analysis of the difference in monthly GB usage of mobile data and roaming per cluster.
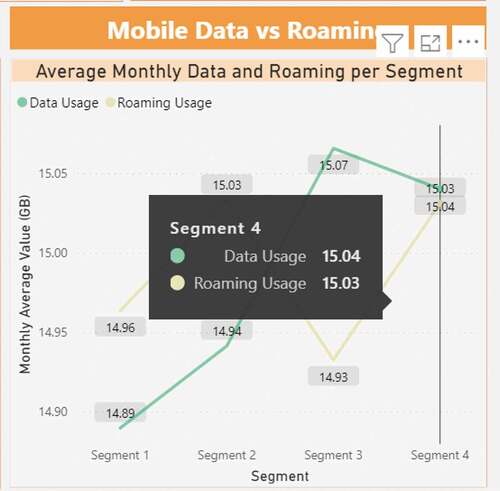
Figure 14. Analysis of the monthly GB usage of mobile data and roaming based on the different connection types used per cluster.
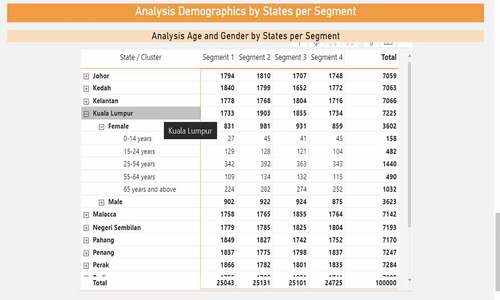
In regard to the clusters regional analysis, the dashboard provides the Malaysian map which demonstrates a pie chart in every state indicating the total number of customers for every cluster residing in that specified state (refer ). Moreover, the regional aspect is also analyzed in relation to the customers demographics. For example, presents a table that consists of the 14 Malaysian states and every state could be extended to display the demographic traits such as age and gender. The table will display the number of customers in every segment residing in the selected state and having the demographics that are interesting to look at.
Figure 15. Analysis of number of customers per cluster in the Malaysian states.
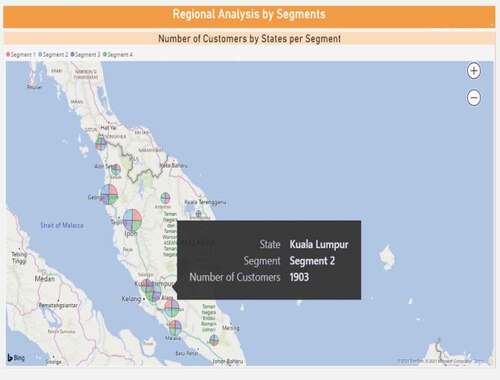
Figure 16. Analysis of customer demographics based on their region.
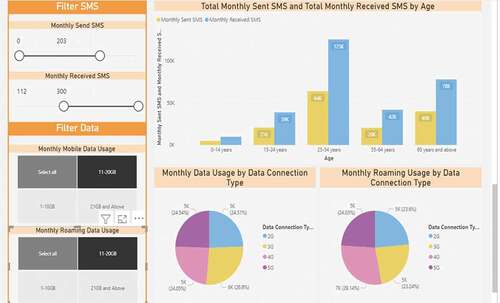
Finally, illustrates a partition from the customized dataset feature that enables users to customize charts based on the preferred selected traits in the filters side on the right. This section shows the customized charts of the total monthly sent and received SMS by the age of customers. In addition, the monthly data and roaming usage is shown based on connection type.
Figure 17. Partition of the filters in this section and the customized charts.
Conclusion
In conclusion, this paper has utilized machine learning approach (K-Means) to cluster telecom customers mobile behavioral data into meaningful and labeled segments. Subsequently, INSIGHT an interactive web-based dashboard has been developed to assist telecom managers to understand customers and advance their business decisions. INSIGHT providing four useful analysis to all stakeholders, that is Segments Demographic Analysis, Segments behavioral Analysis, Segments Regional Analysis, and Customized Query.
The future works to be considered include the following:
The mobile applications usage of telecom customers trait could be added to the dataset schema. That is to widen the customer’s behavioral scope and drill-down into what applications they are interested in.
Increase the number of telecom customers records up to a million, in order to observe the performance of the K-means algorithm and see how the clusters will be resultant.
Perform churn prediction using machine learning approach in order to identify or predict which segment has a high or low churn probability.
Acknowledgement
We would like to express our immense thanks and gratitude to Dr. Chew Yew Choong from Umobile company in Malaysia, for encouraging us and his continuous assistance. We would also like to thank the university’s support in the student-industry project collaboration.
Disclosure Statement
No potential conflict of interest was reported by the author(s).
References
- Aheleroff, S. (2011). Customer segmentation for a mobile telecommunications company based on service usage behavior. Retrieved from https://www.researchgate.net/publication/254014721
- Anitha, P., and M. M. Patil. (2019). RFM model for customer purchase behavior using K-Means algorithm. Journal of King Saud University - Computer and Information Sciences. doi:10.1016/j.jksuci.2019.12.011.
- Bhardwaj, A. (2020). Silhouette coefficient - towards data science. Medium. https://towardsdatascience.com/silhouette-coefficient-validating-clustering-techniques-e976bb81d10c
- Briganty, C. (2019). How telecommunications operators can increase customer satisfaction. Retrieved November 22, 2020, from https://www.intraway.com/blog/white-paper/Telecommunications-Customer-Satisfaction
- Christy A Joy, A. Umamakeswari, L. Priyatharsini, and A. Neyaa (2018). RFM ranking – An effective approach to customer segmentation. Journal of King Saud University - Computer and Information Sciences, 33(10), 1251–799. 10.1016/j.jksuci.2018.09.004
- Cui, M. (2020). Introduction to the K-means clustering algorithm based on the elbow method. Accounting, Auditing and Finance 7. doi:10.23977/accaf.2020.010102.
- Deasi, G. (2020). 10 powerful behavioral segmentation methods to understand your customers. Pointillist. https://www.pointillist.com/blog/behavioral-segmentation/
- Dow, C. (2013). Mobile Marketing and the Value of Customer Analytics. International Journal of Mobile Marketing (IJMM). Retrieved from https://www.mmaglobal.com/files/vol8no1/IJMM-Summer-2013.pdf#page=118
- Eriksson, L. (2020). What is principal component analysis (PCA) and how it is used? Umetrics. Retrieved from https://blog.umetrics.com/what-is-principal-component-analysis-pca-and-how-it-is-used
- Ezenkwu, C., S. Ozuomba, and C. Kalu. (2015). Application of K-means algorithm for efficient customer segmentation: A strategy for targeted customer services. International Journal of Advanced Research in Artificial Intelligence 4:10. doi:10.14569/ijarai.2015.041007.
- Ghnemat, R., and E. Jaser. (2015). Classification of mobile customers behavior and usage patterns using self-organizing neural networks. International Journal of Interactive Mobile Technologies (IJIM) 9 (4):4. doi:10.3991/ijim.v9i4.4392.
- Hagen, L., K. Uetake, N. Yang, B. Bollinger, A. J. B. Chaney, D. Dzyabura, J. Etkin, A. Goldfarb, L. Liu, K. Sudhir, et al. 2020. How can machine learning aid behavioral marketing research? Marketing Letters 31 (4):361–70. doi:10.1007/s11002-020-09535-7.
- Hamka, F., H. Bouwman, M. de Reuver, and M. Kroesen. 2014. Mobile customer segmentation based on smartphone measurement. Telematics and Informatics 31 (2):220–27. doi:10.1016/j.tele.2013.08.006.
- Hanafizadeh, P., and M. Mirzazadeh. (2011). Visualizing market segmentation using self-organizing maps and Fuzzy Delphi method – ADSL market of a telecommunication company. Expert Systems with Applications 38 (1):198–205. doi:10.1016/j.eswa.2010.06.045.
- Kidd, C., “Deep Learning vs Machine Learning,” bmcblogs, 2019. Retrieved from https://www.bmc.com/blogs/deep-learning-vs-machine-learning/#:~:text=Choosing%20between%20the%20two,intelligent%20decisions%20on%20its%20own.
- Konopnicki, D., and M. Shmueli-Scheuer. (2013). Customer analyst for the telecom industry. Large-Scale Data Analytics 101–27. doi:10.1007/978-1-4614-9242-9_4.
- Kumar, A. (2020). KMeans silhouette score explained with python example. Dzone.Com. https://dzone.com/articles/kmeans-silhouette-score-explained-with-python-exam
- Manero, K. M., R. Rimiru, and C. Otieno. (2018). Customer behavior segmentation among mobile service providers in Kenya using K-means algorithm. International Journal of Computer Science Issues (IJCSI) . 15 (5):67–76. doi:10.5281/zenodo.1467663.
- Md Isa, M., M. Mohamad Sabri, M. Ariff Noh, Z. Zaharum, and R. A Latif. 2020. The adoption of mobile banking application among muslim senior citizens in Selangor, Malaysia. Asian Journal of Research in Business and Management 2 (2):43–51.
- Namvar, A., M. Ghazanfari, and M. Naderpour. (2017). A customer segmentation framework for targeted marketing in telecommunication. 2017 12th International Conference on Intelligent Systems and Knowledge Engineering (ISKE), Nanjing, China. doi: 10.1109/iske.2017.8258803
- Power Power BI with Stitch: Analyze all your data sources today. (2020). Stitch. https://www.stitchdata.com/analysis-tools/powerbi/
- Sujah, A., and R. M. Rathnayaka. 2019. Telecommunication customer categorization with novel data mining approach for effective communication and increase profitability. IOSR Journal of Computer Engineering (IOSR-JCE). vol. 21. 55–66. doi:10.9790/0661-2105015566.
- Tavakoli, M., M. Molavi, V. Masoumi, M. Mobini, S. Etemad, R. Rahmani, et al. 2018, Customer Segmentation and Strategy Development Based on User Behavior Analysis, RFM Model and Data Mining Techniques: A Case Study. 2018 IEEE 15th International Conference on e-Business Engineering (ICEBE) 119–126 doi:10.1109/ICEBE.2018.00027
- Tabb, E. (2019). Introducing automatic segmentation. Retrieved 2020, from https://mixpanel.com/blog/introducing-automatic-segmentation/
- Zhang, T., X. Cheng, M. Yuan, L. Xu, C. Cheng, and K. Chao (2016). Mining target users for mobile advertising based on telecom big data. 2016 16th International Symposium on Communications and Information Technologies (ISCIT), United States. doi:10.1109/iscit.2016.7751639