
ABSTRACT
This work presents an indoor/outdoor classification system which uses light measurements coupled with machine learning algorithms to predict whether the sensing system is indoors or outdoors. The system measures ultraviolet light, color temperature, luminosity, and red, green, blue, and clear components of light at one-minute intervals using an Arduino-based measurement system. Three machine learning algorithms – support vector machine, artificial neural network, and bagged tree – were trained and tested using experimentally collected sensor data from multiple locations, dates, and times. A comparison of these classifiers revealed superior classification performance of the bagged tree classifier (>99%) compared to the other two algorithms. Each of the presented classifiers offered high estimation performance (>96.9%) in all the considered cases with cross-validation. These results demonstrate the feasibility of using light measurements alone to predict indoor or outdoor condition, which has practical applications in psychology research.
Introduction
The amount of time a person spends outdoors has been linked to greater overall happiness (MacKerron and Mourato Citation2013), lower stress levels (Hartig et al. Citation2003; Thompson et al. Citation2012), lower mortality and disease rates (Maas et al. Citation2009), as well as lower anger, violence, and aggression (Kuo and Sullivan Citation2001). However, the benefits of exposure to natural environments are often confounded with those of physical activity that happens in these contexts. For instance, research on youth activity and well-being (Cleland et al. Citation2008; Schaefer et al. Citation2014), indicated that negative outcomes and decreased physical activity were often attributed to, e.g., increased screen time rather than decreased outdoor exposure (e.g., Hofferth and Sandberg Citation2001; Burdette and Whitaker Citation2005). Additionally, several lines of research have indicated that physical activity and exposure to natural environments can independently promote positive health effects (Frumkin Citation2001; St Leger Citation2003). Even if not wholly independent, outdoor activities can be used to promote physical activity (McCurdy et al. Citation2010), thus evincing a synergistic effect on health. Therefore, outdoor exposure measurements may be diagnostic and have practical application for several areas of psychological research.
Some research has attempted to objectively quantify the time spent outdoors using Global Positioning System (GPS) measurements for different populations, including preschool children (Tandon et al. Citation2013), school-aged children (Klinker et al. Citation2014) and older adults (Kerr et al. Citation2012). While GPS sensors can offer a reasonable estimate of when a user is outdoors due to location estimates, this approach requires the use of known location maps that entail significant computational complexity and requires pre-planning of a study region. Additionally, GPS use can suffer from issues related to location boundary definitions (e.g., locations near buildings) as well as potential outages, particularly in urban locations. Devices containing GPS sensors also tend to be more expensive than those without GPS capability, which could be cost prohibitive for studying large populations. Therefore, an alternative sensing system which is less costly and does not rely on external satellites or location maps would be beneficial to quantify outdoor time.
Several alternatives to GPS have been investigated for indoor/outdoor classification. Unfortunately, these alternatives each suffer from unique limitations or constraints that restrict their applicability to research. For example, temperature measurements and probabilistic models of regional climate patterns have been used to predict whether a device is inside or outside (Krumm and Hariharan Citation2004). Unfortunately, this method requires a web service for determining outside temperatures or an outside thermometer for reference. Additionally, this reflects an inferential measure upon which classification is determined, which may not be applicable in all situations.
Similar approaches have attempted to capitalize on smart phones and their existing onboard sensors, e.g., accelerometers, proximity sensors, light sensors, magnetometers, etc. For instance, machine learning algorithms (e.g., IODetector) have been shown to be successful at making indoor/outdoor classifications based on, e.g., cell signal strength (e.g., Ali, ElBatt, and Youssef Citation2018; Li et al. Citation2014; Radu et al. Citation2014; Wang et al. Citation2016; Zhou et al. Citation2012), GPS (e.g., Zeng et al. Citation2018), ultrasonic sensors (Bisio, Delfino, and Lavagetto Citation2015), or Bluetooth (Zou et al. Citation2016). While these methods have the advantages of not requiring additional, expensive sensor equipment and conserving battery life (relative to relying on GPS), they are still quite limited. In particular, they still rely on outside signal information to infer whether the device in indoors or outdoors, i.e., communications with cell phone towers or Bluetooth beacons is required. This is compounded by the fact that signal information may be blocked or degraded due to being carried in a pocket or bag. Finally, some information may simply be inaccurate if users leave their phone in an indoor location while engaging in, e.g., high intensity outdoor activities or activities in environments that could damage their phone, such as swimming.
Here, we introduce an indoor and outdoor classification system that relies solely on light measurements. Specifically, this work assesses Ultraviolet (UV) index, luminosity, color temperature, and red, green, blue, and clear components of light. These measurements are used within machine learning algorithms to determine a classification of location. Some work has measured the UV exposure of preschool children to analyze health benefits (Boldemann et al. Citation2006), but this information was not used for classification purposes. This work therefore presents a novel wearable sensor system that can be used to classify whether a person is indoors or outdoors based only on local light measurements. Importantly, it addresses two of the major limitations outlined above. First, it does not require any external communication signal information, e.g. GPS, cell signal strength, Bluetooth, Wi-Fi, etc. Rather it makes a classification based directly on ambient environmental information. Second, this system consists of relatively low-cost sensors and therefore can be used to study the amount of time spent indoors and outdoors in larger samples.
This work builds upon our previously published article which fully details the hardware development for this project as well as some classification results from the individual measurements using Receiver Operating Characteristic (ROC) curve analysis and preliminary Artificial Neural Network (ANN) results (Rhudy, Greenauer, and Mello Citation2020). ROC analysis was also presented for light intensity in a previous study for indoor versus outdoor location, but the classification accuracy was limited (Tandon et al. Citation2013). Some improvement of this method was shown in another study using only the light intensity measurement (Flynn et al. Citation2014). Another group of researchers expanded upon these ideas to investigate UV index and number of steps in addition to the light intensity through both ROC analysis as well as SVM (Ye et al. Citation2019). Our work continues to expand upon these ideas by incorporating additional light measurements as well as investigating alternative machine learning techniques for this application.
The remainder of this paper is organized as follows. Section 2 presents the materials and protocol used to collect data for this study as well as the machine learning techniques for developing classifiers for the data. The results are presented in Section 3. Section 4 offers some discussion of the results, followed by conclusions in Section 5.
Methods
Materials
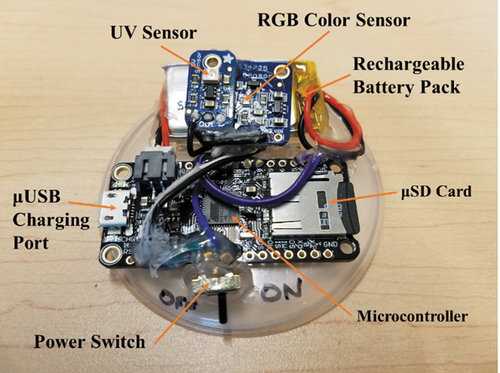
The experimental setup for this project consists of a microcontroller which samples data from two different light sensors approximately once per minute and stores the data on a microSD card. The microcontroller is an Adafruit Feather 32u4 Adalogger (New York, NY), which has a built-in microSD card slot and can be used with a rechargeable 3.7 V lithium ion battery. A 350 mAh battery (Adafruit Industries, New York, NY) was selected for this study based on a compromise of size and capacity. The first light sensor is an RGB sensor, TCS34725 (Adafruit Industries, New York, NY), which measures color temperature, luminosity, and red, green, blue, and clear components of light. The RGB sensor uses I2C communication to send data to the microcontroller. A second sensor, the GUVA-S12SD (Adafruit Industries, New York, NY), is used to obtain a measurement of the UV index from an analog voltage measurement. This sensor captures the 240–370 nm range of light, which covers UVB and most of the UVA spectrum. presents a diagram detailing the overall data acquisition system. Additionally, a labeled diagram of the prototype data acquisition system is shown in .
Figure 1. Diagram of the data acquisition system showing the various components and pin connections.
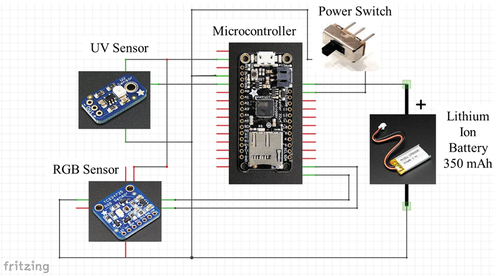
Figure 2. Picture of data acquisition system prototype with key components labeled.
Protocol
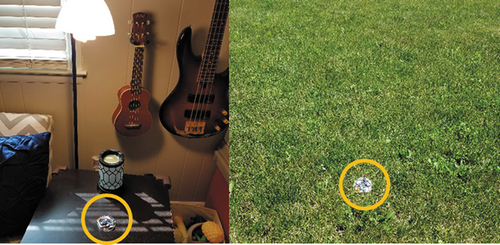
Data were collected by placing the sensor package in a static location for a period of time ranging from 25 minutes to 43 hours and 43 minutes (Mean = 2 hours and 55 min, SD = 8 hours and 3 minutes). These locations fell into two categories: indoor and outdoor. A total of 29 data sets were collected which varied in location, time of day, time of year, and weather condition. The data sets were then split into minute-by-minute samples by category. This resulted in a total of 3640 indoor and 1368 outdoor samples. The larger number of indoor samples was primarily due to convenience sampling based on weather and time constraints of obtaining outdoor measurements. Each sample consists of seven metrics: UV index, color temperature, luminosity, and red, green, blue, and clear components of light. displays examples of indoor (left, under lamp on table), and outdoor (right, in middle of grass) testing locations. contains the full description of all collected data sets. Most of the data described in were collected in the general area of Reading, Pa USA. However, the last three data files were collected in Egypt, Africa, to explore regional differences.
Table 1. Description of data sets
Figure 3. Example indoor (left) and outdoor (right) testing locations with the prototype sensor marked with an orange circle for clarity of the sensor placement.
Data Analysis
There are many different types of machine learning algorithms, which can be divided into categories such as logic-based (e.g. decision trees), perceptron-based (e.g. neural networks), statistical (e.g. Bayesian classifiers), instance-based (e.g. nearest neighbor), and Support Vector Machine (SVM) (Kotsiantis, Zaharakis, and Pintelas Citation2007; Sen, Hajra, and Ghosh Citation2020). There are various advantages and disadvantages to these different categories. In particular, SVMs and neural networks can lead to better performance when considering multiple dimensions and continuous features (Kotsiantis, Zaharakis, and Pintelas Citation2007). Additionally, decision trees, neural networks, and SVMs can be used to generate complex models to better fit variations in the data (Kotsiantis, Zaharakis, and Pintelas Citation2007).
Here, we select approaches from three different categories to explore the effectiveness of different techniques. Specifically, we consider a SVM, ANN, and Bagged Tree (BT) classification algorithms. A Gaussian Radial Basis Function (RBF) was implemented as the kernel for the SVM to allow for a nonlinear decision boundary. K-fold cross-validation was selected with 10 folds to validate each trained classifier. The ANN was selected as a feedforward neural network with a single hidden layer. The decision tree used bootstrap aggregating, or bagging, as an ensemble method to improve the predictive performance of the decision tree classifier (Banfield et al. Citation2007; Hothorn and Lausen Citation2005). These classifiers were selected in order to present a variety of different machine learning techniques that have been shown to be useful for various classification problems. The same training and testing data sets were used for each classifier in order to ensure consistency and allow for fair comparison of the classification results. All data analysis was performed using MATLAB (R2018a, Natick MA), including the Neural Network toolbox.
Results
Analysis of Measurements
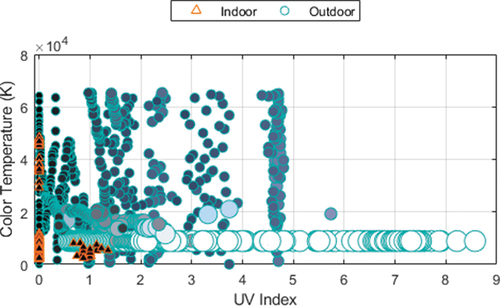
depicts the light metrics. In , the red, green, and blue components of light were used to generate the RGB color values when determining the fill color of each marker. Note that black represents no light whereas lighter gray indicates more light content that is balanced between red, green, and blue. In addition, the size of the markers was scaled with the luminosity, where larger light intensity is represented by a larger marker. Indoor samples cluster closely around low UV index, low color temperature, and low luminosity. The outdoor samples vary more substantially across these values but tend to have higher value metrics than the indoor samples. The region around a UV index of 1 is interesting, as there are both indoor and outdoor samples which have a UV index around this value. However, the other metrics differ, specifically the color, color temperature, and luminosity. This indicates that UV index alone is not enough to properly distinguish the categories.
Figure 4. Visual representation of light metrics with fill color representing RGB components and size corresponding to luminosity. Larger markers indicate a higher luminosity, while smaller markers indicate a lower luminosity value. Indoor measurements are marked as orange triangles while outdoor measurements are light blue circles.
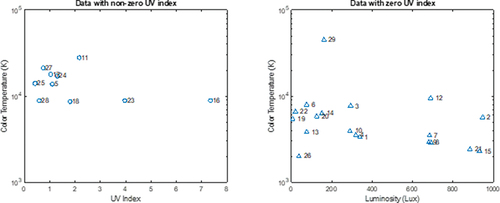
An additional visual representation of the collected data is offered in containing numbering which corresponds to . In , a single representative sample was selected from the corresponding data set in . These representative samples were selected by identifying the sample which contained the median luminosity measurement within that data set. As noted in , due to the clustering around small UV index values, this data was divided into two separate graphs: one containing samples with non-zero UV index (left), and one containing samples with UV index equal to zero (right). All samples with non-zero UV index happen to be outdoor measurements (marked with circles), and all samples with zero UV index happen to be indoor measurements (marked with triangles). On the left of , the same axes are used as to show the variation in color temperature and UV index for outdoor data. On the right of , since the UV index is equal to zero, the luminosity was instead used on the horizontal axis to better visualize the data. Note that is only showing a single sample of data from each data set.
Figure 5. Distribution of data sets using numbering from for outdoor non-zero UV index measurements (left) and indoor measurements with zero UV index (right). The sample containing the median luminosity measurement was selected as a representative example for each data set.
Training, Validation, and Testing of Machine Learning Algorithms
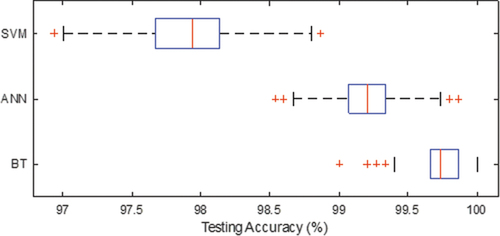
The overall data set was divided into 70% training data and 30% testing data for each of the considered machine learning classifiers. The training was repeated for each classifier using 1000 unique permutations of the data sets. The selection of training and testing data was randomized into 1000 different combinations and then fixed for all cases in order to have consistent data selection between the classifiers. Thus, the same random seed was used for each classifier to ensure consistency in the comparison. After training for each of the 1000 cases, the overall accuracy was calculated using the known indoor or outdoor condition from the data set. Then, the accuracy statistics of the 1000 cases were calculated, as shown in corresponding box plot in . Additionally, the confusion matrix for the different classifiers was calculated for each case, and the mean values are shown as percentages in .
Table 2. Summary of statistics for classifier accuracy on testing data
Table 3. Mean confusion matrix for each classifier on testing data as percentages
Figure 6. Box plot showing distribution of cross-validation for each classifier. The black lines indicate the maximum and minimum values, the blue rectangles indicate the lower and upper quartiles, the red line indicates the median, and the red ‘+’ symbols denote outliers.
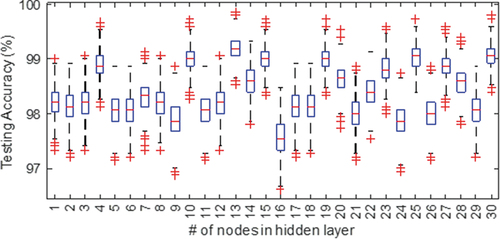
In order to determine the number of nodes for the hidden layer in the ANN, the training and cross-validation of the ANN was repeated for hidden layer sizes ranging from 1 to 30 nodes. The results from this analysis are provided in as a box plot displaying the distribution of performance across the 1000 cross-validation cases for each number of nodes in the hidden layer. No clear pattern is noted in , however, from this figure we select the best case of median ANN performance, which corresponds to 13 nodes in the hidden layer.
Figure 7. Box plot showing distribution of cross-validation for different numbers of nodes in the hidden layer for the ANN classifier. The black lines indicate the maximum and minimum values, the blue rectangles indicate the lower and upper quartiles, the red line indicates the median, and the red ‘+’ symbols denote outliers.
The overall classification accuracy, outdoor classification accuracy, and indoor classification accuracy were each evaluated using analysis of variance (ANOVA) with post-hoc testing to identify differences between the three considered classifiers. Analyses indicated significant differences for overall (F(2, 2997) = 16066.83, p < .001, ηp2 = .915), outdoor (F(2, 2997) = 20304.81, p < .001, ηp2 = .931), and indoor (F(2, 2997) = 997.67, p < .001, ηp2 = .400) accuracy. Post-hoc analyses indicated significant differences between all three classifiers for each accuracy measure (all ps < .001). For overall and outdoor, BT was significantly better than ANN which was significantly better than SVM. However, for indoor, the order reversed with SVM significantly outperforming ANN which significantly outperformed BT. It is worth noting, however, that although significant differences were observed, the actual differences in accuracy were quite small (e.g., see ).
Special Cases of Test Data
Although the data set used for training of the machine learning classifiers as described in is extensive, it is not inclusive of all possible situations for indoor and outdoor environments. The purpose of this section is to consider special cases of specific environmental conditions that are expected to challenge the machine learning algorithms. Each of these test cases is presented as new data to the classifiers, as in, no data from these special cases are included in the training data from the classifiers.
The first considered special case is cloudy outdoor data. During this data collection, 29 samples were collected in Reading, PA USA at approximately 3:00 PM on November 2, 2021. The weather conditions were cloudy with light rain. All three classifiers successfully identified the outdoor conditions for all 29 samples in all 1000 different cross-validated cases with 100% accuracy. Therefore, it is reasonable to conclude that clouds do not have a significant effect on the classification accuracy.
The second considered case was outdoor conditions at night, far from any outside lighting. For this data, all light measurements recorded values of exactly zero, which led to all classifiers misclassifying the outdoor conditions as indoor. That is, all three classifiers performed with 0% classification accuracy for this situation. This presents a major limitation of this classification technique in that it is only accurate during daylight hours. The use of light measurements alone is not likely to resolve this limitation, however the introduction of additional sensor measurements could mitigate the impact of this special case.
The final considered special case is directly inside of a window in direct sunlight. This condition is interesting in that it would typically be considered an indoor location, even though the lighting conditions are more similar to outdoor conditions. Some work introduces an additional category to describe these types of situations, often called “semi-outdoor” conditions (Radu et al. Citation2014; Zhou et al. Citation2012). Similar to the night special case, in all samples from this test, all three classifiers misidentified the indoor settting as being outdoors. This indicates another limitation of the currently proposed classification model. Since the classifiers are based on light measurements alone, they are predicting indoor or outdoor condition based on typical indoor and outdoor lighting patterns. That is, the classifiers identify sunlight through a window as outdoor conditions, because the light sensed through the window is more similar to outdoor lighting. Future work could explore this special case further, possibly through the consideration of an additional classification category or through additional sensors.
Discussion
Overall, each of the classifiers offered reasonable predictions of outdoor or indoor conditions from the light measurements. The lowest accuracy noted in any of the classifiers for each of the 1000 cross-validated cases was 96.9%. This level of accuracy is very high, and even at this performance level it is likely to achieve a more accurate prediction of time spent outdoors than a typical self-report measure. Researchers implementing GPS-based outdoor detection report approximately 80–90% sensitivity and specificity (Kerr et al. Citation2012; Tandon et al. Citation2013). The algorithm, IODetector, reported accuracy consistently above 92% (Li et al. Citation2014). In this context, the presented results are encouraging for a light-only based algorithm.
While all classifiers were successful, our results indicate that BT significantly outperformed the others. This is attributable not only to the increased mean accuracy, but also to the decreased variability in its classification accuracy (see ). As is evident in , all three classifiers were highly successful in classifying indoor environments. However, BT significantly outperformed the ANN, which significantly outperformed the SVM when classifying outdoor environments. This trend was also observed for the overall data set. The bagged tree classifier has been shown to outperform SVM and ANN in other comparison studies (Caruana and Niculescu-Mizil Citation2006), therefore this result is reasonable, though it may be possible to improve the ANN performance through further calibration and tuning.
For post-processing analysis, the BT is recommended for indoor/outdoor classification using light measurements. It is worth noting, however, that in circumstances where the highest possible accuracy is not paramount, ANN and SVM may be viable alternatives. Error rates for these classifiers were still relatively low. Additionally, they may be more practical for real-time implementation due to lower computational complexity for this model.
Conclusions
This work presented three different machine learning classifiers for predicting whether a sensing system was outdoors or indoors based solely on measurements of light. The results from the classifiers revealed high classification accuracy for each of the proposed classifiers, thus indicating that these measurements can make the distinction of indoor or outdoor without the use of external signal information. A bagged tree classifier yielded the highest average performance accuracy among the considered classifiers at 99.7%. The proposed sensing system could be implemented within human research studies to objectively quantify the amount of time a person spends outdoors, which would benefit the psychological research community.
Acknowledgments
This work was partially supported by the Penn State Berks Research Development Grant and the Frank Franco Undergraduate Research Award. The authors would like to thank Nicholas Ficca and Michael Isaac for help collecting data for this study.
Disclosure Statement
No potential conflict of interest was reported by the authors.
References
- Ali, M., T. ElBatt, and M. Youssef. 2018. SenseIO: Realistic ubiquitous indoor outdoor detection system using smartphones. IEEE Sensors Journal 18 (9):3684–962. doi:10.1109/JSEN.2018.2810193.
- Banfield, R. E., L. O. Hall, K. W. Bowyer, and W. Philip Kegelmeyer. 2006. A comparison of decision tree ensemble creation techniques. IEEE Transactions on Pattern Analysis and Machine Intelligence 29 (1):173–80.
- Bisio, I., A. Delfino, and F. Lavagetto. “A simple ultrasonic indoor/outdoor detector for mobile devices.” In 2015 International Wireless Communications and Mobile Computing Conference (IWCMC), pp. 137–41. IEEE, Valamar Dubrovnik President, Dubrovnik, Croatia, 2015.
- Boldemann, C., M. Blennow, H. Dal, F. Mårtensson, A. Raustorp, K. Yuen, and U. Wester. 2006. Impact of preschool environment upon children’s physical activity and sun exposure. Preventive Medicine 42 (4):301–08. doi:10.1016/j.ypmed.2005.12.006.
- Burdette, H. L., and R. C. Whitaker. 2005. A national study of neighborhood safety, outdoor play, television viewing, and obesity in preschool children. Pediatrics 116 (3):657–62. doi:10.1542/peds.2004-2443.
- Caruana, R., and A. Niculescu-Mizil. “An empirical comparison of supervised learning algorithms.” In Proceedings of the 23rd international conference on Machine learning, Pittsburgh, PA USA, pp. 161–68. 2006.
- Cleland, V., L. A. David Crawford, C. H. Baur, A. Timperio, and J. Salmon. 2008. A prospective examination of children’s time spent outdoors, objectively measured physical activity and overweight. International Journal of Obesity 32 (11):1685. doi:10.1038/ijo.2008.171.
- Flynn, J. I., D. P. Coe, C. A. Larsen, B. C. Rider, S. A. Conger, and D. R. Bassett Jr. 2014. Detecting indoor and outdoor environments using the ActiGraph GT3X+ light sensor in children. Medicine and Science in Sports and Exercise 46 (1):201–06.
- Frumkin, H. 2001. Beyond toxicity: Human health and the natural environment. American Journal of Preventive Medicine 20 (3):234–40. doi:10.1016/S0749-3797(00)00317-2.
- Hartig, T., G. W. Evans, L. D. Jamner, D. S. Davis, and G. Tommy. 2003. Tracking restoration in natural and urban field settings. Journal of Environmental Psychology 23 (2):109–23. doi:10.1016/s0272-4944(02)00109-3.
- Hofferth, S.L., and Sandberg, J.F., 2001. How American children spend their time. Journal of Marriage and Family 63 (2): 295–308.
- Hothorn, T., and B. Lausen. 2005. Bundling classifiers by bagging trees. Computational Statistics & Data Analysis 49 (4):1068–78.
- Kerr, J., S. Marshall, S. Godbole, S. Neukam, K. Crist, K. Wasilenko, S. Golshan, and D. Buchner. 2012. The relationship between outdoor activity and health in older adults using GPS. International Journal of Environmental Research and Public Health 9 (12):4615–25. doi:10.3390/ijerph9124615.
- Klinker, C. D., J. Schipperijn, J. Kerr, A. K. Ersbøll, and J. Troelsen. 2014. Context-specific outdoor time and physical activity among school-children across gender and age: Using accelerometers and GPS to advance methods. Frontiers in Public Health 2:20. doi:10.3389/fpubh.2014.00020.
- Kotsiantis, S. B., I. Zaharakis, and P. Pintelas. 2007. Supervised machine learning: A review of classification techniques. Emerging Artificial Intelligence Applications in Computer Engineering 160 (1):3–24.
- Krumm, J., and R. Hariharan. 2004. TempIO: Inside/outside classification with temperature. In In second international workshop on man-machine symbiotic systems, Kyoto University, Kyoto, Japan, 241–50.
- Kuo, F. E., and W. C. Sullivan. 2001. Aggression and violence in the inner city: Effects of environment via mental fatigue. Environment and Behavior 33 (4):543–71. doi:10.1177/00139160121973124.
- Li, M., P. Zhou, Y. Zheng, L. Zhenjiang, and G. Shen. 2014. IODetector: A generic service for indoor/outdoor detection. ACM Transactions on Sensor Networks (TOSN) 11 (2). doi: 10.1145/2659466.
- Maas, J., S. M. E. Van Dillen, R. A. Verheij, and P. P. Groenewegen. 2009. Social contacts as a possible mechanism behind the relation between green space and health. Health & Place 15 (2):586–95. doi:10.1016/j.healthplace.2008.09.006.
- MacKerron, G., and S. Mourato. 2013. Happiness is greater in natural environments. Global Environmental Change 23 (5):992–1000. doi:10.1016/j.gloenvcha.2013.03.010.
- McCurdy, L. E., K. E. Winterbottom, S. S. Mehta, and J. R. Roberts. 2010. Using nature and outdoor activity to improve children’s health. Current Problems in Pediatric and Adolescent Health Care 40 (5):102–17. doi:10.1016/j.cppeds.2010.02.003.
- Radu, V., P. Katsikouli, R. Sarkar, and M. K. Marina. “A semi-supervised learning approach for robust indoor-outdoor detection with smartphones.” In Proceedings of the 12th ACM Conference on Embedded Network Sensor Systems, pp. 280–94. ACM, Memphis, TN USA, 2014. DOI: 10.1145/2668332.2668347
- Rhudy, M. B., N. Greenauer, and C. Mello. 2020. Wearable light data logger for studying physiological and psychological effects of light data. HardwareX 8:e00157.
- Schaefer, L., R. C. Plotnikoff, S. R. Majumdar, R. Mollard, M. Woo, R. Sadman, R. L. Rinaldi, Boulé, N., Torrance, B., Ball, G.D., et al. 2014. Outdoor time is associated with physical activity, sedentary time, and cardiorespiratory fitness in youth. The Journal of Pediatrics 165 (3):516–21. doi:10.1016/j.jpeds.2014.05.029.
- Sen, P. C., M. Hajra, and M. Ghosh. 2020. Supervised classification algorithms in machine learning: A survey and review. In Emerging technology in modelling and graphics, ed. Jyotsna Kumar Mandal and Debika Bhattacharya, 99–111. Singapore: Springer.
- St Leger, L. 2003. Health and nature—new challenges for health promotion. Health Promotion International 18 (3):173–75. doi:10.1093/heapro/dag012.
- Tandon, P. S., B. E. Saelens, C. Zhou, J. Kerr, and D. A. Christakis. 2013. Indoor versus outdoor time in preschoolers at child care. American Journal of Preventive Medicine 44 (1):85–88. doi:10.1016/j.amepre.2012.09.052.
- Thompson, C. W., J. Roe, P. Aspinall, R. Mitchell, A. Clow, and D. Miller. 2012. More green space is linked to less stress in deprived communities: Evidence from salivary cortisol patterns. Landscape and Urban Planning 105 (3):221–29. doi:10.1016/j.landurbplan.2011.12.015.
- Wang, W., Q. Chang, L. Qun, Z. Shi, and W. Chen. 2016. Indoor-outdoor detection using a smart phone sensor. Sensors 16 (10):1563. doi:10.3390/s16101563.
- Ye, B., K. Liu, S. Cao, P. Sankaridurg, L. Wayne, M. Luan, B. Zhang, Zhu, J., Zou, H., Xu, X., et al. 2019. Discrimination of indoor versus outdoor environmental state with machine learning algorithms in myopia observational studies. Journal of Translational Medicine 17 (1):1–12.
- Zeng, Q., J. Wang, Q. Meng, X. Zhang, and S. Zeng. 2017. Seamless pedestrian navigation methodology optimized for indoor/outdoor detection. IEEE Sensors Journal 18 (1):363–74.
- Zhou, P., Y. Zheng, L. Zhenjiang, M. Li, and G. Shen. “Iodetector: A generic service for indoor outdoor detection.” In Proceedings of the 10th acm conference on embedded network sensor systems, Toronto, Ontario, Canada, pp. 113–26. ACM, 2012. DOI: 10.1145/2426656.2426668
- Zou, H., H. Jiang, Y. Luo, J. Zhu, L. Xiaoxuan, and L. Xie. 2016. Bluedetect: An ibeacon-enabled scheme for accurate and energy-efficient indoor-outdoor detection and seamless location-based service. Sensors 16 (2):268. doi:10.3390/s16020268.