
 ?Mathematical formulae have been encoded as MathML and are displayed in this HTML version using MathJax in order to improve their display. Uncheck the box to turn MathJax off. This feature requires Javascript. Click on a formula to zoom.
ABSTRACT
Using the universe of Armenian business tax payers operating under a standard tax regime, we develop a fraud prediction model based on machine learning tools, with gradient boosting as the primary choice. Having to deal with broadly defined fraud and heterogeneous taxpayers, as well as a relatively small sample, we successfully derive important features from tax returns with a minimum of additional information. Among the important fraud predictors, we obtain historical fraud and audit, share of administrative costs, and external economic activity. We see two main contributions with generalizable practical implications for auditing authorities. First, by focusing on the lift score of the top decile, we demonstrate that even moderately accurate models can improve upon existing accuracy of rule-based approaches. Second, and more importantly, we demonstrate that the information contained in the supplier and buyer network of the taxpayer can be used whenever important predictors of fraud such as historical audits and fraud are not available. This is particularly important for situations with newly established companies, who would otherwise be under-rated in terms of fraud probability.
Introduction
Detection of tax fraud or evasion remains one of the most important functions of public revenue agencies. Transition to electronic platforms for declaring and paying taxes, besides improving the quality and satisfaction from the public services, also provides an opportunity to utilize data-driven approaches toward fraud detection. Recent advances in machine learning and artificial intelligence applications have also largely impacted the landscape of tax and financial fraud identification techniques (Abrantes and Ferraz (Citation2016), Ngai et al. (Citation2011)). Importantly, these are also gaining importance in developing countries, where tax evasion is more pervasive and institutions are weaker (Fuest and Riedel Citation2009).
In this paper, we build a fraud detection approach using the administrative data set on tax returns from business entities in Armenia. The models are developed using the population of administrative data on tax returns and related taxpayer information regularly collected by the State Revenue Committee (SRC) of the Republic of Armenia. We focus on the subset of firms operating under the Value-Added Tax (VAT) and Corporate Income Tax (CIT) regime.Footnote1 The SRC maintains a detailed data set on tax audits, which are used to extract information on whether the taxpayer has been audited in the past and whether that audit resulted in fines payable.Footnote2 The database on audit and fraud used is retrospective and covers the period from 2006 up to 2020. The rest of the data include VAT monthly returns, CIT annual returns, and other taxpayer information, such as the number of employees and economic sector of activity. The data are annualized, and the model is trained to predict 2018 fraud and tested on 2019 unseen data.Footnote3
Coping with the lack of nonfinancial data about the taxpayers and high heterogeneity of economic activity types and scales, we deploy a series of steps to obtain a reliable model that can also be applied when the historic behavior records of the taxpayer are absent. In particular, we apply information about fraud prevalence in the network of the taxpayer and test its ability to replace information about past behavior. We use tree-based ensemble model-gradient boosting machines to automatically capture the patterns of the data. Our model with the described approach outperforms the currently used risk-based system and most importantly is adaptive (the model can be updated with the availability of new data, unlike rule-based system, which requires manual updates).
Next, unlike traditional playfields for machine learning approaches characterized with a high-volume data, we face the opposite challenge. Country’s small size and large share of firms operating under simplified tax regimes considerably limit the number of taxpayers eligible for constructing a plausible fraud model. This requires serious efforts in extracting and constructing features that would possibly impact the potential fraudulent behavior. This combination of “structural” approach toward feature selection and machine learning models is not conventional, given that these models are in fact applied to capture possible nonlinearity and thus decrease the need of preliminary data manipulations.Footnote4
Our work builds on fast growing literature on the application of machine learning and artificial intelligence (AI) to tax fraud, in particular, and financial reporting fraud detection, in general. Depending on data availability, the studies apply either supervised or unsupervised learning methods and in some cases, both. Supervised models, in their turn, are most commonly structured around binary or multiclass classification tasks, and usually, more than one classification techniques are deployed. Classification targets differ: Höglund (Citation2017) uses linear discriminant analysis to predict tax underpayments in Finland, which are not necessarily coinciding with fraud; Rahimikia et al. (Citation2017) use neural network, support vector machine (SVM), and logistic regression (LR) classification models on Iranian taxpayer data to discriminate between misstating and nonmisstating taxpayers; Kim, Baik, and Cho (Citation2016) again deploy a battery of classification models, but unlike others, with the purpose of categorizing financial restatements into three groups—regular, erroneous, or irregular. Some approaches also incorporate expert opinion or qualitative data within the overall framework of fraud prediction using machine learning (Hooda, Bawa, and Rana Citation2019 or Coita, Codruta, and Cioban Citation2021).Footnote5 Similar to the above-mentioned studies, we deploy different classification methods and draw conclusions based on the best performing one.
One of the specifications in the literature seems to be the focus on narrower types of fraud or homogenous economic activities: De Roux et al. (Citation2018) focus on tax declarations by construction sites and González and Velásquez (Citation2013) try to predict fraudulent invoices, while both are lacking the outcomes data and apply unsupervised learning techniques. Mittal, Reich, and Mahajan (Citation2018) apply a random forest classification to the value-added tax (VAT) return reports for companies in India in order to increase tax compliance by identifying “bogus” (shell) firms, which can be later audited. They conduct classification between two groups of taxpayers: audited and identified as fraudulent and the rest. An anomaly detection approach is developed and applied by Vanhoeyveld, Martens, and Peeters (Citation2020) to identify potential fraud in VAT reporting among Belgian firms. To have even more homogeneity and increase the accuracy of the approach, the authors approach the task by considering economics sectors separately. We departure from this trend and approach fraud from a broader perspective. Our study provides a more general guideline to the tax authorities (similar to Didimo et al. (Citation2020)), which simultaneously complicates the task of prediction by introducing sources of heterogeneity and makes our approach more generalizable.
Another challenge of our approach is the reliance on business tax administrative data. Unlike the fraud prediction with individual-level taxes, where information about tax base drivers (e.g. asset size verifiable by satellite data (Daley Citation2010) or social platform-evidenced spending (Srivastava Citation2017)) is available, business taxes leave almost no sources of externally detectible unusual behavior. To overcome this issue, we had to identify possible drivers of abnormal behavior using the existing data. While the literature highlights the importance of feature selection (Matos et al. Citation2020), and we also adapt a specific algorithm for that purpose, feature extraction is of central importance for our case. While tax returns data are used, we adapt approaches deployed in the literature—VAT-related features are constructed taking into account the feature extraction approach described in Vanhoeyveld, Martens, and Peeters (Citation2020), general performance ratios similar to Rahimikia et al. (Citation2017). In addition, we use first and second moments of firm transactions reflected in the invoices received and written out, as well as tax receipts issued on final sales (if relevant). We also used information that would capture productivity, abnormal growth, or unusual cost structure.
The baseline prediction models that we obtain demonstrate high dependence of prediction accuracy on taxpayer’s historic audit and fraud record. At the same time, in the environments where there are high firm entry and exit rates, this might be a problematic model in which characteristic and application of alternatively available data can mitigate this problem. Second, the framework that we utilized enabled comparison with current rule-based risk assessment accuracy performance. In this regard, even if the direct application of our model is not feasible due to possible legal limitations, the results can be used to improve the rule-based risk identification system.
In addition, the importance of historical audit and fraud in predicting misreporting creates a bias toward auditing aged taxpayers. Therefore, the other contribution of this paper is that we find it possible to replace the historical audit and fraud information (which is one of the boldest predictors of current fraud) with data on prevalence of fraud within the supplier and buyer network of the taxpayers. While the application of network information is not novel (González-Martel, Hernández, and Manrique-de-lara-peñate Citation2021), we use the fraud information in the network, rather than employing network information to explain misreporting. In addition, we demonstrate that information contained in the current network of the taxpayer is almost as informative as the past behavior of the taxpayer itself. From the practical perspective, we believe that the application of the network information will definitely mitigate such a bias and provide a basis for auditing younger firms.
Summarizing the major contributions of this paper, the following ones can be highlighted:
Model features are constructed using insights obtained from relevant studies and complemented with a specific set of ratios, moments, and growth variables that could indicate abnormal economic outcomes. A custom developed feature selection method is used to get a manageable and meaningful subset of relevant variables.
This paper offers an integral approach that is experimentally demonstrated to be superior to the currently used rule-based approach. The machine learning models that are employed in addition to the existing risk-based audit system can improve the targeting of audits.
It is demonstrated that the network data can be almost as informative as historical fraud and audit data and thus alleviate the bias of the fraud model with respect to picking up relatively older firms for audits.
The rest of this paper presents the following: the institutional framework in which data are generated and current audit practices; methodological approach, highlighting both machine learning models applied and steps necessary to operationalize them in practice; data overview; and the results, followed by brief conclusions.
Institutional Framework and Fraud Definition
Armenia is a small open post-Soviet economy with an upper-medium national income, as per World Bank in 2019. In the same year, tax revenues constitute 22.2% of GDP and the indirect taxes constitute around half of the total tax income of the state budget (World Bank Citation2020). The estimated tax gap is 3.5% of GDP, and its considerable share is due to tax evasion and avoidance (Khwaja and Iyer Citation2014). Recent years are characterized by the massive introduction of electronic services. This has considerably improved the tax collection rate and general satisfaction from the revenue agency. Over the last ten years, Armenia’s ranking for Paying Taxes on World Bank’s Doing Business indicators has improved from 159 rank (out of 183) in 2011 to 52 (out of 190) in 2019 (World Bank Citation2019).
Tax audits remain one of the main tools to combat tax fraud and evasion. The typology and frequency of audits are quite diverse. But there are three main types of audits conducted by the respective SRC units – complex (budget) audits, revenue audits, and unregistered employees’ audits. These three types together represent almost 74% of all audits in 2018. Complex audits are conducted based on prepublished lists of around 1000 taxpayers annually. As the name suggests, the audit covers the whole spectrum of activities. The taxpayers subject to complex audits are derived based on a risk identification system. While the exact weights of applied criteria are non-disclosable, the regulation identifies 19 criteria used for categorizing the taxpayers into high-, medium-, and low-risk taxpayers. Among those are profitability, external economic activity, past audits’ results, variety of economic activity types, and others. According to the Tax Code, the annual complex audit plan should include 50% of taxpayers with high risk, 30% with medium risk, and 20% with low risk.
Revenue audits are conducted among the taxpayers issuing sales receipts to final consumers, and these are conducted without prior notice. Unregistered employee checks are also conducted on the spot without prior warning. Importantly, in the analysis that follows, whenever not indicated otherwise, no distinction between the audit types is made.
For the purposes of our study, in the baseline approach, we classify as fraudulent a taxpayer, which was fined as a result of an audit irrespective of its type. While in certain cases, this approach is straightforward (e.g. whenever the taxpayer was fined for not printing and providing the customer tax receipt), it is not a priori clear whether fines resulting from other types of audits in fact represent a purposeful tax evasion. Hence, we acknowledge the possible limitations of using labels provided by the SRC. In the methodology section, we outline how we implement alternative classification with the purpose of testing the robustness of the approach. Broadly defined, what we label here as fraud is in fact misreporting. The following table provides statistics on the type of audits and outcome per the classification approach described above for 2018 and 2019:
Methodology and Data
The tax fraud detection problem has been approached using both unsupervised and supervised learning techniques. The former is typically used in environments when historical data on fraudulent behavior are missing. Yet, in order for unsupervised techniques to perform well, one should have access to company characteristics, which will allow grouping similar taxpayers together and extract behavioral patterns. Given the availability of historical information on fraudulency from past audit performances, in this paper, we approach the fraud prediction problem as a binary classification task. The target variable is defined as the observed violations in a certain calendar year t (e.g. year 2019), while all the independent variables are observed during the preceding years t-i|i ≥ 1. This ensures that the temporal dependency is respected and allows the users of the model to get insights into the likelihood of fraud for the upcoming year using current data.
The fraud prediction approach that we adopt follows the following steps.
(1) Feature extraction and selection. Building upon the literature reviewed, we implement extensive feature engineering in these data and create new features describing the performance of a company. We use economics of tax evasion to capture possible objects subject to vulnerability, as well as the accounting standards and conventions for finding out where report manipulations might be perceived less risky by the taxpayers. The newly created features can be grouped into three broadly defined categories: ratios, data moments, and growth features. Ratios are obtained by combining data coming from different types of tax returns and are meant to gauge different aspects of firm performance. Among others, we calculate the share of exempt and zero VAT turnover in total sales, as well as share of administrative, direct, and indirect costs in total costs, respectively. Similarly, we derive measures of productivity and profitability. Productivity is proxied by total revenues per employee, and profitability is the ratio of taxable profit to total revenues. The second group of variables is meant to capture the size and volatility of taxpayers’ operations. For this purpose, we calculate the mean and standard deviations for the number and amount of tax receipts when the sales are made to final consumers and invoices when these are made to other businesses. The third set of variables is meant to measure taxpayers’ growth pattern. For these purposes, we obtain employee average growth over the years, tax receipt (invoice) number, and amount year on the year growth rate for two preceding years.
In addition, we deploy a custom developed recursive feature elimination procedure to make the model simpler and to select the most important variables. More specifically, the feature or the group of features with the lowest score are eliminated at each step. The score is the same as we choose for assessing the model performance (see step 2). The approach continues to remove features if after the elimination, the model score is not significantly reduced and stop whenever the drop reaches the maximum threshold. The key point here is that after each step of elimination, the model hyperparameters are tuned with the Bayesian hyperparameters tuning algorithm, and the model is optimized based on current features.
(2) Modeling approach. Given the nature of the problem, we hypothesize that fraudulent taxpayers represent a certain segment of taxpayers that can be identified using a simple or complex set of rules. As a result, we envisage supervised segmentation techniques such as logistic regression and tree-based algorithms—decision tree, random forest, and gradient boosting—to provide the most competitive results. While tree-based algorithms do not need any data scaling approach for modeling, we implemented a standard scaling (variable standardization by removing the mean and scaling to unit variance) only for logistic scaling. In order to find the best technique, we applied various methods and based on their performance results, gradient boosting machines outperformed other approaches. The models in the gradient boosting machine are building sequentially, and each of these subsequent weak learner models (decision trees) try to reduce the error of the previous ones. The other main advantage of the algorithm is that each node takes a different subset of features, so that they will be able to find different signals from the data. It is done by building the new model over errors or residuals of the previous predictions. The purpose is to determine if there are any patterns in the error that is missed by the previous model. Two target variables are predicted:
2.1. Audit model – the audit model can be used to extract audit rules and compare them with fraud model rules. This step has a practical implication as it can be easily used by the relevant decision-makers to upgrade the “rules” in the current rule-based system. Also, a good audit model helps to see whether the newly identified and potentially fraudulent taxpayers would otherwise be audited if the current system was applied. In other words, the audit model assists to validate the practicality of the fraud model in terms of identifying new taxpayers, which can also be subject to tax evasion. The target variable of the audit model is equal to 1 if in the year considered, the taxpayer has undergone any audit type, and zero otherwise.
2.2. Fraud model—main objective of the paper. This model is expected to be deployed together with the existing risk-based audit system to refine the suggestions made by the rule-based approach. The baseline target variable of the fraud model is described in Section 2 – we classify as fraudulent a taxpayer, which was fined as a result of an audit irrespective of its type. An alternative approach is deployed when testing for the robustness of the results in step 4.
(3) Performance evaluation. The choice of the overarching evaluation metric for model performance rests on the fact that auditing authorities face trade-off between identifying as much fraudulent firms as possible and efficiently using scarce audit budgets. In this regard, using measures focused solely on true positives (e.g. recall) or true negatives (e.g. specificity) cannot reflect that trade-off. Therefore, we use the area under the receiver operating characteristic curve (AUC ROC) as a primary measure to evaluate and compare the performance of different models. This decision is mainly centered on the fact that AUC ROC considers both false positives and false negatives, which are also independent of the cutoff value of classification thresholds. Yet, we also report individual measures such as recall (sensitivity) and precision values.Footnote6 The reported scores are measured independently on both train and test data sets to provide the opportunity of bias variance comparison.Footnote7
(4) Robustness. We test the validity of the described approach by considering an alternative definition of the target variable. While in the baseline model, we label as fraudulent any incidence of payment made by the taxpayer as a result of tax audit, a less restrictive approach is considered. In particular, we run models where target variable fraud is value 1 only if the amount of penalties payable exceeds 1% of monthly revenue (given that under a simplified regime when paying turnover tax companies 3% of the revenue, we consider 1% to be a meaningful threshold). More minor payments are labeled as no fraud. Another limitation of our methodology is the absence of discrimination between various audit types considered. Unfortunately, the small number of observations makes it impossible to test the model even for the all main audit types of separately; we run it for the most frequent audit—tax receipts audits. In this version, the target variable is defined as fraudulent only as a result of tax receipt audits.Footnote8
(5) Model deployment for actual audit implementation. Driven by resource limitation, SRC has a certain constraint on the total number of enterprises to be audited during a given calendar year. Thus, the problem itself can be defined as a ranking task with the objective of ordering the taxpayers starting from the most likely to commit a tax fraud or violation to the least likely. This will allow the auditing agency to easily extract the list of taxpayers with the highest likelihood of committing fraud and target them for audit. We expect to achieve increased audit precision given the same constraints on resources. Additionally, the ranking allows us to identify top and bottom deciles of taxpayers in terms of their likelihood to evade, which is further used to capture and explain tax evasion behavioral patterns. In order to quantify the benefit of the suggested model performance and conduct a fair comparison with the existing approach, we use the lift score. The taxpayers identified for audit by the existing risk-based system are all considered at the same level, without any internal ranking.Footnote9 This is equivalent to the assumption that they are randomly selecting taxpayers from a predefined list. The lift score shows how many times the model-based selection is better over such selection. In this case particularly, when focusing on top decile, the score will show how many times more fraudulent taxpayers can be identified, given the same number of audits compared to a random (currently applied) approach. Thus, the value of lift score shows the relative gain achieved by model-based decision-making compared to random selection of records.
Table 1. Number of audits and incidence of fraud by main audit types and in total
Steps through 1 to 5 define the sequential order of the approach. The following methodological step can be implemented as an alternative or addition to steps 1 and 2.
(6) Using network data. Building high-performance machine learning models is part of the work. As the results will be obtained later on, the performance of the model highly depends on the availability of historical information on audits conducted for the certain taxpayer. Yet, the limited resources of SRC result in many taxpayers not being audited over time, which, in its turn, decreases the usability of the machine learning model. In order to bridge the gap created by the absence of taxpayer history, in this paper, we evaluate the value added from incorporating taxpayers’ suppliers and buyers’ network history as an additional covariate. The procedure follows three simple steps. First, we remove taxpayer history information from the model to show the reduction of model performance. Second, we use data from corporate transactions to assess the history of fraudulency and business operations of the players in the company’s network. Third, we incorporate this information in the model as a set of additional independent variables to observe to what extent the model performance is regained.
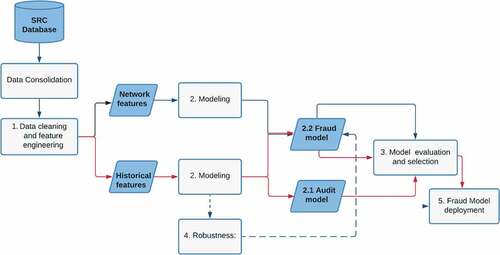
The overall outlined methodological approach is summarized in .
Figure 1. Fraud prediction approach using machine learning.
We experiment with our suggested framework on the universe of all profit and VAT tax payers registered in the SRC system in 2018 (run on 2017 and earlier features) and 2019 (run on 2018 and earlier features). The resulting data set consists of 23,526 tax payers.Footnote10
The overall data set (for 2019) includes 2,779 profit taxpayers who were audited (~12% of all). Among them, 45% (1261 taxpayers) were identified to be fraudulent and 55% (1518 taxpayers) nonfraudulent (using the baseline definition of fraud).
The information available on each business taxpayer includes the corporate income tax annual reports, quarterly VAT reports, monthly aggregated data on tax receipts (issued to final consumers) and/or invoices received/sent (amounts and quantities), information on the number of employees (at regular intervals), and type of economic activity.
Applying the feature extraction and selection approach described in Step 1 of the methodology section, we obtain 29 predicting variables. Either definitions or formulas used to derive them are available in appendix .Footnote11 summarizes descriptive statistics for selected variables for the overall sample, as well as broken down by fraudulent and nonfraudulent taxpayers. The selected features are among the top ones considered influential by the Shapley values of the final model.
Table 2. Mean values of selected predictors of audit and fraud used in the study
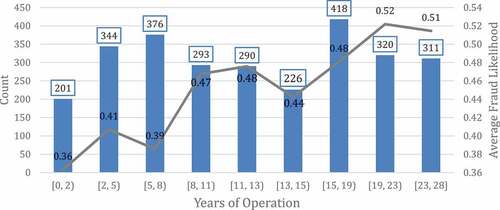
It is interesting to note based on that relative distribution of audited companies is not significantly different based on the years of operation, except for newly established ones (as these data only include audited companies, the total number is the same as the total number of audits) However, the taxpayers with the longest duration in the market are more prone to exercise fraudulent behavior.
In terms of sectors of economic activity, audits are much more often in the wholesale and retail trade (). This reflects the fact that this type of economic activity is the most common in the country. At the same time, in spite of a small number of audits in some sectors, they have a very high fraud percentage, similar to the largest sector.
Figure 2. Fraud distribution by taxpayer tenure (2019).
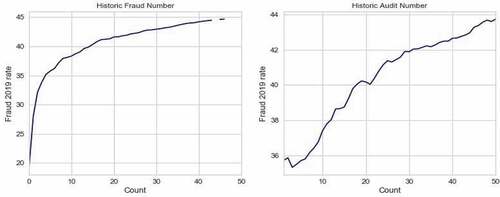
Another observation is that past audits and fraud occurrences are highly correlated with fraud incidence in 2019 (). When we turn to the incidence of fraud, past occurrence of fraud seems to be an important factor associated with fraud in 2019. Moreover, historical audits influence probability of fraud although its marginal effects are much smaller, which is expected. Note that this probability of fraud predicted in is actually on the subset of audited taxpayers only.
Figure 3. Fraud distribution by the taxpayer sector (NACE) of operation (2019).
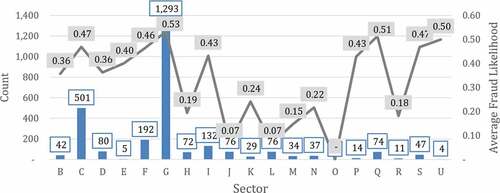
Figure 4. Effect of historical audits and frauds on probability of fraud in 2019.
Results
Audit Model
We start by looking at the results of the audit model. It aims to obtain a model, which will approximate to current (not disclosed) audit rules. Following our methodology, we build models using 4 different approaches as reported in Appendix . The results show that the model using gradient boosting machines (XGBoost implementation) is superior in terms of out-of-sample performance as measured by ROC AUC. The model achieves almost 95% ROC AUC, which is good enough to provide accurate probability estimates for meeting the objective, mimicking the current audit rules, and obtain prediction of taxpayers that would be audited if the current system is used. summarizes the performance of the gradient boosting model.
Table 3. Results of Audit and Fraud classification models
Fraud Baseline Model
Still, our central task is the development of a fraud classification model. In this case as well, 4 different fraud classification methods with various specifications were experimented. Whenever applicable, the hyperparameters were chosen based on the grid search results, which is used to find the optimal hyperparameters of a model, which is the most ‘accurate’ predictions. provides the summary of evaluation metrics of the experimented methods. Gradient boosting outperforms the other tested approaches in terms of ROC AUC for both 2018 and 2019 and has achieved the 2nd best and top 1st decile lift scores for 2018 and 2019, respectively. Therefore, we consider Gradient Boosting as the final/winner model. It shows 71% ROC AUC in general.
While the predictive accuracy of the model can seem to be low, it is still comparable with the evidence obtained from other studies. Didimo et al. (Citation2020) report 75% accuracy in terms of ROC-AUC with a random forest classifier for fraud classification. The results of this paper are quite comparable with ours as the context and modeling algorithms (both are tree-based models) are similar, but they have much larger data set and a more elaborated fraud detection strategy and tools. The predictive power of the model suggested by Rahimikia et al. (Citation2017) is higher, around 0.80. The authors use the full package of financial reports of the taxpayer to detect fraud, while in many cases, including ours, financial information was not available fully and the tax reports do not fully characterize financial standing of the taxpayer. Overall, the analysis shows that around 70–80% ROC-AUC score for tax fraud detection is an acceptable range in the literature.
Next, the models were applied to 2019 unseen data, in order to check how general is the chosen approach and for having confidence for accurate predictions of 2020 fraud cases based on the updated 2019 model. As can be seen from , the results of the 2018 test set and 2019 validation are quite similar, and therefore, it was decided to retrain and update the model based on the 2019 data set.
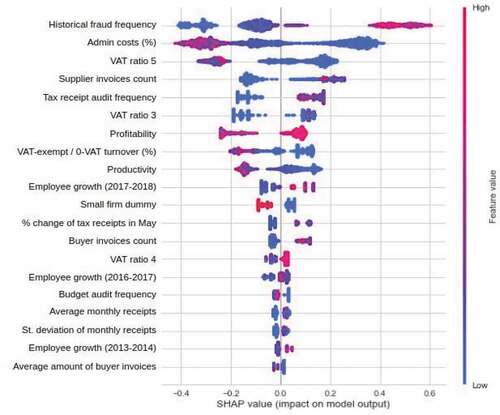
As it can be inferred from , historical fraud frequency and share of administrative costs in overall expenses of the taxpayer are important predictors in the fraud model. Interestingly, the information contained in VAT returns, which are represented by VAT exempt share of revenues, as well as various ratios derived from the form (coded as VAT ratios, 3, 4, and 5), also provides major input into the classification of fraudulent activities. It is important to highlight that overwhelming majority of these important variables are derived measures (ratios, moments, and growth variables obtained at the data manipulation stage), which again highlights the importance of understanding the connection between unusual patterns of accounting and economic variables and possible fraud.
Figure 5. SHAP values for the variables used in the baseline fraud model.
Models of Fraud with Alternative Definitions
of the Appendix reports the results of the two alternative models that we run using alternative fraud definitions outlined in Methodology step 4. As the results suggest, while assuming that minor penalties are not associated with fraud does not considerably impact the accuracy of the model, focusing on specific audit results impairs the results. This confirms the already emphasized limitation of our approach – necessity to consider all audit (hence fraud) types together. One way to overcome this shortcoming would be to pull together data from various years together and increase the sample size.
Baseline Fraud Model Deployment Results
Given the limitation of having predominantly tax reporting information of taxpayers, as well as covering all types of economic activities, the fraud models, as expected, are not very precise. Yet, we suggest a framework for implementing fraud models that is believed to provide the opportunity of accurate identification of potentially fraudulent taxpayers that otherwise would not be audited. Below are the steps for the suggested implementation framework.
The first step is to learn the probability cutoff value above which the model results in confident and accurate predictions. As an estimate for this threshold, we propose to use the minimum probability of top decile, but this is not a critical element.
The second step is to apply the fraud model to estimate the probability of tax evasion for all the taxpayers, also the one that has not been audited.
Third, choose only taxpayers who have probability estimates above the calculated threshold value. This will be the set of taxpayers who the model is very confident in being fraudulent.
Finally, and only for validation purposes, the audit model can be applied to see whether these taxpayers would be otherwise audited by the current system.
The implementation of the suggested framework on the historical data (2019 audits) showed that there are 2,504 taxpayers that the model selects at the third step, but only 1,399 of them are captured as positives by the audit model (i.e. only 1,399 would be considered for audit). We alsohave access to actual audit outcomes for 2020, which are compared against the model prediction. Indeed, if we focus on the 1st decile of the model prediction, the audit accuracy is 62% compared to the average detected fraud rate of 45% (). Moreover, we have utilized the ability of the taxpayers to submit corrections for already provided tax reports. According to SRC specialists, there is a certain degree of correlation between the frequency and among corrections and propensity of the taxpayer to submit misstated reports. Hence, the higher incidence of (or higher amount of) corrections submitted for those predicted by the model to be fraudulent also serves as an additional validation for the model efficiency in practice. According to analysis jointly conducted with SRC, we have identified that 59% of taxpayers marked by SRC risk-based system as high-risk submitted corrections, whereas 86% of taxpayers both marked by SRC risk-based system as high-risk and predicted by the fraud model to be in the 1st decile of fraud probability did the same. This confirms that deploying our fraud model in addition to the existing audit approach improves the results.
Table 4. Audit model predictions and Fraud model actual accuracy by deciles
As it can be inferred from the table, the Audit model captures quite well the current approach of the SRC.
Network Fraud Model
As mentioned above, one of our main contributions is that we find it possible to replace the historical audit and fraud information with the network behavior. For the purposes of this analysis, we nominate as the network the direct trade partners (buyers and suppliers) of the particular company. Our analysis indicates that the taxpayers having fraudulent partners are more prone to be fraudulent themselves and vice versa.
While all the transactions between the taxpayers are channeled through the electronic invoicing system, in all the situations where the transaction’s party is not final consumer, it is possible to obtain information about the counterpart, including its performance and behavior. In more technical terms, we separate the invoice data set into supplier and buyer components of the taxpayer under consideration and then obtain some aggregated features for each of these two groups. Importantly, we combine the partner information with the historical audit data set and generate new features characterizing the network fraud and audit frequency, such as the average number of fraud cases in the supplier segment. The complete set of features derived from network information is available in . It not only goes beyond the incidence of fraud in the network but also measures networks activity in terms of transaction, its size, and other related characteristics. The data are presented separately for taxpayers who are positive and negative on fraud incidence.
Table 5. Taxpayer’s network (supplier and buyer) characteristics used in the fraud model
All the data in the fraud model that pertained to historical information of the taxpayer are removed and replaced with these network data. This approach solves the issue of age bias because it enables unbiased fraud evaluation for newly opened companies, as well as already established ones. summarizes the model performance metrics of the baseline fraud model estimated, the model without historical information, and the model augmented with network data. As it can be inferred from , network information recovers the major part of predictive power as measured by ROC AUC.
Table 6. Comparison of fraud model performance with the exclusion of historical data and inclusion of taxpayer’s network information
Analysis of SHAP values similar to our baseline model confirms the assumption about importance of fraud in the network (in particular supplier) of the taxpayers.Footnote12 This might indicate that the decision of engaging into tax evasion is not always purely determined within the firm but can also be an outcome of wider equilibrium engaging a specific supply chain.
Conclusions
We have tried to develop a tax fraud classification model in an environment characterized with a number of constraints and limitations, such as high heterogeneity and a small number of taxpayers (observations) and limited data on the drivers of potential tax base.
While our baseline fraud model has relatively modest accuracy, we operationalize it by restricting attention to top decile of predicted probabilities. According to our result, the fraud rate at the top is about 1.85 times higher compared to the average observed one. Our inference framework enables us to obtain estimates of relative importance of the model features. This information can be used by the risk management division to upgrade the rules currently implemented for the risk management system and to focus on top-ranked taxpayers, thus saving resources.
More importantly, we demonstrate that using data on fraud in the immediate network of suppliers and the buyers of the taxpayer under consideration is almost as informative as its historical records on audit and its outcomes. The implication of this result is the mitigation of the bias toward suggesting tenured taxpayers that the fraud model has its reliance on historical fraud and audit information.
Our approach also has a number of important limitations. Most serious of them is the neglecting of diversity in audit typology, which eventually is also reflected in the type of fraud being identified. In this regard, we can say very little about the importance of the fraud predicted in terms of the recoverable funds for budget revenues. It also excludes the possibility to use more granular, transaction-level data, which obviously would enrich the analysis.
There are further possibilities to improve the performance of fraud classification models. One direction would be to focus on a certain type of audit and dig deeper into tax returns and their structure focusing on the respective data input fields. In addition to that, it is possible to utilize unsupervised learning techniques (De Roux et al. Citation2018) that have demonstrated to work with a homogenous taxpayers’ database. Finally, an interesting extension would be to actually investigate the results of the “natural experiment” that is currently being implemented with around 800 taxpayers being audited and compare the actual fraud rate with the one predicted by the fraud models obtained in our study.
Acknowledgments
The authors are thankful to the participants of the International Conference on Tax Compliance: New Methodological and Empirical Approaches (online, October 29-30, 2020) for useful comments and suggestions. The project benefited much from the cooperation with the State Revenue Committee (SRC) of the Republic of Armenia; in particular, we are thankful for cooperation to Former Deputy Chairman Mr. Mikayel Pashayan, SRC IT Department Head (current Deputy Chairman) Mr. Ashot Muradyan, and IT Department Head Ms. Alina Avetisyan for their full support. Finally, Ms. Meri Sakanyan’s research assistance in data acquisition and cleaning was indispensable.
Disclosure Statement
No potential conflict of interest was reported by the author(s).
Additional information
Funding
Notes
1. Firms with an annual revenue of less than a certain threshold value reported in the previous year (around USD108,000 for 2019) could opt to operate under the simplified taxation regime and instead of VAT and CIT pay unified turnover tax.
2. What we dub here fine is a combination of actual sanction payments and unpaid tax recovered.
3. Subsequently, it is trained also for 2019 and tested for 2020 data.
4. Here, we do not refer to standard feature transformations, like transforming to normality, uniform/arbitrary distribution, or variable stabilization.
5. For a structured review of literature on machine learning applications in fraud detection, an interested reader can refer to Ngai et al. (Citation2011).
6. =
=
.
7. The data set is randomly divided into two parts by assigning 75% to the train set and 25% to the test set.
8. We thank anonymous referee for the suggestion to consider these robustness checks.
9. Even if such a ranking exists at the audit rules level, auditing bodies are provided with the audit lists without such a ranking.
10. To comply with tax secrecy laws and regulations, all the data are anonymized, are stored on the premises of SRC, and cannot be provided to third parties.
11. Exact formulas for predicting variables are not provided in order not to reveal excessive information to taxpayers who can use these formulas jointly with feature importance reported below to avoid being.
12. For the sake of space, the SHAP value figure is not reported here.
13. To comply with tax secrecy regulations, not all the feature and not exact formulas are reported.
References
- Abrantes, P. C., and F. Ferraz (2016), “Big Data Applied to Tax Evasion Detection: A Systematic Review,” 2016 International Conference on Computational Science and Computational Intelligence (CSCI), 2016, Las Vegas, USA, pp. 435–985, doi: 10.1109/CSCI.2016.0089.
- Coita, I., M. Codruta, and Ș. Cioban (2021), Is Trust a Valid Indicator of Tax Compliance Behaviour? A Study on Taxpayers’ Public Perception Using Sentiment Analysis Tools. The 4th International Conference on Economics and Social Sciences Resilience and economic intelligence through digitalization and big data analytics, June 10-11, 2021 Bucharest University of Economic Studies, Romania
- Daley, S., May 2, 2010, Greeks’ Wealth Is Found in Many Places, Just Not on Tax Returns. New York Times
- Didimo, W., L. Grilli, G. Liotta, L. Menconi, F. Montecchiani, and D. Pagliuca. 2020. Combining network visualization and data mining for tax risk assessment. IEEE Access 8: pp. 16073–86. doi:10.1109/access.2020.2967974.
- Fuest, C., and N. Riedel, (2009), Tax evasion, tax avoidance and tax expenditures in developing countries: A review of the literature, Oxford University Centre for Business Taxation
- González-Martel, C., J. M. Hernández, and C. Manrique-de-lara-peñate. 2021. Identifying business misreporting in VAT using network analysis. Decision Support Systems 141: p. 113464. doi:10.1016/j.dss.2020.113464.
- González, P., and D. Velásquez. 2013. Characterization and detection of taxpayers with false invoices using data mining techniques. Expert Systems with Applications 40 (5): pp. 1427–36. doi:10.1016/j.eswa.2012.08.051.
- Höglund, H. 2017. Tax payment default prediction using genetic algorithm-based variable selection. Expert Systems with Applications 88: pp. 368–75. doi:10.1016/j.eswa.2017.07.027.
- Hooda, N., S. Bawa, and P. S. Rana. 2019. Optimizing fraudulent firm prediction using ensemble machine learning: A case study of an external audit. Applied Artificial Intelligence 34 (1): pp. 20–30. doi:10.1080/08839514.2019.1680182.
- Khwaja, M., and I. Iyer (2014). Revenue Potential, Tax Space, and Tax Gap: A Comparative Analysis. Policy Research Working Paper; No. 6868. World Bank, Washington, DC.
- Kim, Y. J., B. Baik, and S. Cho. 2016. Detecting financial misstatements with fraud intention using multi-class cost-sensitive learning. Expert Systems with Applications 62: pp. 32–43. doi:10.1016/j.eswa.2016.06.016.
- Matos, T., J. A. Macedo, F. Lettich, J. M. Monteiro, C. Renso, R. Perego, and F. M. Nardini. 2020. Leveraging feature selection to detect potential tax fraudsters. Expert Systems with Applications 145: p. 113128. doi:10.1016/j.eswa.2019.113128.
- Mittal, S., O. Reich, and A. Mahajan (2018). Who is Bogus? Proceedings of the 1st ACM SIGCAS Conference on Computing and Sustainable Societies (COMPASS) - COMPASS ‘18, Menlo Park and San Jose CA USA. doi:10.1145/3209811.3209824
- Ngai, E. W. T., Y. Hu, Y. H. Wong, Y. Chen, and X. Sun. 2011. The application of data mining techniques in Financial Fraud Detection: A Classification Framework and an academic review of literature. Decision Support Systems 50 (3): pp. 559–69. doi:10.1016/j.dss.2010.08.006.
- Rahimikia, E., S. Mohammadi, T. Rahmani, and M. Ghazanfari. 2017. Detecting corporate tax evasion using a hybrid intelligent system: A case study of Iran. International Journal of Accounting Information Systems 25: pp. 1–17. doi:10.1016/j.accinf.2016.12.002.
- Roux, D., B. Pérez, A. Moreno, M. P. Villamil, and C. Figueroa, (2018). Tax Fraud Detection for Under-Reporting Declarations Using an Unsupervised Machine Learning Approach. In KDD ’18: The 24th ACM SIGKDD International Conference on
- Srivastava, S., July 28, 2017, Holiday Posts on Instagram Are Tipping Off India’s Taxman, Bloomberg, https://www.bloomberg.com/news/articles/2017-07-27/instagram-posts-willsoonhelp-sniff-out-tax-evaders-in-India
- Vanhoeyveld, J., D. Martens, and B. Peeters. 2020. Value-added tax fraud detection with scalable anomaly detection techniques. Applied Soft Computing 86: p. 105895. doi:10.1016/j.asoc.2019.105895.
- World Bank, 2019. “Doing Business 2019,” World Bank Publications, The World Bank, number 30438, June.
- World Bank, 2020, World Development Indicators.
Appendix
Table A1. NACE Rev. 2 economic activity code key for
Appendix
Table A2. Feature definitionsFootnote13
Appendix
Table A3. Results of Audit Classification models
Appendix
Table A4. Robustness: Alternative definitinos of target fraud variable