
 ?Mathematical formulae have been encoded as MathML and are displayed in this HTML version using MathJax in order to improve their display. Uncheck the box to turn MathJax off. This feature requires Javascript. Click on a formula to zoom.
ABSTRACT
Land Cover or Land Use (LCLU) classification is an important, challenging problem in remote sensing (RS) images. RS image classification is a recent technology used to extract hidden information from remotely sensed images in the observed earth environment. This classification is essential for sustainable development in agricultural decisions and urban planning using deep learning (DL) methods. DL gets more attention for accuracy and performance improvements in large datasets. This paper is aimed to apply one of the DL methods called transfer learning (TL). TL is the recent research problem in machine learning and DL approaches for image classification. DL consumes much time for training when starting from scratch. This problem could be overcome in the TL modeling technique, which uses pre-trained models to build deep TL models efficiently. We applied the TL model using bottleneck feature extraction from the pre-trained models: InceptionV3, Resnet50V2, and VGG19 to LCLU classification in the UC Merced dataset. With these experiments, the TL model has been built the outdate performance of 92.46, 94.38, and 99.64 in Resnet50V2, InceptionV3, and VGG19, respectively.
Introduction
Land cover is variable and dynamic on the earth’s surface (Abdu Citation2019), whereas land use is the intervention of human activities on the earth. Land cover is the earth’s surface covered by physical features like forest, river, vegetation, or others. In contrast, land use is the ability of a human to use natural resources for various purposes (Cao, Dragićević, and Li Citation2019). Thus, land cover and land use (LCLU) describe the earth’s features and human interaction. Classification is needed in the land cover mapping (Fang et al. Citation2019; Stivaktakis, Tsagkatakis, and Tsakalides Citation2019; Tong et al. Citation2020) and land use resource management (Cao, Dragićević, and Songnian Citation2019; Castelluccio et al. Citation2015; Hung, Wu, and Tseng Citation2020). LCLU classification is an important, challenging task (Huang et al. Citation2021), and it contributes to agricultural decision-making and urban forecasting on the earth observation environment for sustainable development. This classification problem will be solved using transfer learning (TL) models in remote sensing (RS) images.
RS images are earth observation geospatial data and records of environmental information. RS data face the “big data” challenges and some new challenges for DL as they raise exceptional problems to new scientific questions (X. X. Zhu et al. Citation2017). RS imagery data classification is a significant problem in various domains (X. Liu et al. Citation2019; Deng et al. Citation2019; Abdu Citation2019; Yao et al. Citation2019; Cheng et al. Citation2020; W. Zhang, Tang, and Zhao Citation2019; Shabbir et al. Citation2021; D. Zhang, Liu, and Shi Citation2020; Alam et al. Citation2021). Thus, our consideration of classification was one of the major research problems in RS imagery data. Nowadays, researchers explored the application of DL to confrontation these challenges.
Deep learning (DL) gets more attention for the LCLU classification problem in RS images (Vali, Comai, and Matteucci Citation2020). The DL approaches could extract the earth’s features from remotely sensed imagery data to manage the earth’s environment by properly utilizing deep classification systems. DL algorithms are calling focuses on their automatic learning ability from large datasets (Côté-Allard et al. Citation2019; X. Liu et al. Citation2019; Li et al. Citation2019; Deng et al. Citation2019; Das et al. Citation2019; Xie et al. Citation2016; Bahri et al. Citation2020; X. Pan et al. Citation2018; W. Zhao et al. Citation2015; X. X. Zhu et al. Citation2017; Yao et al. Citation2019; Rashid et al. Citation2020; Weinstein et al. Citation2019; Cheng et al. Citation2020).
In recent studies, the DL methods, especially CNNs, are widely used in RS image classification for their outstanding performance and accuracy (Marmanis et al. Citation2016; Das et al. Citation2019; W. Zhang, Tang, and Zhao Citation2019; Vali, Comai, and Matteucci Citation2020; Rashid et al. Citation2020). However, DL algorithms could take more time and complexity, creating over-fitting (Das et al. Citation2019; B. Zhao, Huang, and Zhong Citation2017; Rostami et al. Citation2019; Hung, Hui-ching, and Tseng Citation2020; Zou and Zhong Citation2018) when training the DL models from scratch. TL, the innovative DL model in machine learning, could overtake this problem because TL is an optimization technique used to thrift the processing time, superior performance, or accuracy (Kumar, Naman, and Verma Citation2021).
Thus, TL could apply formerly learned techniques to resolve new problems efficiently (Chen, Zhang, and Ouyang Citation2018). Nowadays, TL has gotten increasing attention lately for reducing training time for large datasets (Das et al. Citation2019; Weiss, Khoshgoftaar, and Wang Citation2016; Scott et al. Citation2017; Lima and Marfurt Lima and Marfurt, Citation2020; Y. Zhu et al. Citation2011; X. Zhang, Guo, and Zhang Citation2020).
The TL models could be applied in various RS domains. For instance, it has been applied for forest variable estimation (Astola et al. Citation2021); for object (airplane) detection (Chen, Zhang, and Ouyang Citation2018; M. Zhu et al. Citation2019); for poverty mapping (Xie et al. Citation2016); for labeling the Synthetic Aperture Radar (SAR) (Rostami et al. Citation2019); for change analysis (Qian et al. Citation2020); and marsh vegetation classification (M. Liu et al. Citation2021).
Related work has been tried to investigate CNN-based TL model on the domain area. Few researchers (Mahdianpari et al. Citation2018; B. Zhao, Huang, and Zhong Citation2017; S. J. Pan and Yang Citation2010; Marmanis et al. Citation2016; Zou and Zhong Citation2018; X. Zhang, Guo, and Zhang Citation2020; Lima and Marfurt Citation2020; Shabbir et al. Citation2021) have investigated CNN-based models using pre-trained architectures on RS image classification. Using TL, the LCLU classification problem was investigated by (Naushad and Kaur Citation2021; D. Zhang, Liu, and Shi Citation2020) using TL. However, TL in RS has not been widely explored yet (Astola et al. Citation2021), especially in the LCLU classification. Thus, we applied deep neural network-based TL (Li et al. Citation2019) in LCLU classification using RS image.
Our motivation was to apply the deep TL model with pre-trained models for the LCLU classification in RS images and improve the performance efficiently. We have listed the related papers with their recommendations in our previous work (Alem and Kumar Citation2020). Therefore, we also were motivated to investigate the recommended pre-trained networks suggested by (Marmanis et al. Citation2016; Stivaktakis, Tsagkatakis, and Tsakalides Citation2019).
Our objective in this paper was to apply the deep TL models and improve their performance efficiently for LCLU classification in RS images. To achieve this objective, we followed the procedures: preprocessed the UCM imagery data, extracted the image features using the bottleneck feature extraction technique, and modeled the TL with four sequential layers (flatten, dense, two activations (ReLu and softmax) and dropout layers), and evaluated using a confusion matrix.
Our contributions in this paper were:
Applying deep TL method on RS imagery data for LCLU classification problem;
performed LCLU classification problem in RS using three TL architectures (ResNet50V2, VGG19, and InceptionV3) with a bottleneck feature extraction technique on the UCM dataset,
evaluated and improved the performance of the TL models efficiently
Methods
This study proposed the Deep TL method, which is a deep CNN technique, for efficient time-consuming. Building the model for better performance uses various parameters, such as pre-trained models, learning rate, early stopping, dropout, optimizer, loss, and activation functions.
Pre-trained models have become recent applications in RS image classification problems (Risojevic and Stojnic Citation2021; Rashid et al. Citation2020; D. Zhang, Liu, and Shi Citation2020; Marmanis et al. Citation2016; Stivaktakis, Tsagkatakis, and Tsakalides Citation2019). The pre-trained CNN based (Kumar, Naman, and Verma Citation2021) TL models used in this paper included ResNet50V2 (He et al. Citation2016; Shabbir et al. Citation2021), VGG19 (Mateen et al. Citation2019; Simonyan and Zisserman Citation2015; Xiao et al. Citation2020), and InceptionV3 (Szegedy et al. Citation2015a, Citation2015b). These pre-trained architectures are the deep CNN pre-trained models used to design a new TL model from the existing problem.
Learning rate (LR) was used to facilitate the TL model learning from the UCM dataset. It has various values such as 0.01, 0.001, and 0.0001. However, if the larger TR is used, the fluctuation of training and learning could happen (Naushad and Kaur Citation2021). Therefore, the smaller TR value is advisable to be used in building DL models. So, we used the TR of 0.0001 in this paper to optimize our model.
Reducing over-fitting in the DL method is dynamic. Dropout and early stopping are the major parameters used for reducing overfitting when training data. The percentage values for dropout expressed in decimal forms are usually recommended to use 0.2, 0.3, 0.4, and 0.5. We used 0.5 (i.e.50%) to reduce the training over-fitting since higher dropout could perform better than lower values (Stivaktakis, Tsagkatakis, and Tsakalides Citation2019). Early stopping is a deep CNN regularization technique used to stop the training after random epochs when the model performance could not improve (Naushad and Kaur Citation2021).
In DL modeling techniques, classification loss functions are widely used. This classification loss could be binary cross-entropy or multi-class cross-entropy. We preferred the multi-class entropy loss function since our class is multi-classes of the RS images.
Activation functions could be used afterward for each convolutional layer to raise the neural network capability (Yao et al. Citation2019). ReLu (Nair and Hinton Citation2010) and softmax (Mahdianpari et al. Citation2018) activation functions were applied in this paper because they are more advantageous than other conventional nonlinear functions, such as tanh and sigmoid functions. ReLu and softmax are better in their easily propagating errors; multiple layers of the neurons have been activated and simpler mathematical operation than that of tanh and sigmoid functions.
ReLu generates an output x if x > 0 or 0 if x < 0 as observed in (Equationequation 1(1)
(1) and ). This output implies that the neurons with the negative values are not activated except those with positive values. The slope of the gradient (derivative) value of ReLu is constant, i.e., ether 1 ∀x, x ≥ 0 or 0 ∀x, x < 0 (Equationequation 2
(2)
(2) and )
Figure1. ReLu function graphical representation. a) Forward propagation b) gradient descent propagation (derivative).
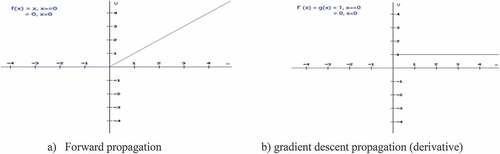
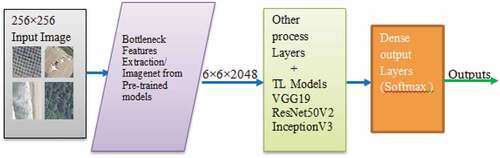
Figure2. Sample input images feeding into pre-processing.
Softmax (softargmax) is used to predict the class having the highest probability in multi-class classification problems for the input labels. We also used this function since our RS imagery data is a multi-class classification problem. The softmax output is between 0 and 1, and the sum of each class probability is 1.0. If some N elements of the input vector are N <0 or N > 1, they would be between (0, 1) after using the softmax function. Its equation over N classes is computed in the Equationequation (3)
(3)
(3) given.
In summary of the method, the parameters such as networks and weights were trained in the pre-trained InceptionV3, Resnet50V2, and VGG19 models. We used the bottleneck feature extraction method to extract image features from these pre-trained models. A fully connected network for pre-trained models was removed, and then a new model was built, and its weights were also removed. The bottleneck features, become the inputs for FC, are trained for UCM images (). The bottleneck feature extracted the features of shape (1264, 6, 6, 2048) in training bottleneck prediction and shape of the features (420, 6, 6, 2048) on validation and testing bottleneck predictions extracted for each pre-trained model.
Experiments and Performance Evaluations
The experiments were performed on a laptop with the Intel Core i3-4000 M CPU 2.40 GHz 2.40 GHz RAM = 4GB and in Colaboratory with its GPU in Keras and Tensorflow software packages.
Experimental Datasets Setting
The University of California Merced (UCM) data set is used to solve the problem of LCLU classification. The UCM Land Use data set was manually collected and introduced by (Yang and Newsam Citation2010) from the USGS National Map Urban Area Imagery. This dataset consists of 21 land use and land cover classes containing 100 images each, measuring 256 × 256 pixels with a spatial resolution of about 30 cm/pixel. The dataset was divided into 60:20:20 ratio for training samples, validation samples, and tasting samples for each class, respectively ().
Table 1. Parameter setting for UCM dataset
Experimental Setting
As we discussed in section 2 earlier, various hyperparameters do have important inspirations for classification problems. So, we have used some of the important parameters in our experiment listed in . In addition to using the dropout (0.5) layer, we used the early stopping technique to reduce the over-fitting.
Table 2. Hyperparameters setting for training data
Performance Evaluation Measurements
The model’s performance is evaluated using a confusion matrix (CM) and overall accuracy (OA). CM analyzes errors and confusion between the column with the occurrences in a predicted class and the row with the occurrences in an actual class (W. Zhang, Tang, and Zhao Citation2019). So, CM could also be named as an error matrix since it classifies the error classification.
The errors could be type I error and type II error (). A type I error is an outcome where the model incorrectly predicts the positive class when it is the actual negative value. In contrast, a type II error is an outcome where the model incorrectly predicts the negative class when it is the actual positive value. We combined the training and validation trained data after validating the model during the process and then evaluating the model’s performance with 20% of testing data. CM measures the performance of the TL model, whether it is classified correctly or incorrectly.
Table 3. Confusion matrix in summarized view
We used the classification metrics to calculate the model’s performance: accuracy, recall, precision, and F1 measures.
Accuracy is the measure of predictions that the model classified correctly.
Precision computes a positive predictive value, i.e., a quantity of the relevant classes among the retrieved classes. It evaluates what amount of positive identifications was actually correct.
A recall is used to identify all actual correct relevant classes retrieved from the dataset.
F1 score is the harmonic mean of precision and recall. Its score becomes 1 when both precision and recall are perfect and becomes 0 when either precision or recall result becomes 0. F1 score measures the preciseness and robustness of the classification model.
TL Models Evaluation Using Measurements
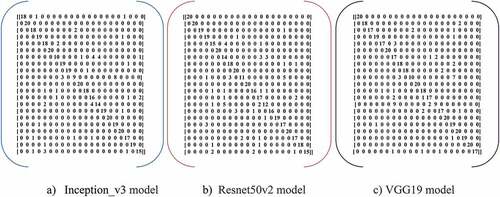
There are N (N = 21) classes with an integer labeled 0 to N-1. The generated records were transformed into a confusion matrix (). The three TL models generated the class label records for 21 classes ranging from 0 to 20 while testing each class with 20 samples. For instance, in the Inception_v3 model in , the first-class labeled with 0, among 20 testing samples, 18 classes are correctly classified, but the other two classes, i.e., the actual classes 3 and 18, are predicted as class 1.
Figure 3. Confusion matrix of each model on UC merced dataset. a) Inception_v3 model b) Resnet50v2 model c) VGG19 model.
Based on the confusion matrix () records, the performance of TL with the Inception_v3 model has been calculated and recorded in . Similarly, the performance of TL with the resnet50v2 and VGG19 models have been measured in based on the confusion matrix (), respectively.
Table 4. Inception_v3 model for class performances in precision, recall and F1-score
Table 5. Resnet50v2 model for class performances in precision, recall, and F1-score
Table 6. VGG19 model for class performances in precision, recall, and F1-score
The accuracies of the three TL models for training and validation data are shown in
Figure4. Accuracies in Training vs. Validation for TL classification models. a) Accuracy of resnet50V2 b) Accuracy of inceptionV3 c) Accuracy in VGG19.
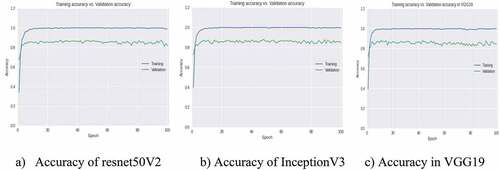
Table 7. Number of early stopping at epoch #, time is taken for training and overall accuracy in the three models
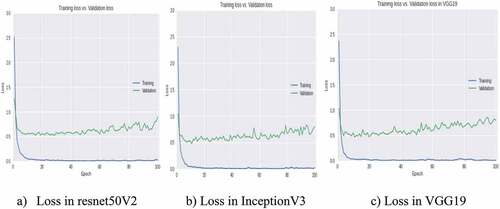
The categorical-cross-entropy loss function was used while compiling the model. For the correct class, the value of the loss function becomes closer to 0 ().
Figure 5. Losses in Training vs. Validation for TL classification models. a) Loss in resnet50V2 b) Loss in inceptionV3 c) Loss in VGG19.
Discussions
Discussions on Results, Methods, and TL Performances
The experiments resulted in section 3 prove that the pre-trained models are applicable in LCLU classification in RS images. The accuracy is also our aim, and we got better results in each model and most individual classes. We evaluated each class’s accuracies using precision, recall, and F1-score measurements for each model. Precision is outperformed, i.e., 88%, 88%, and 90% for all the three models (). That means the relevant classes were retrieved and predicted correctly. If F1-score is perfect (1), i.e., 100% accurate for certain classes, precision, and recall are also perfect for all classes.
As seen in for the Inception_v3 model, the classes such as agricultural, airplane, chaparral, freeway, overpass, and parking were best-performed precision. In contrast, medium residential was performed the poorest result, i.e., 64% precision result. Airplane, chaparral, harbor, parking lot, and runway classes were best-performed recall while golf course and dense residential were performed the worst results, i.e., 45% and 50% recall result, respectively. Moreover, the classes such as airplane, chaparral, and parking lot are best accurate in f1-score while dense golf course (56%) and residential (59%) are the poorest. For similar situations, we grouped classes in their best or worst/poorest value under each Resenet50v2 and VGG19 model measurement in .
Table 8. The best and worst class accuracies in precision, recall, and F1-score measurements
The poorest precision results in the medium residential and dense residential classes and the poorest recall result in the golf course are observed in all three models. The results of the poorest accuracy could be the cause of the image variant similarity and resolution differences.
By applying the hyperparameters listed in , the TL model has been modeled using the Adam optimizer with TR of 0.0001 and compiled with the loss function of categorical-cross-entropy. The loss function predicts an integer value for each class N assigned from 0 to N-1, where N =21 classes in the UCM dataset. The cross-entropy loss has become lower and lower for the deeper network training process to identify the correct class. A correct cross-entropy value is 0 for a correct class. The value of the cross-entropy loss function increases for misclassified classes, and the trained network fails to find the correct class (Bahri et al. Citation2020). In , the training loss graph with blue color is closer to 0. So, the trained network is good for predicting the correct class in TL.
In addition to dropout, we used the early stopping technique to reduce overfitting and improve performance. The training was stopped early either the performance of the validation loss stopped decreasing even though the performance of the training loss decreased, or the performance of the validation accuracy stopped increasing although the performance of the training accuracy increased. We assigned the epoch value 100, and the early stopping stopped at epoch 19, 18, and 95 randomly when validation loss stopped decreasing for Resnet50v2, InceptionV3, and VGG19, respectively. Mostly we observed that the larger early stopping resulted, the larger the accuracy, for instance, VGG19 in this study.
Therefore, VGG19 has superior TL model performance. As seen from , the VGG19 model achieved the superior accuracy of 99.64% for a 70% training ratio among all methods.
Discussions on Similar Studies
In this paper, we utilize the Resnet50V2, Inception‐V3, and VGG‐19 as our baselines. We compared the classification performance accuracy of this paper with the UCM dataset’s state-of-the-art classification studies (). According to , all the proposed TL models achieved superior accuracy among the state-of-the-arts. We used the Adaptive optimizer with the smallest LR value, i.e., 0.0001 while the others used stochastic gradient descent (SGD) with various parameters. Most of the researchers listed in have used the epoch number 50, but we have used 100 epochs and early stopping while validating the model.
Table 9. Comparative state-of-the-art classification methods and OA (in %) on the UCM dataset
Therefore, the proposed VGG19 achieved the superior accuracy of 99.64% for a 70% training ratio among all methods we used. The Resnet50v2 model results in lower performance than the other two methods. The results in the three pre-trained models demonstrate that the TL model can prove its availability on RS images.
Conclusions
In this paper, we addressed the problem of LCLU classification in RS images using deep TL models with the bottleneck feature extraction. Our objective was to apply the TL model and improve the classification performance for LCLU classification in RS images. The training time of TL is more efficient (trained in seconds) than the other deep CNN models (trained in days when they trained from scratch), as observed in the state-of-the-arts study by(Mahdianpari et al. Citation2018; Rashid et al. Citation2020). We used the bottleneck feature extraction method from pre-trained models to improve the model’s training speed and accuracy.
The model’s performance is also prominent in all models, i.e., 92.46%, 94.36%, 99.64% accuracy results for Resnet50V2, Inception‐V3, and VGG‐19, respectively. However, the superior accuracy is profound in the VGG19 model with efficient time. Most of the classes’ performance is prominent accuracies except for some classes such as the medium residential, dense residential classes, and golf course, which have the poorest accuracies when evaluated by precision, recall, and F1-score.
LCLU classification in RS image contributes significant values (Alshari and Gawali Citation2021; Lima and Marfurt Lima and Marfurt, Citation2020) to decision-making and planning in rural and urban areas. Our contribution is applying the deep TL using bottleneck feature extraction for the LCLU classification problem using RS image. This contribution directs environmental resource management and sustainable development for agricultural and urban planning. In addition to this contribution, we evaluated and improved the performance of the TL models and proved their availability on the LCLU classification in RS images.
For further investigation, we will use more recent deep neural networks with various pre-trained architectures as our baseline to substantiate the effectiveness of TL pre-trained models on various datasets and parameters.
Acknowledgments
The Ethiopian Ministry of Education (MOSHE) co-op with Debre Tabor University has financially supported this research. The authors acknowledged these institutions heartily.
The authors would like to give special thanks to the reviewers, editors, and editorial assistant of the Applied Artificial Intelligence journal for their precious, pertinent, and constructive reviews and comments to increase the manuscript quality.
Disclosure Statement
No potential conflict of interest was reported by the author(s).
References
- Abdu, H. A. 2019. Classification accuracy and trend assessments of land cover- land use changes from principal components of land satellite images. International Journal of Remote Sensing 40 (4):1275–1322. doi:10.1080/01431161.2018.1524587.
- Alam, M. M., M. Gazuruddin, N. Ahmed, A. Motaleb, M. Rana, R. R. Shishir, S. Yeasmin, and R. M. Rahman. 2021. Classification of deep-SAT images under label noise. Applied Artificial Intelligence 35 (14):1196–218. doi:10.1080/08839514.2021.1975381.
- Alem, A., and S. Kumar. 2020. “Deep learning methods for land cover and land use classification in remote sensing: a review.” ICRITO 2020 - IEEE 8th International Conference on Reliability, Infocom Technologies and Optimization (Trends and Future Directions), no. Amity University, Noida, India. June 4-5, 2020: 903–08. 10.1109/ICRITO48877.2020.9197824.
- Alshari, E. A., and B. W. Gawali. 2021. Development of Classification System for LULC Using Remote Sensing and GIS. Global Transitions Proceedings 2 (1):8–17. doi:10.1016/j.gltp.2021.01.002.
- Astola, H., L. Seitsonen, E. Halme, M. Molinier, and A. Lönnqvist. 2021. Deep neural networks with transfer learning for forest variable estimation using sentinel-2 Imagery in boreal forest. Remote Sensing 13 (12):2392. doi:10.3390/rs13122392.
- Bahri, A., S. G. Majelan, S. Mohammadi, M. Noori, and K. Mohammadi. 2020. Remote sensing image classification via improved cross-entropy loss and transfer learning strategy based on deep convolutional neural networks. IEEE Geoscience and Remote Sensing Letters 17 (6):1087–91. doi:10.1109/LGRS.2019.2937872.
- Cao, C., S. Dragićević, and L. Songnian. 2019. Land-use change detection with convolutional neural network methods. Environments - MDPI 6 (2). doi: 10.3390/environments6020025.
- Castelluccio, M., G. Poggi, C. Sansone, and L. Verdoliva. 2015. Land use classification in remote sensing images by convolutional neural networks. ArXiv Preprint arXiv: 1508.00092v1 .
- Chen, Z., T. Zhang, and C. Ouyang. 2018. End-to-end airplane detection using transfer learning in remote sensing images. Remote Sensing 10 (1):1–15. doi:10.3390/rs10010139.
- Cheng, G., X. Xie, J. Han, L. Guo, and G. S. Xia. 2020. Remote sensing image scene classification meets deep learning: challenges, methods, benchmarks, and opportunities. IEEE Journal of Selected Topics in Applied Earth Observations and Remote Sensing 13:3735–56. doi:10.1109/JSTARS.2020.3005403.
- Côté-Allard, U., C. L. Fall, A. Drouin, A. Campeau-Lecours, C. Gosselin, K. Glette, F. Laviolette, and B. Gosselin. 2019. Deep learning for electromyographic hand gesture signal classification using transfer learning. IEEE Transactions on Neural Systems and Rehabilitation Engineering 27 (4):760–71. doi:10.1109/TNSRE.2019.2896269.
- Das, A., R. Giri, G. Chourasia, and A. Anilet Bala. 2019. “Classification of retinal diseases using transfer learning approach.” Proceedings of the 4th International Conference on Communication and Electronics Systems, ICCES 2019, 17-19 July 2019 Coimbatore, India. IEEE: 2080–84. 10.1109/ICCES45898.2019.9002415.
- Deng, C., Y. Xue, X. Liu, L. Chao, and D. Tao. 2019. Active transfer learning network: a unified deep joint spectral-spatial feature learning model for hyperspectral image classification. IEEE Transactions on Geoscience and Remote Sensing 57 (3):1741–54. doi:10.1109/TGRS.2018.2868851.
- Fang, B., R. Kou, L. Pan, and P. Chen. 2019. Category-sensitive domain adaptation for land cover mapping in aerial scenes. Remote Sensing 11 (22):2631. doi:10.3390/rs11222631.
- He, K., X. Zhang, S. Ren, and J. Sun. 2016. “Deep residual learning for image recognition.” In 2016 IEEE Conference on Computer Vision and Pattern Recognition, 27-30 June 2016 (IEEE) Las Vegas, NV, USA, 770–78. doi:10.1109/CVPR.2016.90.
- Huang, Z., C. O. Dumitru, Z. Pan, B. Lei, and M. Datcu. 2021. Classification of large-scale high-resolution SAR images with deep transfer learning. IEEE Geoscience and Remote Sensing Letters 18 (1):107–11. doi:10.1109/LGRS.2020.2965558.
- Hung, S.-C., W. Hui-ching, and M.-H. Tseng. 2020. Remote sensing scene classification and explanation using RSSCNet and LIME. Applied Sciences 10 (18):6151. doi:10.3390/app10186151.
- Kumar, S., M. T. Naman, and P. Verma. 2021. “Covid detection from X-RAY and CT scans using transfer learning – A study.” In Proceedings of the International Conference on Artificial Intelligence and Smart Systems (ICAIS-2021) 25-27 March 2021, Coimbatore, India: IEEE, 85–92 doi:10.1109/ICAIS50930.2021.9395784.
- Li, S., W. Song, L. Fang, Y. Chen, P. Ghamisi, and J. Benediktsson. 2019. Deep learning for hyperspectral image classification: an overview. IEEE Transactions on Geoscience and Remote Sensing. 57 (9):6690–709. doi:10.1109/TGRS.2019.2907932.
- Lima, R. P. D., and K. Marfurt. 2020. Convolutional neural network for remote-sensing scene classification: transfer learning analysis. Remote Sensing 12 (1):86. doi:10.3390/rs12010086.
- Liu, M., F. Bolin, D. Fan, P. Zuo, S. Xie, and H. Hongchang. 2021. Study on transfer learning ability for classifying marsh vegetation with multi-sensor images using DeepLabV3+ and HRNet deep learning algorithms. International Journal of Applied Earth Observations and Geoinformation 103:102531. doi:10.1016/j.jag.2021.102531.
- Liu, X., R. Wang, Z. Cai, Y. Cai, and X. Yin. 2019. Deep multigrained cascade forest for hyperspectral image classification. IEEE Transactions on Geoscience and Remote Sensing 57 (10):8169–83. doi:10.1109/TGRS.2019.2918587.
- Mahdianpari, M., B. Salehi, M. Rezaee, F. Mohammadimanesh, and Y. Zhang. 2018. Very deep convolutional neural networks for complex land cover mapping using multispectral remote sensing imagery. Remote Sensing 10 (7):7. doi:10.3390/rs10071119.
- Marmanis, D., M. Datcu, T. Esch, U. Stilla, S. Member, and S. Member. 2016. Deep learning earth observation classification using ImageNet pretrained networks. IEEE Geoscience and Remote Sensing Letters 13 (1):105–09. doi:10.1109/LGRS.2015.2499239.
- Mateen, M., J. Wen, S. S. Nasrullah, and Z. Huang. 2019. Fundus image classification using VGG-19 Architecture with PCA and SVD. Symmetry 11 (1):1. doi:10.3390/sym11010001.
- Nair, V., and G. E. Hinton. 2010. “Rectified linear units improve restricted Boltzmann machines.” In Proceedings of the 27th International Conference on International Conference on Machine Learning, Haifa, Israel,21–24 June 2010, 807–14. doi:10.1123/jab.2016-0355.
- Naushad, R., and T. Kaur. 2021. “Deep transfer learning for land use land cover classification: a comparative study.” ArXiv:2110.02580v2, Online Available at Https://Arxiv.Org/Abs/2110.02580
- Pan, S. J., and Q. Yang. 2010. A Survey on Transfer Learning. IEEE Transactions on Knowledge and Data Engineering 22 (10):1345–59. doi:10.1109/TKDE.2009.191.
- Pan, X., J. Wang, X. Zhang, Y. Mei, L. Shi, and G. Zhong. 2018. A deep-learning model for the amplitude inversion of internal waves based on optical remote-sensing images. International Journal of Remote Sensing 39 (3):607–18. doi:10.1080/01431161.2017.1390269.
- Qian, Y., W. Zhou, W. Yu, L. Han, W. Li, and W. Zhao. 2020. Integrating backdating and transfer learning in an object-based framework for high resolution image classification and change analysis. Remote Sensing 12 (24):4094. doi:10.3390/rs12244094.
- Rashid, M., M. A. Khan, M. Alhaisoni, S.-H. Wang, S. R. Naqvi, A. Rehman, and T. Saba. 2020. A sustainable deep learning framework for object recognition using multi-layers deep features fusion and selection. Sustainability (Switzerland) 12 (12):5037. doi:10.3390/su12125037.
- Risojevic, V., and V. Stojnic. 2021. The role of pre-training in high-resolution remote sensing scene classification. ArXiv:2111.03690v1 14 (8):1–10.
- Rostami, M., S. Kolouri, E. Eaton, and K. Kim. 2019. Deep transfer learning for few-shot SAR image classification. Remote Sensing 11 (11):1374. doi:10.3390/rs11111374.
- Scott, G. J., M. R. England, W. A. Starms, R. A. Marcum, and C. H. Davis. 2017. Training deep convolutional neural networks for land-cover classification of high-resolution imagery. IEEE Geoscience and Remote Sensing Letters 14 (4):549–53. doi:10.1109/LGRS.2017.2657778.
- Shabbir, A., N. Ali, J. Ahmed, B. Zafar, A. Rasheed, M. Sajid, A. Ahmed, and S. H. Dar. 2021. Satellite and scene image classification based on transfer learning and fine tuning of ResNet50. Mathematical Problems in Engineering 2021. doi:10.1155/2021/5843816.
- Simonyan, K., and A. Zisserman. 2015. “Very deep convolutional networks for large-scale image recognition.” ArXiv Preprint ArXiv:1409.1556.
- Stivaktakis, R., G. Tsagkatakis, and P. Tsakalides. 2019. Deep learning for multilabel land cover scene categorization using data augmentation. IEEE Geoscience and Remote Sensing Letters 16 (7):1031–35. doi:10.1109/LGRS.2019.2893306.
- Szegedy, C., V. Vanhoucke, S. Ioffe, and J. Shlens. 2015b. “Rethinking the inception architecture for computer vision.” ArXiv:1512.00567v3.
- Szegedy, C., W. Liu, Y. Jia, P. Sermanet, S. Reed, A. Rabinovich, D. Earhan, V. Vanhoucke, and A. Rabinovich. 2015a. Going deeper with convolutions. ArXiv: 1409.4842v1 .
- Tong, X.-Y., G.-S. Xia, Q. Lu, H. Shen, S. Li, S. You, and L. Zhang. 2020. Land-cover classification with high-resolution remote sensing images using transferable deep models. Remote Sensing of Environment 237 (February 2020):111322. doi:10.1016/j.rse.2019.111322.
- Vali, A., S. Comai, and M. Matteucci. 2020. Deep learning for land use and land cover classification based on hyperspectral and multispectral earth observation data: a review. Remote Sensing 12 (15):2495. doi:10.3390/rs12152495.
- Weinstein, B. G., S. Marconi, S. Bohlman, A. Zare, and E. White. 2019. Individual tree-crown detection in Rgb imagery using semi-supervised deep learning neural networks. Remote Sensing 11 (11):1309. doi:10.3390/rs11111309.
- Weiss, K., T. M. Khoshgoftaar, and D. D. Wang. 2016. A survey of transfer learning. Journal of Big Data 3 (1): 270–279 . doi:10.1186/s40537-016-0043-6.
- Xiao, J., J. Wang, S. Cao, and L. Bilong. 2020. Application of a novel and improved VGG-19 network in the detection of workers wearing masks. Journal of Physics. Conference Series 1518 (2020):12041. doi:10.1088/1742-6596/1518/1/012041.
- Xie, M., N. Jean, M. Burke, D. Lobell, and S. Ermon. 2016. “Transfer learning from deep features for remote sensing and poverty mapping .” ArXiv: 1510.00098v2.
- Yang, Y., and S. Newsam. 2010. “Bag-of-visual-words and spatial extensions for land-use classification.” GIS: Proceedings of the ACM International Symposium on Advances in Geographic Information Systems, no. November 2-5, San Jose, CA, USA: 270–79. 10.1145/1869790.1869829.
- Yao, Y., H. Zhao, D. Huang, and Q. Tan. 2019. “Remote sensing scene classification using multiple pyramid pooling.” International Archives of the Photogrammetry, Remote Sensing and Spatial Information Sciences: Photogrammetric Image Analysis & Munich Remote Sensing Symposium XLII-2/W16 (18-20 September,2019, Munich, Germany).
- Zhang, D., Z. Liu, and X. Shi. 2020. “Transfer learning on efficientnet for remote sensing image classification.” In Proceedings - 2020 5th International Conference on Mechanical, Control and Computer Engineering, ICMCCE 2020, 25-27 Dec. 2020, Harbin, China, 2255–58. doi:10.1109/ICMCCE51767.2020.00489.
- Zhang, W., P. Tang, and L. Zhao. 2019. Remote Sensing Image Scene Classification Using CNN-CapsNet. Remote Sensing 11 (5):494. doi:10.3390/rs11050494.
- Zhang, X., Y. Guo, and X. Zhang. 2020. “Deep convolutional neural network structure design for remote sensing image scene classification based on transfer learning.” In IOP Conf. Series: Earth and Environmental Science 569 (2020) 012046 IOP, United Kingdom (Online), 012046. doi:10.1088/1755-1315/569/1/012046.
- Zhao, B., B. Huang, and Y. Zhong. 2017. Transfer learning with fully pretrained deep convolution networks for land-use classification. IEEE Geoscience and Remote Sensing Letters 14 (9):1436–40. doi:10.1109/LGRS.2017.2691013.
- Zhao, W., Z. Guo, J. Yue, X. Zhang, and L. Luo. 2015. On combining multiscale deep learning features for the classification of hyperspectral remote sensing imagery. International Journal of Remote Sensing 36 (13):3368–79. doi:10.1080/2150704X.2015.1062157.
- Zhu, M., Y. Xu, S. Ma, L. Shuai, H. Ma, and Y. Han. 2019. Effective airplane detection in remote sensing images based on multilayer feature fusion and improved nonmaximal suppression algorithm. Remote Sensing 11 (9):1062. doi:10.3390/rs11091062.
- Zhu, X. X., D. Tusia, L. Mou, G.-S. Xia, L. Zhang, F. Xu, and F. Fraundorfer. 2017. Deep learning in remote sensing: a comprehensive review and list of resources. IEEE Geoscience and Remote Sensing Magazine 5 (4):8–36. doi:10.1109/MGRS.2017.2762307.
- Zhu, Y., Y. Chen, L. Zhongqi, S. J. Pan, G.-R. Xue, Y. Yong, and Q. Yang. 2011. “Heterogeneous transfer learning for image classification.” Proceedings of the Twenty-Fifth AAAI Conference on Artificial Intelligence Heterogeneous, 1304–09.
- Zou, M. Y., and Y. Zhong. 2018. Transfer learning for classification of optical satellite. Sensing and Imaging 19 (1):1–13. doi:10.1007/s11220-018-0191-1.