
 ?Mathematical formulae have been encoded as MathML and are displayed in this HTML version using MathJax in order to improve their display. Uncheck the box to turn MathJax off. This feature requires Javascript. Click on a formula to zoom.
ABSTRACT
– The operators play a important role in the distribution system control centers, especially during network contingencies. In these situations, the operators have to quickly restore the service and mitigate the impact of a failure on the electrical networks. The utilities need to know how efficiently the operators have executed their maneuvers and whether they are following the company proceedings. Thus, it is paramount to the utilities to have computational tools to evaluate operator performance. The development of this evaluation system is not usually discussed in the literature, whose focus is on developing computational tools for operator training and system operation simulators. Hence, we developed a computational system to evaluate the operator performance of distribution networks, taking the operator’s past actions and their impact on the company’s economic and technical indexes into account. This paper’s main contribution lies in proposing a multicriteria methodology and the computational model, based on an expert system, to assess the distribution network operator performance, considering 13 technical and economic criteria. The obtained results, by using real data from a Brazilian utility, present not only the operator’s global performance but also which criteria the operator has to improve, when past contingencies are analyzed.
Introduction
Despite the Smart Grids is a well-known topic in the electrical power system area, the concepts associated with this philosophy are not entirely applied in most distribution systems worldwide. Mainly, concerning advanced control methods and automatic restoration (self-healing) issues, there is a lack of solutions to distribution networks and significant challenges to overcome (Dileep Citation2020). Thus, the operators are still essential to maintain electrical energy distribution quality, considering it a product and an associated service. As demonstrated in Prostejovsky et al. (Citation2019) the nature of human intuition when dealing with abnormal situations is indispensable in the operation of electric power systems.
Since the operators usually have to deal with a considerable amount of data and information, especially in contingency situations, it increases the cognitive and stress burden in these cases (Park and Jung Citation2006; Park, Jung, and Kim Citation2020). In these situations, the operators are more prone to making mistakes (Bao et al. Citation2018), causing severe problems to the electrical system, consumers, and even themselves. Therefore, the utilities must evaluate the operator’s performance to know how efficiently their maneuvers have been executed.
The development of computational systems to evaluate operator performance has not been focused on research in the technical literature. Most papers aim only to develop computational tools for operator training (Elizalde, Sucar, and De Buen Citation2006; Faria et al. Citation2009; Lambert-Torres et al. Citation1997; Vale et al. Citation2000), operator training evaluation (Bronzini et al. Citation2010; Lei, Shengtao, and Jiaojiao Citation2020; Vinodchandra, Ushakumais, and Mayadevi Citation2014) and operation simulators development (Rabinovich, Morzhin, and Parfionov Citation1995). There seems to be a gap related to the development of computational tools to assess distribution operator performance. This evaluation is complex because it must consider technical and economic criteria aligned to the company goals, leading to a multicriteria approach.
This paper proposes an intelligent system to assess operator performance when facing some contingency in the electrical distribution network. In this situation, his actions and maneuvers on the network and the respective impacts on the electrical system and consumers can be evaluated ex-post. The evaluation is executed offline, taking into account historical data and information about some past contingency. This methodology uses a multicriteria analysis procedure embedded in the developed expert system based on total quality control philosophy. This proceeding considers descriptors, metrics, and weights associated with each evaluation criterion, and an additive aggregation function obtains the final operator performance evaluation.
This paper is organized as follows: Section 2 describes the main aspects of the operator performance evaluation in the context of electrical power systems, the needs of both a multicriteria analysis and emulation of the stretch-by-stretch inspection. The developed computational system is presented in Section 3, where the Expert System role is discussed, the data entrance process is described, and the multicriteria evaluation process is detailed. Section 4 presents a real case study, while the final remarks are drawn in Section 5.
Operators performance evaluation
The importance of operators performance evaluation
The operators of distribution networks have a significant stress burden, especially in contingency situations. In these cases, the risk of committing a mistake or even execute an inadequate maneuver can be raised. Hence, it is paramount to the company to know how efficient its operators are and if their maneuvers are aligned with its best operation practices. A computational tool to periodically assess the operator´s performance, considering past maneuvers, is worthy to the company.
The operators must search for minimizing the time that the distribution network assets remain unavailable, taking into account their maneuvers. This philosophy is essential to reduce the switchings’ impact on the company’s technical and economic index, such as SAIDI (System Average Interruption Duration Index) and SAIFI (System Average Interruption Frequency Index). Moreover, the presence of priority consumers and network safety criteria must be considered during the switching process. These maneuvers are necessary due to distribution network reconfiguration proceeding and typical operation situations, for instance, involving programming maintenance.
The development of electrical power system simulators, especially for substation operators’ training, is a well-known issue in the technical literature (Bingda, Shiwei, and Dong Citation2000; Bronzini et al. Citation2010; Faria et al. Citation2009; Rabinovich, Morzhin, and Parfionov Citation1995; Silva Netto and Vieira Citation2010; Vale et al. Citation2000). Most of these approaches are based on artificial intelligence techniques, such as intelligent agents (Bronzini et al. Citation2010; Faria et al. Citation2009; Vale et al. Citation2000), and expert systems (Bingda, Shiwei, and Dong Citation2000). In these cases, the focus is developing a computational environment to simulate switching of circuit-breakers and switchgear, short-circuits in the distribution and sub-transmission networks, aiming to identify failures in the substation environment. However, the studies’ emphasis is the simulator per se, as a training environment, not focusing on the operator performance evaluation.
In some works (Lei, Shengtao, and Jiaojiao Citation2020; Vinodchandra, Ushakumais, and Mayadevi Citation2014), the authors propose a methodology for assessing operator performance during the training. However, this methodology has one evaluation criterion based on error identification, and the evaluation is defined only according to the number of errors.
Thus, the main contributions of this paper are:
To the best of our knowledge, there has been no previous effort to develop computational systems to evaluate power system operator performance, considering technical and economic criteria aligned to the company goals.
There seems to be a gap related to the development of computational tools to assess distribution operator performance.
A multicriteria operator evaluation approach based on an expert system, considering 13 technical and economic criteria and real data from a distribution utility. No other publication considers as many criteria as this work.
The proposed evaluation criteria are also a novelty: quality of electrical energy product (voltage limits and distribution lines loading), extra costs (revenue reduction associated with non supplied energy and penalties due to power outage), service quality (SAIDI, avoided SAIFI, number of consumers without energy, priority consumers, and average duration per switched off equipment), maneuvers compliance (network safety and switching sequence) and personal aspects of the operator (knowledge, skill, and competence).
This tool can be used in post-operation studies for assessing the actions executed by the operator during contingency situations.
The reports generated by the system can guide training strategies for the operators who did not achieve good evaluation or performance.
Multicriteria evaluation
The operator performance evaluation involves several aspects associated with the distribution network restoration process, after some contingency. Hence, we organized the evaluation criteria according to the Total Quality Control (TQC) philosophy (Kiran Citation2016), whose model has a multidimensional feature and aims mainly to guarantee the quality of product and service related to electrical energy supplied to the consumers. The TQC has five dimensions: intrinsic quality, cost, delivery quality, safety quality, and morale. We had to adapt the five general aspects of TQC to the operator performance evaluation problem. Thus, we defined the new five dimensions of TQC philosophy applied to this problem based on company experts’ opinions. The criteria are quality of electrical energy product (voltage limits and distribution lines loading), extra costs (revenue reduction associated with non supplied energy and penalties due to power outage), service quality (SAIDI, avoided SAIFI, number of consumers without energy, priority consumers, and average duration per switched off equipment), maneuvers compliance (network safety and switching sequence) and personal aspects of the operator (knowledge, skill, and competence).
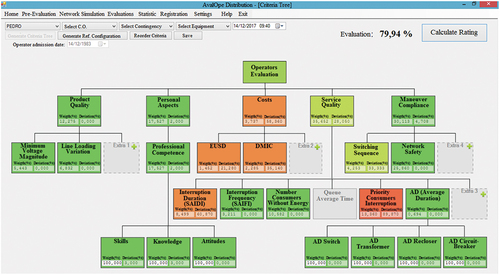
In this evaluation, we consider only the part assigned to the operator actions for each of these criteria when he restored the network after some contingency. These criteria are assembled into the five dimensions of TQC, forming the criteria tree presented in . The distribution criteria tree was proposed firstly in (Aranha Neto et al. Citation2016; Teive et al. Citation2017).
Figure 1. Proposed Criteria Tree.
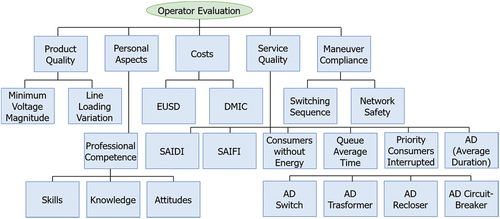
Each criterion in is evaluated on how far the operator performance is from the ideal performance. It is important to emphasize:
The line loading and the voltage levels are related to the deviation between the obtained values from the operator’s switching plan and the predicted values from the company reference plan.
The professional competence criterion evaluates three aspects of the operator: technical skills, knowledge, and attitude. In section III we will give more details about this criterion.
EUSD means the revenue reduction due to the non-supplied energy for big consumers (industrial consumers).
DMIC means the maximum interruption duration. It is a continuous time defined by the Regulatory Agency for each consumer. If the interruption in hours is bigger than DMIC, the utility has to pay the penalty.
The Queue Average Time is a company data, which means how long the operator waited to call a maintenance team (field crew), even he knowing there was an available team.
Priority consumers are considered: hospital, water station, city hall, and big consumers.
AD (Average Duration) means the average duration per switched equipment off, including Switches, transformers, automatic reclosers and circuit-breakers.
The operator maneuver compliance is evaluated according to two aspects: the switching sequence executed by the operator and network safety. The switching sequence is evaluated by the expert system (ES), and the network safety criterion represents the evaluation of whether the operator maneuver actions put the field crew or even the passersby at risk.
Since the operator performance evaluation is a multicriteria process, and the criteria do not have the same importance to the company, it is necessary to define weights for these criteria from the company’s experts’ perspective. Several approaches have been proposed to determine weights in multicriteria models. We selected a ranking weight method for its simplicity and effectiveness.
We adopted in this work the rank-order centroid (ROC) weight approach, proposed by Barron (Barron Citation1992), which produces an estimate of the weights that minimize the maximum error of each weight by identifying the centroid of all possible weights. This method is called rank-order centroid weight because these weights reflect the centroid (center of mass) of the simplex defined by the criteria’ ranking.
In this case, the decision-maker, operators supervisor, can provide preference information among the criteria, ranking the criteria according to their importance for the company. Afterward, the ROC weight method converts the list of ranks into numerical weights for n criteria by using the rank order weighting formula (Equationequation 1(1)
(1) ). The rank is inversely related to weight (rank r1 = 1 denotes the highest weight).
In Equationequation (1)(1)
(1) , wri means the weight of criterion i, n means the number of criteria and j means the rank of the considered criterion.
The ROC weight method is compared to other methods in (Barron and Barret Citation1996). These authors conclude that the ROC method presents an excellent tradeoff between the facility of obtaining the weights and the effectiveness of selecting the best alternative. Hence, the ROC weights method is a practical tool for multicriteria models.
The utility experts defined the ordinal preference of the distribution evaluation criteria. The weights were calculated by using Equationequation 1(1)
(1) and are depicted in , section III-3.
Stretch-by-stretch inspection
In general terms, when a contingency occurs in a distribution network, the operator has to follow a standard inspection procedure, whose logic is shown in the flowchart of , aiming for the distribution system restoration. This process is called stretch-by-stretch inspection, and its goal is to isolate the fault and keep the most consumers with energy, mainly the priority consumers, while the fault is located and the problem is fixed by the field crews.
Figure 2. Flowchart of distribution networks standard inspection.
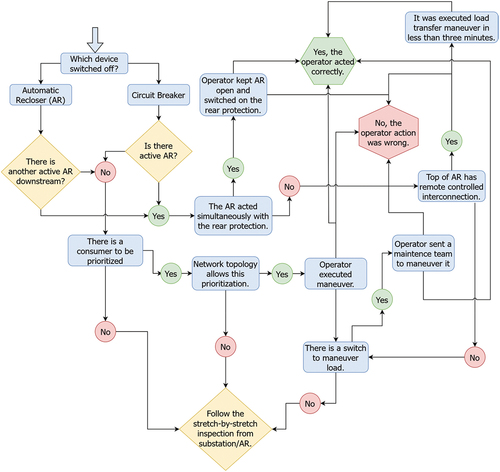
The evaluation process related to the stretch-by-stretch inspection, represented in the flowchart of , is guided by the developed Expert System (ES). The ES analyses the operator’s actions in the stretch-by-stretch inspection of the distribution network, comparing them to the expected actions. The ES also proofreads the wrong actions executed by the operator and recognizes the correct actions and maneuvers. The developed ES searches for representing this process, emulating the logic of an expert operator. After the rules chaining process, the ES can verify the operator’s efficiency and evaluate his performance based on queries that the operation supervisor answers. More details of the developed ES are presented in the following section.
Developed computational system
Developed expert system
The developed ES has two leading roles in the process of operator performance evaluation:
Identify operation errors committed by the operator when executing maneuvers on the distribution network during the restoration process, taking into account the operation analysis report (OAR). The ES emulates the stretch-by-stretch inspection, whose process is represented in .
Aid in the operator’s assessment process about the Maneuvers Compliance criterion, considering the number and sequence of switchings. In this case, the expert system identifies the operator’s wrong maneuvers during the distribution network reconfiguration.
depicts the whole process of distribution operator performance evaluation, focusing on the expert system role. The process starts with creating a new case. The user (operation supervisor) has to fill some filters in, considering: contingency period, substation, or feeder name related to the contingency or contingency name. The evaluation result is presented in the criteria tree, where the performance for each criterion is shown, considering deviation to the desired performance. The criteria tree also presents the operator’s final evaluation (see ).
Figure 3. Process of operator performance evaluation.

The expert system (ES) was developed in CLIPS using the ClipsNet API, and it was encapsulated in software coded in C#. The developed ES has more than 50 production rules. The application was configured in a local server, executing services developed in the C# language. The used database was an SQL server. The full access is made through an intranet, allowing the software users to assess the distribution operators by application terminals.
Beggining of assessment process
The operator performance evaluation process starts with the creation of a new case. The user (operation supervisor) has to fill some filters in, considering: contingency period, substation, or feeder name related to the contingency or contingency name. The system interface is depicted in . Afterward, the system queries the utility database for identifying the equipment that failed (cause root equipment) and the operator’s registration code, who worked in this contingency. The user gives a name for the case, and it is saved into the system. In the example of , related to the feeder CJU-06 and CJU substation, the registration code of the operator, who acted in the contingency, is c3005595.
Figure 4. New case creation.
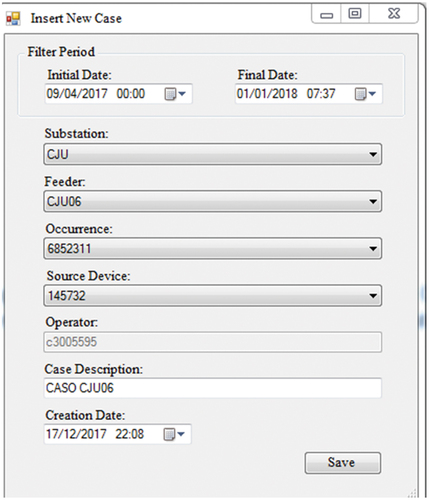
After creating a new case, the expert system searches for a reference maneuvers plan for this feeder. If there is a reference plan registered in the database, the operation supervisor edits the maneuvers executed by the operator, following the Operation Analysis Report (OAR), as is depicted in , for example. The operator actions are compared to the feeder reference plan by the supervisor (as an example, see ). If two plans’ actions are different or there is no reference plan for this feeder, the stretch-by-stretch inspection evaluation, guided by the expert system, is performed, searching for the operator maneuvers’ assessment. Then, the evaluation criteria are assessed, taking into account each criterion’s weight and the deviation calculated for each criterion, comparing the actions executed by the operator to the expected values of the switching reference plan. The considered weights for each criterion are presented in .
The developed system has as possible primary users the Operation and Control Center of distribution networks. This tool can be used in post-operation studies for assessing the actions executed by the operator during contingency situations. This system allows the company to monitor its operator’s performance and be used for any utility. The utility has only to aligned the criteria with its strategic goals. The reports generated by the system can guide training strategies for the operators who did not achieve good evaluation or performance. This system’s final aim is to allow the utility to maintain high-quality services to consumers, involving reliability and safety.
Evaluation criteria
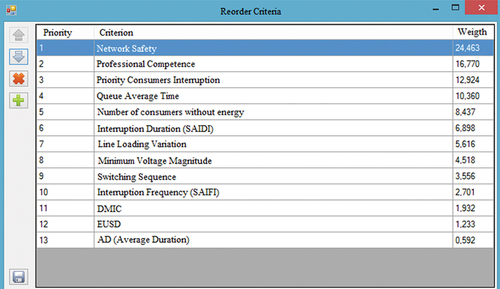
We calculated the criteria weights according to the ROC weight method (see Equationequation 1(1)
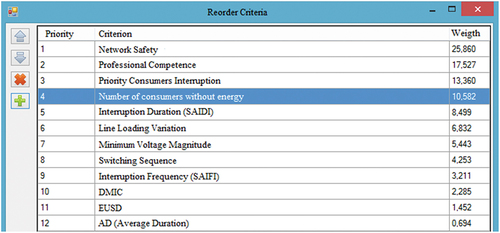
(1) ), considering the company’s experts’ ordinal preference. shows the value of the weights of the 13 operator performance evaluation criteria. The network safety criterion is the most important for the company from the point of view of the company experts, while AD (average duration per switched-off equipment) is the least important criterion.
The implemented evaluation metrics assess each criterion, considering the deviation between the predicted values (feeder reference plan) and the values generated by the operator’s actions in a past contingency. Each criterion in is evaluated on how far the operator performance is from the ideal performance.
Figure 5. Criteria Ordinal Preference.
The evaluation system calculates the deviations between the expected values from the reference maneuvers plan and the values generated by the maneuvers plan executed by the operator, considering a multicriteria evaluation. The deviation calculation is executed according to Equationequation (2)(2)
(2) , considering, for instance, the criterion SAIDI. Further information about the calculation process can be found in (Aranha Neto et al. Citation2016; Teive et al. Citation2017).
In Equationequation 1(1)
(1) , SAIDIoperator means the Interruption Duration caused by the operator’s maneuvers, SAIDIreference means the interruption duration expected by the company for this contingency (feeder), and SAIDID means the difference between these values. The calculation of the operator final performance evaluation is executed according to an additive aggregation function, as depicted in Equationequation (3)
(3)
(3) :
Wi represents the weight of criterion i; Di represents the deviation between the predicted values and the values generated by the operator’s actions, for criterion i and; n represents the number of considered criteria.
Technical knowledge and skills
The expert system considers the following rules for defining the evaluation of the Personal Aspect and Professional Competence criteria. These rules are based on a probabilistic model developed in this work. We developed this model considering the data of operators who work in the operation control centers of the company. We considered operators with three expertise levels (high, medium, and low), different interface quality levels, and the usual stress burden. This study demonstrated that the operator response time is inversely proportional to the working time. The higher is the operator’s expertise, the smaller is his response time for executing determined action. Further information about this study can be found in (Aranha Neto et al. Citation2016).
If the working time is ≤ six months, the deviation is 16,60%, and the evaluation is 83,4%.
If the working time is > six months and ≤ two years, the deviation is 6,5%, and the assessment is 93,5%.
If the working time is > two years, the deviation is 3% and the evaluation is 97%.
Attitudes
Default value: deviation is 0,0 and evaluation is 100%. These values can be edited for each operator by the operator supervisor.
4. Results
Distribution case test
The system chosen for the test, suggested by the company expert, is the feeder CJU-06 related to the Substation Cajuru 06. In this case, the contingency (fault) was a broken wire between switches 554818 and 45716, as depicted in . This contingency switched 4.535 consumers off, including residential, commercial, industrial, and public service. Besides, there are two priority consumers connected to this feeder. These priority consumers are related to one big consumer and a water station (public service). In , the priority consumers are represented by PC01 (big consumer) and PC02 (water station).
Figure 6. Single line diagram of test system.
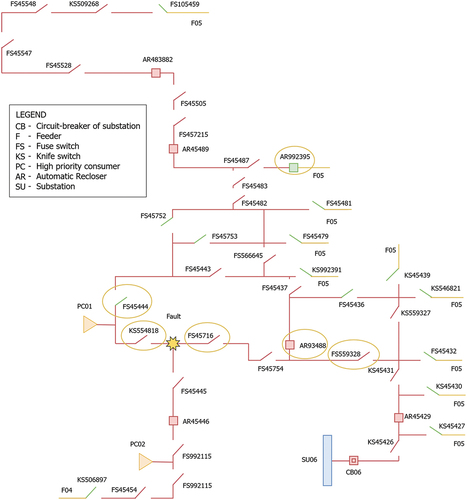
The following sections present the evaluation process related to the operator performance to solve this problem in the CJU-06 feeder. All the actions executed by the operator are assessed considering deviation concerning expected proceedings, starting from the stretch-by-stretch inspection analysis, guided by the expert system.
Stretch-by-stretch inspection analysis
After the occurrence of some contingency, the distribution operator has as a first duty to proceed with the inspection along the feeder, called stretch-by-stretch inspection. This process is used to locate the fault. The reasoning involved in this inspection process was implemented in an expert system, following the logic of . Then, the ES searches for identifying possible mistakes made by the operator during the process of stretch-by-stretch inspection, and it executes an evaluation of the operator’s actions during the process of seeking the fault location. In , the parts in red are energized and the parts in green usually are without energy.
In the case of feeder CJU-06’ contingency, the ES makes a set of queries, which the operator supervisor must answer. The supervisor answers the questions based on the operation analysis report (OAR). shows the result of the stretch-by-stretch inspection analysis executed by the ES for this contingency, considering the developed ES’s inference process, whose reasoning is based on the logic of .
Figure 7. Stretch-by-stretch Inspection – Feeder CJU06.
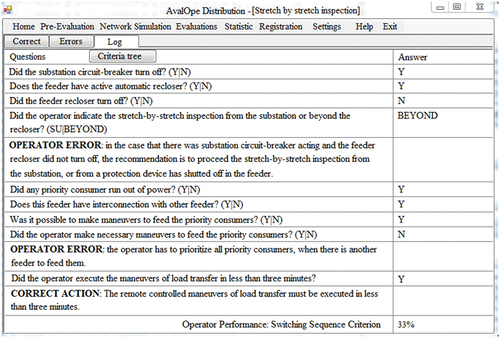
The ES starts the inference process for knowledge acquisition with the general question about the substation circuit-break. Then, the ES makes a questions chaining for emulating the stretch-by-stretch inspection logic. Finally, the ES makes an operator performance evaluation about the stretch-by-stretch inspection process, taking into account the correct and wrong actions executed by the operator. The operator had 66% performance and a deviation of 33% compared to the reference maneuvers plan of the feeder CJU-06, as is shown in .
Definition of the reference maneuvers plan
The reference maneuvers plan is generated by the system, which determines the reference network. The reference network is obtained by a multiobjective genetic algorithm (MOGA) – NSGA-II, which executes a network reconfiguration after some contingency. Further information about the developed MOGA can be found in (Teive, Rese, and Parreira Citation2019). The network reconfiguration process considers the following objectives:
non-supplied energy.
Feeders capacity.
Penalties for outage (EUSD).
The number of consumers without energy.
Distribution lines impedance.
Priority consumers.
The network reconfiguration is executed by the NSGA-II algorithm after the distribution line under contingency is withdrew from the system data. In this case, the distribution line under contingency is between the switches 554818 and 45716, as depicted in . The reference maneuvers plan is showed in . This plan is generated by the NSGA-II Algorithm, while the operator maneuvers plan is edited by the operator supervisor, based on the OAR.
Figure 8. Operator maneuvers plan and reference plan.
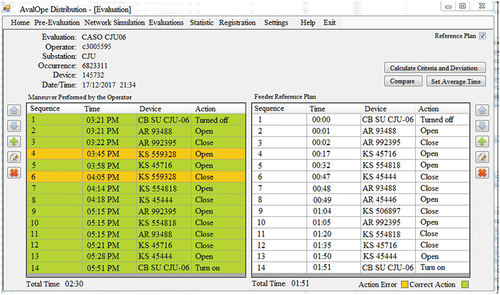
The operator executed two different maneuvers compared to the reference maneuvers plan, as demonstrated in . Moreover, the operator took much more time than expected to act. Thus, the interruption duration was longer than predicted and affected the operator performance in the criteria: Costs (EUSD, DMIC) and Service Quality (SAIDI, Priority Consumers) (see criteria in red in the heat map of ). Concerning the Priority consumers PC1 and PC2, the operator attended the big consumer PC1, switching on switch KS45444 and the automatic recloser AR992395 (maneuvers 8 and 9), feeding him through feeder F05. However, he forgot to feed the priority consumer PC2 and did not execute maneuvers 8 and 9, as predicted in the reference plan. Based on the maneuvers plan of , the developed system executes the operator performance evaluation for each considered criterion.
Calculation of evaluation criteria deviation
Criteria without deviations for this contingency
The operator’s maneuvers for this contingency were appropriate considering the criteria related to Product Quality (see criteria in dark green in the heat map of ). For these criteria, the operator got the maximum grade (no deviation comparing to the reference plan), because no voltage and loading violations were recorded in the utility operating system for this contingency. Moreover, the criteria interruption frequency (SAIFI), number of consumers, and Average Duration (Service Quality criterion) were equal to the reference plan and the operator got the maximum grade.
The operator procedure about the maintenance team was considered adequate, and his actions do not put the field crew or even the passersby at risk. Hence, he also got a maximum grade for the criteria Queue Average Time (Service Quality criterion) and Network Safety (Maneuver Compliance criterion).
Personal Aspects: Skills and Knowledge
Since this operator is three years working in this job, he got a deviation of 3% for the subcriteria Skills and Knowledge (Rule: If the working time is bigger than two years, then the deviation is 3%, and the evaluation is 97%).
Costs: EUSD and DMIC.
The CJU-06 feeder has one big industrial consumers (PC01 in ). The revenue reduction due to the non-supplied energy for industrial consumers (EUSD) is proportional to these consumers’ interruption duration. Since the energy interruption duration due to the operator’s maneuvers for these consumers was 57 minutes and the expected duration for this contingency, whether the operator had executed correct actions, was 47 minutes, the EUSD deviation was calculated according to Equationequation (4)(4)
(4) .
The maximum interruption duration (DMIC) means a continuous time defined by the Regulatory Agency for each consumer. The expected DMIC for this contingency was 111 minutes (see ); however, the interruption time due to the operator’s maneuvers was longer than necessary, as depicted in . The DMIC deviation was calculated according to Equationequation (5)(5)
(5) .
Service quality: SAIDI, Priority Consumers. We have the following deviations:
The SAIDI (System Average Interruption Duration Index) is calculated according to Equationequation (6)(6)
(6) , while the SAIDI deviation is defined by Equationequation (9)
(9)
(9) .
The SAIDI due to operator’s maneuvers and the expected SAIDI were calculated according to Equationequations (7)(7)
(7) and (Equation8
(8)
(8) ), based on the data of .
Table 1. Interruption duration data.
The interruption duration for priority consumers was calculated considering all priority consumers (PC 01 and 02) affected by this contingency. In this case, the expected interruption duration for these consumers was 79 minutes. The deviation was calculated by Equationequation (10)(10)
(10) .
Maneuver Compliance: Switching Sequence
The maneuvers executed by the operator were different from the expected maneuvers for this contingency. The ES identified a deviation of 33% concerning the standard procedure in the stretch-by-stretch inspection, as depicted in .
Results analysis
Considering all deviations calculated in this case, the operator achieved an evaluation of 81,72%, representing a good performance, taking into account the considered contingency and a multicriteria evaluation, based on the five dimensions of TQC philosophy and ROC weights methodology. The final evaluation is calculated by using an additive aggregation function (Equationequation 3(3)
(3) ) and the weight of each criterion (). The operator performance evaluation for the contingency in the feeder CJU-06 is depicted in .
Figure 9. Operator Evaluation – CJU-06 Case.
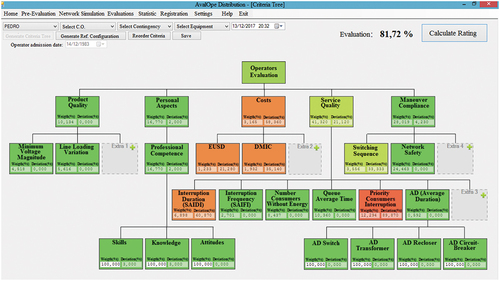
The heat map of , representing the operator performance for each criterion on the contingency CJU-06, shows that the operator had bad evaluation mainly in two aspects: number of consumers x interruption duration (SAIDI) and energy restoration for priority consumers. These criteria generated the most significant deviations regarding the calculation executed for each criterion of the reference maneuvers plan. The bad operator performance related to the interruption duration affected other criteria related to penalties (costs): EUSD and DMIC. Despite the lousy performance in these specific criteria, the overall operator evaluation was good because he had full evaluation (null deviation) in some criteria whose weights are high, such as network safety and queue average time. The operator who attended this contingency also had a good evaluation in the personal competence criterion, considering skills and knowledge, because he has great expertise in his job (more than two years).
Since the criterion Queue Average Time (QAT) is a value of a problematic acquisition because there is usually no available data about that, the evaluation can be made without this criterion. In this case, new criteria weights must be calculated, considering only 12 criteria. shows the new calculated weights, without the QAT criterion (criterion QAT blocked).
Figure 10. Criteria Ordinal Preference without the QAT criterion.
The result of operator performance evaluation, without the QAT criterion, is presented in . In this particular case, the operator performance overall evaluation decreases due to the withdrawal of the QAT criterion from the evaluation process because this criterion was initially with the full assessment (null deviation about the expected performance).
Figure 11. Operator Evaluation – CJU-06 case without QAT criteria.
In this case, the operator achieved an evaluation worse without the QAT criterion than with all criteria included but still representing a good performance. Since the number of criteria decreased to 12, the weight of each criterion increased, and the impact on revenue reduction (EUSD), penalty due to maximum interruption duration (DMIC), SAIDI, and interruption duration of priority consumer was higher than with 13 criteria. Hence, the operator had a poorer overall evaluation, as depicted in .
The validation of these results was executed by the utility’ experts. The experts concluded after analyzing the operation analysis report of the contingency CJU-06, and the operator’s maneuvers that the operator evaluation provided by this system was coherent.
This tool can be used in post-operation studies for assessing the actions executed by the operator during contingency situations. The reports generated by this system can guide training strategies for the operators who did not achieve good evaluation or performance These results demonstrated mainly in this case that this operator has to pay more attention to the priority consumers connected in the electrical network, and he has to try to restore the energy for these consumers firstly.
5. Final remarks
The obtained results with this computational system, using real data from a distribution utility, have indicated that the operators have to improve some aspects of their operation proceedings. In particular, in the contingency presented in this paper, the operator had problems with the restoration process duration, which directly affected the criteria related to cost and SAIDI and with the switching sequence. Moreover, the interruption duration of a priority consumer was longer than expected and the operator had a higher deviation in relation to the reference plan of the feeder CJU-06 (almost 90% of deviation).
We propose a computational system based on an expert system for evaluating the operator performance of distribution networks, considering past contingencies analysis. The evaluation is executed under the five dimensions of Total Quality Control (TQC). Each dimension has several evaluation criteria, as depicted in the criteria tree (). For each criterion, the developed system compares the feeder reference plan to the operator’s actions. The evaluation is made, considering the deviation between the predicted and the executed by the operator. The company’s experts define the criteria, and they are aligned to the company’s goals. An operation or post-operation supervisor can use this system. The reports generated by this system can guide training strategies for the operators who did not achieve good evaluation or performance.
To the best of our knowledge, there has been no previous effort to develop a computational system to evaluate distribution systems operator performance. Most papers aim to develop computational tools for operator training, operator training evaluation, and operation simulators development. There seems to be a gap related to the development of computational tools to assess distribution operator performance. This evaluation is tricky because it must consider technical and economic criteria aligned to the company goals, leading to a multicriteria approach.
Frequently, the operators have to solve problems related to the contingencies in the electrical network. In these cases, the fault elimination and energy restoration process must be as fast as possible, searching to mitigate the consumers’ impact, especially the priority consumers. However, the operators are more prone to making mistakes in contingency situations due to their stress burden. Hence, the electrical utilities must evaluate the operators’ performance to know if their maneuvers have been executed following the company reference plans and the best operation practices. As future developments on this system, we intend to improve the software front-end and the communication with the company’s database. We also intend to apply machine learning algorithms in the evaluation process of operator performance
Acknowledgments
The authors thank CPFL Power Group and the ANEEL R&D Brazilian Program.
Disclosure Statement
No potential conflict of interest was reported by the author(s).
References
- Aranha Neto, E. A. C., F. L. R. Mussoi, R. C. G. Teive, F. F. Andrade, J. Coelho, A. L. R. Rese, F. L. Cardoso, J. P. Parreira, and T. F. Guth. A multicriteria approach for performance evaluation of distribution system operators. IEEE-PES - Transmission and Distribution Conference and Exposition Latin America (PES T&D LA). Morelia, Mexico. (2016). 10.1109/TDC-LA.2016.78005652.
- Bao, Y., C. Guo, J. Zhang, J. Wu, S. Pang, and Z. Zhang. 2018. Impact analysis of human factors on power system operation reliability. Journal of Modern Power System and Clean Energy 6 (1):27–1932. doi:10.1007/s40565.016.0231-6.
- Barron, F. H., and B. E. Barret. 1996. Decision quality using ranked attribute weights. Management Science 42 (11):1515–23. doi:10.1287/mnsc.42.11.1515.
- Barron, F. H. 1992. Selecting a Best multi-attribute alternative with partial information about attribute weights. Acta Psychologica 80 (1–3):91–103. doi:10.1016/0001-6918(92)90042-C.
- Bingda, Z., X. Shiwei, and W. Dong. 2000. The training simulation system for substation based on network and expert system. 5th International Conference on Advances in Power System, Control, Operation and Management, Hong Kong, China. doi:10.1049/cp:20000457.
- Bronzini, M., S. Bruno, M. De Benedictis, S. Lamonaca, M. La Scala, G. Rotondo, and U. Stecchi. 2010. Operator training simulator for power systems training evaluation methodologies based on fuzzy logic. IEEE International Symposium on Industrial Electronics, Bari, Italy., doi:10.1109/ISIE.2010.5637733.2010.
- Dileep, G. 2020. A survey on smart grid technologies and applications. Renewable Energy 146:2589–625. doi:10.1016/j.renene.2019.08.092.
- Elizalde, F., E. Sucar, and P. De Buen. 2006. An intelligent assistant for training of power plant operators. Sixth IEEE International Conference on Advanced Learning Technologies, Kerkrade, Netherlands. doi:10.1109/ICALT.2006.1652406.2006.
- Faria, L., A. Silva, Z. A. Vale, and A. Marques. 2009. Training control centers’ operators in incident diagnosis and power restoration using intelligent tutoring systems. IEEE Transaction on Learning Technologies 2 (2). doi: 10.1109/TLT.2009.16.
- Kiran, D. R. 2016. Total quality management. 1st ed. Indian: Ed. BSP Elsevier.
- Lambert-Torres, G., G. M. Ribeiro, C. L. A. Costa, A. P. A. Silva, and V. H. Quintana. 1997. Knowledge engineering tool for training power-substation operators. IEEE Transaction on Power Delivery 12 (2):694–99. doi:10.1109/61.584348.
- Lei, Z., L. Shengtao, and L. Jiaojiao. Operator training evaluation system based on deep learning. 2020. IEEE 5th Information Technology and Mechatronics Engineering Conference, Chongqing, China. doi:10.1109/ITOEC.49072.2020.9141716.
- Park, J., and W. Jung. 2006. A study on the validity of a task complexity measure for emergency operating procedures of nuclear power plants - comparing with a subjective workload. IEEE Trans. Nuclear Science 53 (5):2962–70. doi:10.1109/TNS.2006.882149.
- Park, J., W. Jung, and J. Kim. 2020. Inter-relationships between performance shaping factors for human reliability analysis of nuclear power plants. Nuclear Engineering and Technology 52 (1):87–100. doi:10.1016/j.net.2019.07.004.
- Prostejovsky, A. M., C. Brosinsky, K. Heussen, D. Westermann, J. Kreusel, and M. Marinelli. 2019. The future role of human operators in highly automated electric power systems. Electric Power Systems Research 175:1–11. doi:10.1016/j.epsr.2019.105883.
- Rabinovich, M. A., J. L. Morzhin, and D. M. Parfionov. 1995. Power system digital simulator for training dispatcher. First International Conference on Digital Power System Simulator, Texas, USA. doi:10.1109/ICDS.1995.992989.
- Silva Netto, A. V., and M. F. Q. Vieira. Virtual reality training environment - a proposed architecture. IEEE Conference on Virtual environments, human-computer interfaces and measurement systems. Taranto. Italy. (2010), 10.1109/VECIMS.2010.5609364.
- Teive, R. C. G., A. L. R. Rese, and J. P. Parreira. Distribution network reconfiguration considering multiple objectives - a strategic approach. In: 2019 IEEE PES Innovative Smart Grid Technologies Conference Latin America. ISGT 2019. Gramado. RS. Brazil. (2019). 10.1109/ISGT-LA.2019.8894982.
- Teive, R. C. G., E. A. C. Aranha Neto, F. L. R. Mussoi, A. L. R. Rese, J. Coelho, F. F. Andrade, F. L. Cardoso, F. Nogueira, and J. P. Parreira. Intelligent system for automatic performance evaluation of distribution system operators”. 19 th International Conference on Intelligent System Applications to Power Systems. IEEE ISAP. San Antonio. Texas. USA. (2017). 10.1109/ISAP.2017.8071399.
- Vale, Z. A., A. Silva, L. Faria, and N. Malheiro. 2000. An intelligent tutor for power system control center operator training. International conference on electric utility deregulation and restructuring and power technologies, London. UK. doi:10.1109/DRPT.2000.855692.2000.
- Vinodchandra, S. S., S. Ushakumais, and N. Mayadevi. 2014. Expert System for power plant operator performance evaluation. Fourth International Conference on Advances in Computing and Communications, Cochin. China. doi:10.1109/ICACC.2017.2014.70.