
 ?Mathematical formulae have been encoded as MathML and are displayed in this HTML version using MathJax in order to improve their display. Uncheck the box to turn MathJax off. This feature requires Javascript. Click on a formula to zoom.
ABSTRACT
Recently, studies on energy estimation have been developing rapidly to increase the efficiency of Wind & Solar energy production-consumption. Artificial Neural Networks, an algorithm based on the human brain and its nervous system inspired by the data transfer and storage mechanism, can work very well as a prediction model. In this study, total Wind & Solar Electricity Capacity (WSEC) and total Wind & Solar Electricity Generation (WSEG) values of Germany, a G8 member and a European country, have been estimated by using Artificial Neural Networks (ANN) method. Population, unemployment, GDP growth and total renewable energy capacity (excluding wind and solar energy total) parameters have been used as input variables in ANN calculations. The use of geographic, socio-economic and technological parameters has strengthened the estimation model. WSEC training and test regressions calculated by ANN have been 1 and 0.99988, respectively. WSEC Mean Absolute Deviation (MAD), Mean Squared Error (MSE), Root Mean Square Error (RMSE) and Mean Absolute Percentage Error (MAPE) parameters have been calculated as 94.783, 62496.807, 249.994 and 0.364, respectively. WSEG training and test regressions values have been 1 and 0.99983, respectively. The WSEG MAD, MSE, RMSE and MAPE parameters have been calculated as 114.406, 59252.128, 243.418 and 0.526, respectively.
Introduction
Due to technological developments all over the world, improvements in welfare and life expectancy have caused population growth. The energy requirements have also increased with the developing population. Fossil fuel derivatives are natural resources formed after many years and world fossil fuel reserves have come close to their limits because of their consumption for centuries. In addition to the decrease in natural fossil fuel resources, energy requirements have been increasing day by day as the population increases. Increasing energy consumption also brings about some negative factors. Unemployment can be given as the first example of these negative effects. Employees working in fossil fuel resources bring along an increase in unemployment rates. Population growth not only causes an increase in unemployment rates but also creates simultaneous negative effects causing an increase in carbon emissions (“World Population Prospects” Citation2015; Yin et al. Citation2014; Zhengge Citation2014). This situation brings with a great series of environmental damage. Countries exposed to emission increase make efforts to reduce carbon emissions that seriously harm the environment (X. Jiang Citation2014; Ning et al. Citation2020).
Unemployment rate and carbon emissions are tried to be reduced all over the world. Population growth causes an increase in fossil fuel usage and carbon emissions. However, this increase is not linear. Yang et al. have conducted a research on the nonlinear effect of population aging on carbon emission in their study (Yang and Wang Citation2020). Population aging has a negative coefficient on carbon emissions whether the population aging level is lower or higher than the 0.129 threshold. Moreover, the higher the population aging level is, the greater the balancing effect of population aging on carbon emissions is (Yang and Wang Citation2020). Han et al. have analyzed the relationship between energy consumption and carbon emission with the Kaya model. As a result of these analyzes, it has shown that China’s urbanization contributes to the reduction of energy consumption and carbon emission intensity (Han, Cao, and Sun Citation2019). Roberts et al. have aimed to achieve economic growth reducing carbon emissions by imitating national-level policies focusing on unemployment levels (Roberts et al. Citation2019).
Unlike previously known renewable energy types, new energy sources are among the popular topics. New and renewable energy (NRE) sources are encouraged and supported in all countries (Hong et al. Citation2014; Shahbaz et al. Citation2020). The NRE sector creates new jobs reducing unemployment rates. This situation benefits the economy. The use of NRE has prevented the amount of carbon emissions expected to occur. As a result, the increase in the use of NRE has provided new jobs and economic and environmental benefits such as reduction in greenhouse gas emissions while increasing employment (Ferroukhi et al. Citation2016).
Increasing energy demands are tried to be balanced with NRE sources. Research on the trends of renewable energy is carried out in many ways. Forecasting the rising energy demands has become an important issue. Many international energy organizations have carried out studies making estimations with high accuracy. International Energy Agency has published one of them in 2016 and has predicted a 30% increase in global energy demands in 2040 (IEA, Citation2016). It has been inevitable for each country to develop scientific forecasting models so that they use their potential effectively.
The importance of artificial intelligence has been increasing day by day. Artificial Neural Networks (ANN), which is the subject of artificial intelligence, has an important role in this field. ANN has a workable scope in all fields of science. Economy (Chuku, Simpasa, and Oduor Citation2019; Feng and Zhang Citation2014), sport (Aka, Aktuğ, and Kılıç Citation2021; Fialho, Manhães, and Teixeira Citation2019), automotive (Sözen et al. Citation2005), natural sciences (Zhou Citation2020), electricity consumption (Kazemzadeh, Amjadian, and Amraee Citation2020; Panklib, Prakasvudhisarn, and Khummongkol Citation2015), architecture (Ahmad et al. Citation2014), medical sciences (Ceylan Citation2020; Kırbaş et al. Citation2020; Saba and Elsheikh Citation2020; Saniei et al. Citation2016) and energy systems (Ahmed and Khalid Citation2019; Alzoubi et al. Citation2018; Ergün et al. Citation2017; Maftah et al. Citation2021; Singh and Verma Citation2019) engineering are just a few of the areas that can be exemplified in this regard.
Nam et al. have analyzed the 100% NRE and electricity generation policy of Jeju Island in Korea with different scenarios (Nam, Hwangbo, and Yoo Citation2020). Avila et al. have made wave energy estimation by using Fuzzy Inference Systems (FIS) and Artificial Neural Networks (ANN) methods in Canary Islands (Avila et al. Citation2020). Aly H. has estimated hybrid harmonic tidal energy and wave energy by using Artificial Neural Network (WNN and ANN) method (Aly Citation2020).
Energy production and consumption are two difficult phenomena to predict because they depend on many parameters. In this study, the total WSEC and total WSEG values have been estimated by using the input parameters of Germany; 2000–2020 population, unemployment, GDP growth and total renewable energy (excluding wind and solar) and the input values of the ANN model. Forecasting the energy parameters with ANN is a new subject. Forecasting parameters and place (in this case Germany) constitute the most important innovation part of this study. Training, validation, testing and all regressions have been estimated with the least error by running the ANN model of the MATLAB program. MAD, MSE, RMSE and MAPE error parameters have been calculated with the obtained estimation values. The prediction model developed by using ANN is a new way of estimating the total WSEC & WSEG values in Germany and has been added to the current academic literature.
In today’s world, where wind and solar energy production depends on many factors, estimating the progress of electricity production and capacity has an important place for all developed countries. The aim of this study is to obtain a result that will contribute to the orientation of the country’s energy management by developing a forecasting algorithm with the data of the last 20 years of Germany.
Potential of Germany, Error Analysis and Estimation Method
Socio-Economic and Energy Indicators in Germany
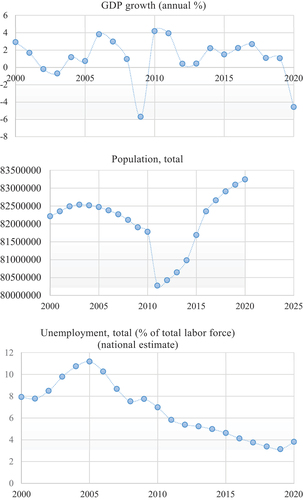
There are four European countries (United Kingdom, France, Italy and Germany) that are members of G8. Germany has one of the strongest economies among them. Germany’s 82 million population in 2000 still remained at a constant value in 2018 (“The World Bank “, Citation2020) (). In addition, the population reached 83 million in 2019. Germany Gross Domestic Product (GDP) growth (annual%) was 2.8% in 2000 and 1.5% in 2018 (“The World Bank “, Citation2020). In addition, GDP growth (annual%) fell to 0.5 in 2019. Unemployment is a term which has many evaluation criteria such as gender, age, and type of job. In this study, the term unemployment is used only by the percentage of total labor force. While unemployment in Germany was 7.92 in 2000, it was determined as 3.38 in 2018 and decreased to 3.14 in 2019 (“The World Bank “, Citation2020). This shows that Germany can reduce unemployment rates despite the increase in population. In recent years, the COVID-19 epidemic’s effects on population (Paulino et al. Citation2021; Solanki et al. Citation2021), GDP (Paulino et al. Citation2021) and unemployment (Barbieri Góes and Gallo Citation2021; Gururaja and Ranjitha Citation2021; Ruiz Estrada Citation2021) are extremely negative.
Figure 1. Socio-economic indicators of Germany (“The World Bank “ Citation2020).
According to International Renewable Energy Agency (IRENA) data, the total electricity capacity of Germany was 11.8 GW in 2000, while the electricity capacity in 2018 was 119.2 GW (). While electricity generation was 35.4 GWh in 2000, the electricity capacity in 2018 was 224.7 GWh ().
Table 1. WSEC values (MW) of Germany.
Table 2. WSEG values (GWh) of Germany.
Error Measurement Parameters
The difference between actual value and predicted value is called error. Error is used as the estimation evaluation method. The less the error is, the more accurate the prediction is. The lower error value is an indicator of the success of the prediction model. In this study, error measurement methods such as Mean Absolute Deviation (MAD) (Gorard Citation2015; Konno and Koshizuka Citation2005), Mean Squared Error (MSE) (Gunst and Mason Citation1976; Jianjun Citation1991), Root Mean Square Error (RMSE) (Gao, Shi, and Maydeu-Olivares Citation2020; Jobst et al. Citation2021) and Mean Absolute Percentage Error (MAPE) (Armstrong and Collopy Citation1992; de Myttenaere et al. Citation2016; McKenzie Citation2011) have been used. The value in the error parameters shows the number of years taken into consideration.
MAD is calculated as in EquationEq. 1(1)
(1) .
MSE is calculated as in EquationEq. 2(2)
(2) .
RMSE is calculated as in EquationEq. 3(3)
(3) .
MAPE is calculated as in EquationEq. 4(4)
(4) .
If the MAE, MAPE, MSE and RMSE parameters are close to zero, it means that better predictions can be made.
Artificial Neural Network (ANN)
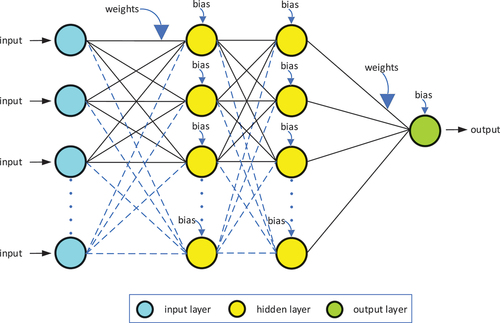
Artificial Neural Networks is an algorithm based on the human brain and nervous system, inspired by the data transmission and storage mechanism (Özden and Kılıç Citation2020). The process of repeated trials in normal life is the training process. ANN is operated just like in real life with numerical algorithms. Learning is defined as approaching the result more accurately in a short time (Alpaydin Citation2020). Checking the network results as a result of learning is the confirmation of the event. 70% of the data have been run in training, 15% in validation and 15% in testing in the software made in the MATLAB program. In the artificial neural network, the output variable is the dependent variable and is called the output layer (H. Jiang et al. Citation2020). Input variables are independent variables and are called input layers. The structure called the hidden layer that associates a complex network between the input-output layers has been used. In this study, ANN network structure and input/output variables created are presented in . The ANN hidden layer used the Levenberg-Marquardt training algorithm (Huang and Ma Citation2019; Mammadli Citation2017).
Figure 2. Formed ANN structure.
Two different networks have been set up to estimate the WSEC and WSEG values of Germany between the years 2000–2020. In the first network; population, unemployment, GDP growth and total renewable energy electricity capacity (except WSEC) have been used as the input layer (). The output layer is the WSEC value. In the second network; population, unemployment, GDP growth and total renewable energy electricity generation (except WSEG) have been used as the input layer. The output layer is the WSEG value.
Figure 3. ANN model and input, output variables.
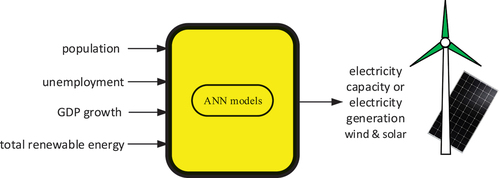
Total renewable energy also includes WSEC and WSEG. For this reason, WSEC and WSEG have been subtracted from the total renewable energy, resulting in total renewable energy with input values. Wind energy is the total value of offshore wind energy and onshore wind energy. Solar energy is the total value of solar photovoltaic energy and solar thermal energy. Solar and wind energy total has been taken as output value. This forecasting study with the ANN model has an important role in determining the weight of the wind & solar energy forecast trend in Germany. The fact that the inputs of the ANN model, which is established in the pandemic COVID-19 virus all around the world, are significantly affecting the inputs of this study, reinforces the importance of the outputs and the novelty of the study.
Results and Discussion
In order to obtain the ANN structure with the least error, different numbers of hidden layers have been graphed with the structure program software found by using trial and error method [50]. When the mean square error has been minimum, the ANN structure has been accepted as optimal. The results obtained according to the structure in minimum MSE condition have been obtained as predictive values. After the estimation and real value results, MAE, MAPE, MSE and RMSE parameters have been calculated and given in , and . Germany WSEC & WSEG values have been given in and , respectively.
Table 3. WSEC (GW) actual and forecasted values of Germany.
Table 4. Germany’s WSEC (GW) error parameters.
Table 5. The results of paired sample t test in between real and estimated values.
Table 6. WSEG (GWh) actual and forecasted values of Germany.
Table 7. Germany’s WSEG (GWh) error parameters.
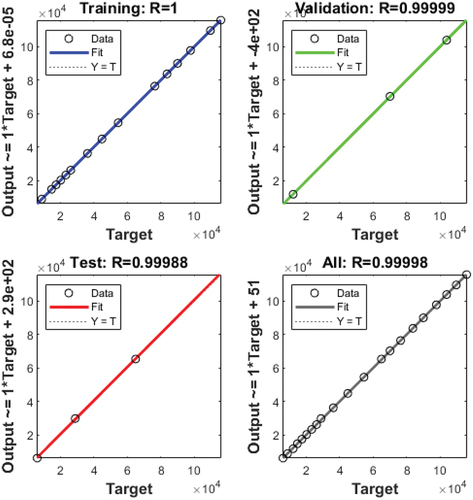
Germany WSEC output value has been forecasted. Four regression outputs of the first network, training, validation, test and all, can be seen in . Training regression value has been 1, validation regression value has been 0.99999, test regression value has been 0.99988 and all regression value has been 0.99998. Regression results, which is close to the value of 1, are an indicator of how strong the prediction is. Li et al. have obtained regression values for building energy systems by making an ANN-based optimization approach. In their swimming pool case study, high accuracy regression results such as 0.99997 and 0.99999 have been obtained (Li et al. Citation2020).
Figure 4. Germany WSEC regression graph.
WSEC actual values and estimation values resolved in 6*4 hidden layer structure are given in .
The error parameters of MAD, MSE, RMSE and MAPE coefficients are given in . 21 actual values have been estimated for WSEC & WSEG between the years 2000 and 2020.
In order to determine if the difference between real and estimated values are meaningful or not, paired sample t test has been carried out. According to the test results, whether the difference between the averages of real and estimated values is statistically not meaningful will show that artificial neural network method has a high estimation power. Thus, the results of paired sample t test between real and estimated values have been shown in .
When has been examined, it has seen that the averages of real and estimated values are () and (
), respectively. It has been understood that the difference between both average points is meaningful (t(20) = −1.008; p = .326 > 0.05). Whether the difference between the average values is not meaningful has indicated that the estimated values have been very close to the real values. Besides, it shows that the artificial neural network method used in the analysis has a high estimation power.
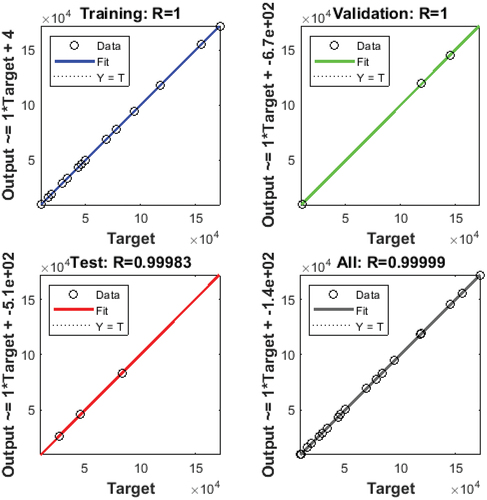
Germany’s WSEG output value has been estimated. Four regression outputs of the first case, training, validation, test and all, can be seen in . Training regression value has been 1, validation regression value has been 1, test regression value has been 0.99983 and all regression value has been 0.99999. Sözen et al. have developed estimation algorithms for ARIMA, NARNN and LSTM models on the Turkey sample model. The MAPE performance values of these models have been obtained as 18.54, 7.57 and 3.91, respectively (Sözen et al. Citation2021). In this study, the Germany WSEC regression value has been obtained as 0.99998 by making estimations with lower error than the regression values found by Sözen et al. The MAPE value of 0.364 obtained is much smaller than that of Sözen et al. indicating that the prediction model is stronger.
Figure 5. Germany’s WSEG regression graph.
WSEG actual values and estimation values resolved in 6*4 hidden layer structure have been given in .
Germany’s 2000–2018 WSEG error parameters for MAD, MSE, RMSE and MAPE have been shown in .
In this study, the Germany’s WSEG regression value has been obtained as 0.99999 by making estimations with lower errors. Since the error has been quite low, the MAPE value has been calculated as 0,526, which is much lower than the range of 3–18 found by Sözen et al. (Sözen et al. Citation2021).
In order to determine whether the difference between real and estimated values are meaningful or not, paired sample t test has been carried out. According to the test results, whether the difference between the means of real and estimated values is statistically not meaningful will show that artificial neural network method has a high estimation power. Thus, the results of paired sample t test between real and estimated values have been shown in .
Table 8. The results of paired sample t test in between real and estimated values.
When has been examined, it has seen that the averages of real and estimated values are () and (
), respectively. It has been understood that the difference between both average points is meaningful (t(19) = −1.116; p = .278 > 0,05). Whether the difference between the average values is not meaningful has indicated that the estimated values have been very close to the real values. Besides, it shows that the artificial neural network method used in the analysis has a high estimation power.
The lower error values in the estimations and the regression values greater than 99% showed that the results contained with high accuracy. The study solved the WSEC and WSEG characteristics of Germany with the ANN method. With ANN, 2020 German WSEC and WSEG values can also be estimated. Strategies focusing on NRE resources, which have an important place in the German’s economy, can be evaluated with the ANN network structure. Each country has its own WSEC and WSEG characteristics. These characteristic values are individually operable for each country. The error values of the Germany’s Electricity production forecast model are in between a very small value range. These lower error values has put the German government in a position to predict its own energy consumption demands. Developing a dynamic model for inputs under pandemic conditions puts Germany in a position which it can predict the electricity consumption trend. COVID-19, which causes very rapid worldwide changes, has come to the fore as the most important innovation of the study. The ANN model’s working principle, affects this obtained data set. When the results of this study evaluated according to the data, the German administration will be able to make predictions with the error parameters of and if the results obtained with ANN have been applied in determining the prediction about electricity consumption. It has been observed that the ANN model is in between a superior working range due to the reasonable amount of error in applying the results quickly according to the data since Germany regression graphs are also balanced.
Conclusions
The data used for WSEC & WSEG estimations include the years between 2000–2020 and 2000–2019, respectively. Germany’s WSEC & WSEG values have been obtained by running the prediction algorithm with ANN in MATLAB program. Population, unemployment, GDP growth and total renewable capacity has formed the input layer of the case. Three hidden layers have given the best regression results at 6*4. WSEC training regression value has been 1, validation regression value has been 0.99999, test regression value has been 0.99988 and all regression value has been 0.99998. MAPE value of WSEC has been determined as 0,364. WSEG training regression value has been 1, validation regression value has been 1, test regression value has been 0.99983 and all regression value has been 0.99999. MAPE value of WSEG has been obtained as 0,526.
As a result, the model provides a prediction about Wind and Solar energy considering population unemployment GDP and Total Renewable capacity. Although many factors affect the future predictions, a usable model has been obtained. Government policies regarding the energy sector and developments in world energy markets will play a key role in future energy consumption models. In these extraordinary years, COVID-19 has serious effects on population, GDP and unemployment rates. It is a significant innovation that studies carried out with ANN estimation on the German situation provide a forecast on the population, GDP and unemployment rates, and Total Renewable capacity inputs, as well as the solar and wind energy WSEG & WSEC trend. In addition, the trend of German WSEG & WSEC demand can be verified by working on different countries and it has been thought that it can be applied on different models.
Some recommendations for future studies have been made using the ANN method.
A more efficient model can be created by multiplying input variables.
By increasing the number of entries or shortening the time intervals, more efficient and low error results can be estimated.
Prospective future predictions can be studied.
Different output estimates can be studied by establishing total estimation algorithms of different countries.
Comparative estimation studies can be made with aggressive solution methods such as NAR-NARX.
Nomenclature
References
- Ahmad, A. S., M. Y. Hassan, M. P. Abdullah, H. A. Rahman, F. Hussin, H. Abdullah, and R. Saidur. 2014. A review on applications of ANN and SVM for building electrical energy consumption forecasting. Renewable and Sustainable Energy Reviews 33:102–2273. doi:10.1016/j.rser.2014.01.069.
- Ahmed, A., and M. Khalid. 2019. A review on the selected applications of forecasting models in renewable power systems. Renewable and Sustainable Energy Reviews 100:9–21. doi:10.1016/j.rser.2018.09.046.
- Aka, H., Z. B. Aktuğ, and F. Kılıç. 2021. Estimating the England premier league ranking with artificial neural network. Applied Artificial Intelligence 35 (5):393–402. doi:10.1080/08839514.2021.1901030.
- Alpaydin, E. 2020. Introduction to machine learning. Fourth Edition. Cambridge, Massachusetts: MIT Press.
- Aly, H. H. H. 2020. A novel approach for harmonic tidal currents constitutions forecasting using hybrid intelligent models based on clustering methodologies. Renewable Energy 147:1554–64. doi:10.1016/j.renene.2019.09.107.
- Alzoubi, I., M. R. Delavar, F. Mirzaei, and B. Nadjar Arrabi. 2018. Comparing ANFIS and integrating algorithm models (ICA-ANN, PSO-ANN, and GA-ANN) for prediction of energy consumption for irrigation land leveling. Geosystem Engineering 21 (2):81–94. doi:10.1080/12269328.2017.1372225.
- Armstrong, J. S., and F. Collopy. 1992. Error measures for generalizing about forecasting methods: Empirical comparisons. International Journal of Forecasting 8 (1):69–80. doi:10.1016/0169-2070(92)90008-W.
- Avila, D., G. N. Marichal, I. Padrón, R. Quiza, and Á. Hernández. 2020. Forecasting of wave energy in Canary Islands based on Artificial Intelligence. Applied Ocean Research 10:102189. doi:10.1016/j.apor.2020.102189.
- Barbieri Góes, M. C., and E. Gallo. 2021. Infection is the cycle: unemployment, output and economic policies in the COVID-19 pandemic. Review of Political Economy 33 (3):377–93. doi:10.1080/09538259.2020.1861817.
- Ceylan, Z. 2020. Estimation of COVID-19 prevalence in Italy, Spain, and France. Science of the Total Environment 729:138817. https://doi.org/10.1016/j.scitotenv.2020.138817.
- Chuku, C., A. Simpasa, and J. Oduor. 2019. Intelligent forecasting of economic growth for developing economies. International Economics 159:74–93. doi:10.1016/j.inteco.2019.06.001.
- de Myttenaere, A., B. Golden, B. Le Grand, and F. Rossi. 2016. Mean absolute percentage error for regression models. Neurocomputing 192:38–48. doi:10.1016/j.neucom.2015.12.114.
- Ergün, A., İ. Ceylan, B. Acar, and H. Erkaymaz. 2017. Energy–exergy–ANN analyses of solar-assisted fluidized bed dryer. Drying Technology 35 (14):1711–20. doi:10.1080/07373937.2016.1271338.
- Feng, L., and J. Zhang. 2014. Application of artificial neural networks in tendency forecasting of economic growth. Economic Modelling 40:76–80. doi:10.1016/j.econmod.2014.03.024.
- Ferroukhi, R., A. Lopez-Peña, G. Kieffer, D. Nagpal, D. Hawila, A. Khalid, … A. Fernandez. 2016. Renewable energy benefits: Measuring the economics. Abu Dhabi: International Renewable Energy Agency (IRENA).
- Fialho, G., A. Manhães, and J. P. Teixeira. 2019. Predicting sports results with artificial intelligence – A proposal framework for soccer games. Procedia Computer Science 164:131–36. doi:10.1016/j.procs.2019.12.164.
- Gao, C., D. Shi, and A. Maydeu-Olivares. 2020. Estimating the maximum likelihood root mean square error of approximation (RMSEA) with non-normal data: A Monte-Carlo Study. Structural Equation Modeling: A Multidisciplinary Journal 27 (2):192–201. doi:10.1080/10705511.2019.1637741.
- Gorard, S. 2015. Introducing the mean absolute deviation ‘effect’ size. International Journal of Research & Method in Education 38 (2):105–14. doi:10.1080/1743727X.2014.920810.
- Gunst, R. F., and R. L. Mason. 1976. Generalized mean squared error properties of regression estimators. Communications in Statistics - Theory and Methods 5 (15):1501–08. doi:10.1080/03610927608827459.
- Gururaja, B. L., and N. Ranjitha. 2021. Socio-economic impact of COVID-19 on the informal sector in India. Contemporary Social Science 1–18. doi:10.1080/21582041.2021.1975809.
- Han, X., T. Cao, and T. Sun. 2019. Analysis on the variation rule and influencing factors of energy consumption carbon emission intensity in China’s urbanization construction. Journal of Cleaner Production 238:117958. doi:10.1016/j.jclepro.2019.117958.
- Hong, T., C. Koo, T. Kwak, and H. S. Park. 2014. An economic and environmental assessment for selecting the optimum new renewable energy system for educational facility. Renewable and Sustainable Energy Reviews 29:286–300. doi:10.1016/j.rser.2013.08.061.
- Huang, B., and C. Ma. 2019. A Shamanskii-like self-adaptive Levenberg–Marquardt method for nonlinear equations. Computers & Mathematics with Applications 77 (2):357–73. doi:10.1016/j.camwa.2018.09.039.
- International Energy Agency, I. 2016. World energy outlook 2016, executive summary. Online Accessed October 7, 2021. https://www.iea.org/
- Jiang, X. 2014. The rise of carbon emissions trading in China: A panacea for climate change? Climate and Development 6 (2):111–21. doi:10.1080/17565529.2013.857590.
- Jiang, H., Z. Xi, A. A. Rahman, and X. Zhang. 2020. Prediction of output power with artificial neural network using extended datasets for Stirling engines. Applied Energy 271:115123. doi:10.1016/j.apenergy.2020.115123.
- Jianjun, Z. 1991. Robust estimate with minimum mean squared error. Australian Surveyor 36 (2):111–15. doi:10.1080/00050326.1991.10438723.
- Jobst, L. J., C. Heine, M. Auerswald, and M. Moshagen. 2021. Effects of multivariate non-normality and missing data on the root mean square error of approximation. Structural Equation Modeling: A Multidisciplinary Journal 28 (6):851–58. doi:10.1080/10705511.2021.1933987.
- Kazemzadeh, M.-R., A. Amjadian, and T. Amraee. 2020. A hybrid data mining driven algorithm for long term electric peak load and energy demand forecasting. Energy 204:117948. doi:10.1016/j.energy.2020.117948.
- Kırbaş, İ., A. Sözen, A. D. Tuncer, and F. Ş. Kazancıoğlu. 2020. Comparative analysis and forecasting of COVID-19 cases in various European countries with ARIMA, NARNN and LSTM approaches. Chaos, Solitons & Fractals 138:110015. doi:10.1016/j.chaos.2020.110015.
- Konno, H., and T. Koshizuka. 2005. Mean-absolute deviation model. IIE Transactions 37 (10):893–900. doi:10.1080/07408170591007786.
- Li, Y., N. Nord, N. Zhang, and C. Zhou. 2020. An ANN-based optimization approach of building energy systems: Case study of swimming pool. Journal of Cleaner Production 277:124029. doi:10.1016/j.jclepro.2020.124029.
- Maftah, A., A. Azouzoute, M. El Ydrissi, A. Oufadel, and M. Maaroufi. 2021. Soiling investigation for PV and CSP system: Experimental and ANN modelling analysis in two sites with different climate. International Journal of Sustainable Energy 1–17. doi:10.1080/14786451.2021.1965605.
- Mammadli, S. 2017. Financial time series prediction using artificial neural network based on Levenberg-Marquardt algorithm. Procedia Computer Science 120:602–07. doi:10.1016/j.procs.2017.11.285.
- McKenzie, J. 2011. Mean absolute percentage error and bias in economic forecasting. Economics Letters 113 (3):259–62. doi:10.1016/j.econlet.2011.08.010.
- Nam, K., S. Hwangbo, and C. Yoo. 2020. A deep learning-based forecasting model for renewable energy scenarios to guide sustainable energy policy: A case study of Korea. Renewable and Sustainable Energy Reviews 122:109725. doi:10.1016/j.rser.2020.109725.
- Ning, T., Z. Wang, P. Zhang, and T. Gou. 2020. Integrated optimization of disruption management and scheduling for reducing carbon emission in manufacturing. Journal of Cleaner Production 263:121449. doi:10.1016/j.jclepro.2020.121449.
- Özden, S., and F. Kılıç. 2020. Performance evaluation of GSA, SOS, ABC and ANN algorithms on linear and quadratic modelling of eggplant drying kinetic. Food Science and Technology 40 (3):635–43. doi:10.1590/fst.12719.
- Panklib, K., C. Prakasvudhisarn, and D. Khummongkol. 2015. Electricity consumption forecasting in Thailand using an artificial neural network and multiple linear regression. Energy Sources, Part B: Economics, Planning, and Policy 10 (4):427–34. doi:10.1080/15567249.2011.559520.
- Paulino, M., R. Dumas-Diniz, S. Brissos, R. Brites, L. Alho, M. R. Simões, and C. F. Silva. 2021. COVID-19 in Portugal: Exploring the immediate psychological impact on the general population. Psychology, Health & Medicine 26 (1):44–55. doi:10.1080/13548506.2020.1808236.
- Roberts, S. H., C. J. Axon, N. H. Goddard, B. D. Foran, and B. S. Warr. 2019. Modelling socio-economic and energy data to generate business-as-usual scenarios for carbon emissions. Journal of Cleaner Production 207:980–97. doi:10.1016/j.jclepro.2018.10.029.
- Ruiz Estrada, M. A. 2021. How much unemployment and inflation is going to be generated by COVID-19? Transnational Corporations Review 13 (2):202–10. doi:10.1080/19186444.2021.1912991.
- Saba, A. I., and A. H. Elsheikh. 2020. Forecasting the prevalence of COVID-19 outbreak in Egypt using nonlinear autoregressive artificial neural networks. Process Safety and Environmental Protection 141:1–8. doi:10.1016/j.psep.2020.05.029.
- Saniei, E., S. Setayeshi, M. E. Akbari, and M. Navid. 2016. Parameter estimation of breast tumour using dynamic neural network from thermal pattern. Journal of Advanced Research 7 (6):1045–55. doi:10.1016/j.jare.2016.05.005.
- Shahbaz, M., C. Raghutla, K. R. Chittedi, Z. Jiao, and X. V. Vo. 2020. The effect of renewable energy consumption on economic growth: Evidence from the renewable energy country attractive index. Energy 207:118162. doi:10.1016/j.energy.2020.118162.
- Singh, D. V., and T. N. Verma. 2019. Energy and exergy analysis of LiBr-H2O-operated vapour absorption refrigeration system using the ANN approach. International Journal of Ambient Energy 1–13. doi:10.1080/01430750.2019.1670727.
- Solanki, G., G. Kelly, J. Cornell, L. Geffen, and T. Doherty. 2021. The need to incorporate the impact of population ageing into the post-COVID-19 policy and planning reset in low and middle income countries. Global Health Action 14 (1):1921351. doi:10.1080/16549716.2021.1921351.
- Sözen, A., E. Arcaklioğlu, M. Özalp, and S. Yücesu. 2005. Performance parameters of an ejector-absorption heat transformer. Applied Energy 80 (3):273–89. doi:10.1016/j.apenergy.2004.04.004.
- Sözen, A., M. M. İzgeç, İ. Kırbaş, F. Ş. Kazancıoğlu, and A. D. Tuncer. 2021. Overview, modeling and forecasting the effects of COVID-19 pandemic on energy market and electricity demand: A case study on Turkey. Energy Sources, Part A: Recovery, Utilization, and Environmental Effects 1–16. doi:10.1080/15567036.2021.1910756.
- The World Bank. 2020. Retrieved from https://data.worldbank.org/indicator/SP.POP.TOTL?end=2019&locations=DE&most_recent_year_desc=true&start=1960&view=chart
- World Population Prospects. 2015. Retrieved from http://www.un.org/en/development/desa/publications/2015.html
- Yang, T., and Q. Wang. 2020. The nonlinear effect of population aging on carbon emission-Empirical analysis of ten selected provinces in China. Science of the Total Environment 740:140057. doi:10.1016/j.scitotenv.2020.140057.
- Yin, R., H. Cao, H. Li, and J. W. Sutherland. 2014. A process planning method for reduced carbon emissions. International Journal of Computer Integrated Manufacturing 27 (12):1175–86. doi:10.1080/0951192X.2013.874585.
- Zhengge, T. 2014. Strategic measures to reduce China’s carbon emissions: Based on an index decomposition analysis of carbon emissions in eight industries. Social Sciences in China 35 (3):158–73. doi:10.1080/02529203.2014.927105.
- Zhou, Y. 2020. Real-time probabilistic forecasting of river water quality under data missing situation: Deep learning plus post-processing techniques. Journal of Hydrology 589:125164. doi:10.1016/j.jhydrol.2020.125164.
Disclosure statement
No potential conflict of interest was reported by the author(s).