
 ?Mathematical formulae have been encoded as MathML and are displayed in this HTML version using MathJax in order to improve their display. Uncheck the box to turn MathJax off. This feature requires Javascript. Click on a formula to zoom.
ABSTRACT
Enterprises analyze opportunities and threats in the external environment, measure internal strengths and weaknesses, and formulate strategic objectives to stay ahead of their opponents. Product portfolio management (PPM) is a dynamic process by which an enterprise chooses which products to develop, sell, maintain, and remove to achieve strategic objectives, maximize profit, and balance markets for different capabilities. Most product portfolios involve new products only and exclude existing products. This study proposes a product/market portfolio model that considers both old/new products and old/new markets to maximize overall PPM profit, determine which old products should stay in existing markets, which new markets should be considered, or which markets should be abandoned, and develop new products for old markets or to introduce new products to some new markets. This study uses machine learning and deep learning algorithms to establish prediction models to screen the planned products and markets with a high success rate. Mathematical programming is then used to determine which old products should be sold in which old and new markets and which new products should be launched in which new and old markets to maximize profit. A sensitivity analysis is used to determine the effect of changes in the resource and the risk threshold on profit and product/market selection.
Introduction
Enterprises must launch the right products at the right time and in the right market to achieve sustained operation. Several products may be sold in a market and distributed in different life cycles and several new products may be under development or some old products may be undergoing improvement. When an enterprise reviews its product performance, it must consider which old products should be abandoned, which old products should be transferred to which new markets, or which old products should be improved and then introduced to old markets. It must also consider which old markets should be developed for which new products, or which new markets should be developed for which new products, in order to maximize profits. This activity is called product portfolio management (PPM) (Cooper and Sommer Citation2020; Doorasamy Citation2015a). Tolonen et al. (Citation2015a) mentioned that strategic fit, value maximization, and portfolio balance are the key focus areas in PPM. Strategic fit ensures that the portfolio is in line with the strategic objectives; value maximization aims for the portfolio to have the highest commercial potential; portfolio balance seeks to form a portfolio that covers long-term/short-term, and high-risk/low-risk products and markets. PPM maximizes profit for an enterprise by selecting the best product portfolio for a specific period of time in the future using limited resources. This is a dynamic decision-making process, so during the period, products are removed and added. Traditional PPM has some disadvantages (Cooper Citation2013): (1) it mainly focuses on new product research and development planning; (2) it does not cover the entire life cycle of a product and (3) financial evaluation favors projects that for which benefits can be accurately predicted, so small product projects with low risk and low profit are favored and resources are not allocated to strategic products that give a competitive advantage. Besides, traditional PPM focuses more on the selection of products and less on the selection of markets. A product that is unsuitable for one market may be good for another, thus, the PPM must consider both product and market concurrently. This study aims at the value maximization in the PPM and applies AI algorithms to support PPM analysis to predict the products/markets with a high success rate in terms of non-financial factors, including the level of product innovation, market accessibility, market size, and degree of competition. A mathematical programming model is then used to deal with the financial factors and determine which portfolio with a high success rate has the largest profit. The proposed approach can help solve the above mentioned problems of the traditional PPM.
Literature Review
This section details literature on product portfolio management and product/market matrix.
Product Portfolio Management
Enterprise uses PPM to achieve strategic objectives, maximize profit, and balance markets for different capabilities (Tolonen, 2015a), therefore, PPM must manage the timing and the extent of the development and launch of all new products and the improvement and delimiting of old products according to the business objectives and strategies of the enterprise (Cooper Citation2013). During this process, the enterprise may evaluate, select and schedule new products at any time and old products may be advanced, delayed, or removed (Tolonen et al. Citation2015b). PPM is a dynamic strategic decision-making process that involves senior management and involves optimizing and balancing the use of organizational resources. Most importantly, it affects 32% of the sales revenue for an enterprise in the next five years (Griffin Citation1997). This study focuses mainly on the value maximization in PPM, and the methods for maximizing the value of the portfolio include (1) quantitative methods, such as (i) financial models: NPV, IRR, and payback period, (ii) probability models: Monte Carlo simulation, and decision tree, (iii) scoring method, and (iv) analytical hierarchy process (AHP), and (2) qualitative methods, such as (i) strategic selection, (ii) checklists, (iii) Delphi approach, (iv) pie charts and bubble diagrams (Cooper, Edgett, and Kleinschmidt Citation1999). Cooper (Citation2013) mentioned that financial methods tend to favor small product projects with low risk and low profit that give no competitive advantage. On the other hand, methods that require human judgment, such as strategic selection, scoring method, AHP, Delphi, Monte Carlo simulation, decision tree, and bubble diagrams, can result in erroneous decisions. Therefore, a better approach for maximizing the value of PPM needs to be developed.
Doorasamy (Citation2015b) summarized five models of PPM: (1) the blue oceans-red oceans strategy, which involves leaving over-competitive markets and seeking more product opportunities; (2) the speed to market strategy, in which the development process for new products must bring products to market quickly; (3) the doing the right projects right strategy, by which the right projects are selected and executed correctly, and (4) the product portfolio balance strategy, which states that diversified product portfolios can reduce investment risks.
Tolonen, Harkonen, and Haapasalo (Citation2014a) proposed a model that manages both commercial and technical product portfolios throughout the life cycle. Baptestone and Rabechini (Citation2018) used a case study to determine the impact of portfolio management on an enterprise’s decision-making. Cooper, Edgett, and Kleinschmidt (Citation2001) noted that the characteristics of successful PPM are: (1) clear portfolio management methods and processes; (2) a high level of familiarity with and support for these methods and processes; (3) viewing each project from a portfolio management perspective and (4) maintaining alignment for all ongoing and new projects. Many researches focused on investment portfolio management (Chourmouziadis and Prodromos Citation2019; Garcia et al. Citation2020; García et al. Citation2019; González-Bueno Citation2019; Jalota, Thakur, and Mittal Citation2017a, Citation2017b; Mehlawat et al. Citation2020). Specifically, Mehlawat et al. (Citation2020) used the multi-objective fuzzy method to select an investment portfolio. Otten, Spruit, and Helms (Citation2015) proposed an algorithm that allows portfolio managers to visually classify the data-oriented products.
Mustonen et al. (Citation2020) indicated that the three key elements of PPM are: (1) maximizing the overall benefits so that the product portfolio can generate maximum profits; (2) balancing product portfolios by balancing the proportion of new products, growing products, and mature products and (3) calibrating enterprise strategy to ensure that the product portfolio is in line with an enterprise’s strategy.
Product Market Matrix
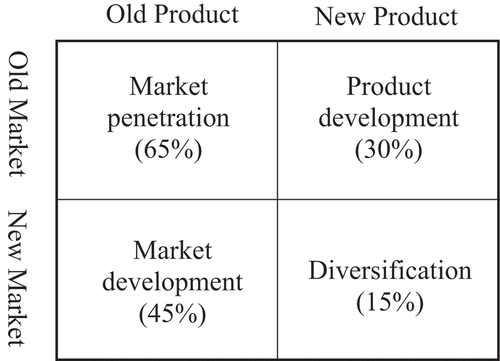
Traditional PPM focuses more on the products and less on the markets, and a product that is unsuitable for one market may be actually good for another. Therefore, products and markets must be jointly considered in PPM when the overall profit is to be maximized. Moreover, in addition to the product development and market development, the PPM must also cover the entire life cycle of an existing product and an existing market to maximize the value of a portfolio. A good tool to describe the combination of old/new products and old/new markets is a product/market matrix, which is also known as the Ansoff matrix. It is a matrix formed by products and markets in which products are divided into new products and old products and markets are divided into new markets and old markets (Dawes Citation2018). Ansoff proposed that business growth can only be achieved using two strategies: by adjusting the product (abandon, modification, development) and by adjusting the market (abandon, penetration, development) (Clarissia Citation2019). The best combination of the two strategies of products and markets maximizes the value of PPM, which is the objective of this study. shows the Ansoff matrix. The market penetration strategy, which has the lowest risk, refers to selling existing products in existing markets so the market is defended from competitors using discounts or advertising campaigns. The market development strategy, which has the second-lowest risk refers to selling existing products in a new market. Customers are unfamiliar with the product so sales channels and publicity are required for this market and the risk is higher than the market penetration strategy. The product development strategy, which has the second-highest risk, refers to selling new products in existing markets. These are existing markets but, the products and publicity in the marketing portfolio are already different. Uncertainty in customer demand and the limits of the enterprise’s innovation ability means that the risk of the product development strategy is higher than that of the market development strategy. The diversification strategy, which has the highest risk, refers to selling new products in new markets. There are unknown products and unknown markets so the outcome is the least predictable. The different degrees of risk mean that the success rate for each quadrant is different. The market penetration strategy has a success rate of 65%. The market development strategy has a success rate of 45%. The product development strategy has a success rate of 30%. The diversification strategy has the lowest success rate, at 15% (Ward Citation1968).
Figure 1. Product Market Matrix.
Clarissia (Citation2019) investigated the extent to which the Ansoff matrix is applied by the practitioners. Yenidogan and Aksoy (Citation2018) used the Ansoff matrix to manage the product innovation portfolio. Wei et al. (Citation2016) developed a fuzzy model for screening potential products, and a fuzzy synthetic rating index was proposed to help make the product Go-Kill decision. Kipley, Lewis, and Jeng (Citation2012) proposed a model combining the Ansoff matrix with performance matrices to enable the management to evaluate the firm’s current and future performance. Yang, Ni, and Wei (Citation2011) proposed a model for deciding the optimal timing to launch a new product to replace the existing one to maximize the overall profit.
Research Method
This study firstly uses AI algorithms to develop a prediction model, which is used to predict the products/markets with a high success rate. A mathematical programming model is then formulated to determine which portfolio with a high success rate has the largest profit.
Artificial Intelligence Screening Products and Markets
AI algorithms including machine learning and deep learning algorithms are used to train the product and market data sets to determine the success and failure of products in the market.
Training Data Set
shows the codes for the training data sets in the four quadrants of the product/market matrix. This study uses 16 historical data elements as the training data set for each quadrant and marks them with codes from 1 to 16. If enterprises do not have relevant past data for the quadrant, the data can be obtained through surveys, information of competitors, intelligence analysis and market prediction. The historical data preserved the facts of success or failure of the similar products in the market of the industry, therefore, it can provide useful information for future prediction. The quadrants are abbreviated as OP/OM, OP/NM, NP/OM and NP/NM, where OP/OM has past data so there is no need for AI prediction.
Table 1. Training Data Set Codes in the Product/Market Matrix
Model Development
The AI algorithm uses the training data sets to establish a prediction model in terms of product innovation, access, expected profit, market size, marketing costs and degree of competition (Gavett Citation2014; Jaideep Citation2022) for the OP/OM, OP/NM and NP/NM quadrants, while the decision for the OP/OM can be easily made based on current performance without the need of the AI prediction model. In order to avoid the error for a single model, this study uses machine learning and deep learning algorithms to establish prediction models: Naïve Bayes, OneR, REPTree and neural network. The neural network diagram is depicted in , and two hidden layers and respective 5 and 8 nodes are used because it produces higher accuracy with less errors after experiments. The prediction results using Weka are summarized in , where the neural network model produces the least error in OP/NM and NP/OM, while Naïve Bayes model produces the least error in NP/NM.
Figure 2. Neural Network Diagram.
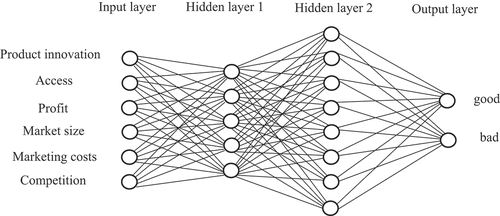
Table 2. AI Algorithm Models (OP/NM)
Table 3. AI Algorithm Models (NP/OM)
Table 4. AI Algorithm Models (NP/NM)
Predicting and Screening Product Markets
After developing the training models using AI algorithms, they are used to predict the success or failure of the candidate product/market in quadrants OP/NM, NP/OM and NP/NM as shown in and .
Table 5. Candidate Product/Market Codes
Table 6. Candidate Data Sets for OP/NM
Table 7. Candidate Data Sets for NP/OM
Table 8. Candidate Data Sets for NP/NM
show the prediction results for the AI algorithms for OP/NM, NP/OM and NP/NM. The majority rule is applied to select the products/markets that are most likely to succeed.
Table 9. Prediction Results for the AI Algorithms (OP/NM)
Table 10. Prediction Results for the AI Algorithms (NP/OM)
Table 11. Prediction Results for the AI Algorithms (NP/NM)
The product/market matrix in uses the results of AI algorithms. The gray squares in quadrants 1, 3 and 4 represent products and markets that are most likely to succeed, as selected by AI algorithms. For OP/OM quadrant, the enterprise decides to keep all products and markets with higher profits as shown in gray. Because the resources of enterprises are limited, marketing products in all these gray squares may be too resource-intensive or too risky so the next section details how to select the best product/market portfolio to maximize profits.
Table 12. Product/Market with a High Success Rate
Optimization of the Product Portfolio Using Mathematical Programming
If enterprises can measure the potential costs, expected profits and possible risks for all candidate products in all candidate markets, then using the practical experience of the industry, the risk is lowest for OP/OM, the risk is second lowest for OP/NM, the risk is third lowest for NP/OM and the risk is highest for NP/NM. If the risk for OP/OM is 1, then the risk for OP/NM is twice this value, the risk for NP/OM will four times this value and the risk for NP/NM is sixteen times this value (Ward Citation1968). If the cost and profit are also proportional to the degree of risk, then the optimal portfolio for all products in all markets can be expressed as a mathematical programming model, which is shown in EquationEquation (1)(1)
(1) , where p is the profit, c is the cost, r is the risk, B is total budget and R is the risk threshold:
S.T.
shows the estimated cost, profit and degree of risk for product competition in the market.
Table 13. Cost, Profit and Degree of Risk for the Product Market
By substituting the data in into EquationEquation (1)(1)
(1) and assuming a total budget of 800 and the risk tolerance of 560, the mathematical programming model in EquationEquation (2)
(2)
(2) is obtained:
Lingo is used to solve EquationEquation (2)(2)
(2) to give a maximum profit of 1631. To achieve this maximum profit, enterprises must choose 1111, 1311, 1112, 1212 and 1413 in OP/OM, 1421 and 1123 in OP/NM, 2112, 2412 and 2113 in NP/OM and 2221, 2322, 2422, 2423 and 2324 in NP/NM. The details are shown in the bold boxes in .
Table 14. Product Market Portfolio that maximizes Profit
Sensitivity Analysis
To determine which products and markets enterprises should choose to compete in order to maximize profits under different budgets and risk tolerance, this section divides budget and risk tolerance into three levels: high, medium and low. The respective budgets are 1000, 800 and 600 and the respective risk tolerance is 600, 400 and 200. Paired simulation is used to determine the effect of different portfolios on product and market decisions. The results of the sensitivity analysis are shown in .
Figure 3. Sensitivity Analysis Results. (a) 1000/600 (b) 1000/400 (c) 1000/200 (d) 800/600 (e) 800/400 (f) 800/200 (g) 600/600 (h) 600/400 (i) 600/200
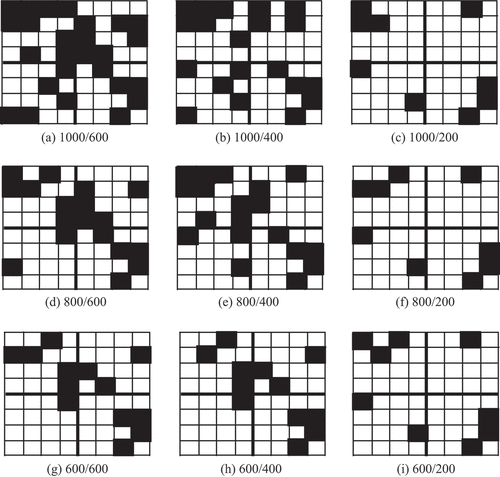
shows the selected products and markets for various portfolios for the overall budget and risk tolerance.
Table 15. Products and Markets of the Budget and Risk Portfolio
For OP/OM, if the fixed total risk is 600, the selected products/markets are reduced from nine with a budget of 1000 to six with a budget of 800. If the budget is reduced to 600, the number is reduced to five. However, if the risk is controlled at 400, six are selected for a budget of 1000, eight are selected for a budget of 800 and four are selected for a budget of 600. If the risk tolerance is reduced to 200, only three are selected, regardless of the budget.
For OP/NM, for a fixed total risk of 600, the selected products/markets are reduced from five with a budget of 1000 to two with a budget of 800. If the budget is reduced to 600, only one is selected. However, if the risk is controlled at 400, five are selected for a budget of 1000, three are selected for a budget of 800 and only one is selected for a budget of 600. If the risk tolerance is reduced to 200, only two are selected, regardless of the budget.
For NP/OM, if the fixed total risk is 600 again, the selected products/markets are reduced from seven with a budget of 1000 to five with a budget of 800. If the budget is reduced to 600, only three are selected. If the risk is controlled at 400, four are selected for a budget of 1000, three are selected for a budget of 800 and 600. If the risk tolerance is reduced to 200, only one is selected, regardless of the budget.
For NP/NM, if the fixed total risk is 600, the selected products/markets are five with a budget of 1000 and 800. If the budget is reduced to 600, four are selected. If the risk is controlled at 400, five are selected for a budget of 1000 and 800 and four are selected for a budget of 600. If the risk tolerance is reduced to 200, only three are selected, regardless of the budget.
shows that for the same budget limit, the lower the risk tolerance, the more cautious is the enterprise, so fewer products/markets are selected. This phenomenon occurs for all four types of products and market areas. Similarly, for specific risk tolerance, the higher the budget, the greater the number of products and markets that are selected, which is expected. These results are seen by comparison in the vertical direction of . If compared horizontally, for a budget of 1000, 800, or 600, for a fixed risk value, more products/markets are selected for OP/OM than for OP/NM, which supports the general perception that the risk is least for marketing old products in old markets.
This phenomenon is also seen when comparing OP/OM with NP/OM. The selected product markets show that most of the old products and new products do not overlap in the key markets, so this model abandons old products with no profit and markets new products in the old market to increase overall profit for the enterprise. A comparison of OP/NM and NP/NM also shows that most of the products/markets do not overlap, so products do not compete with each other in the same new market.
A comparison of profits for the product/market portfolio shows that the highest profit is 1977 for a budget of 1000 and a risk of 800, the second-highest profit is 1631 for a budget of 800 and a risk of 600 and the third-highest profit is 1629 for a budget of 1000 and a risk of 400. A comparison of budget and profit shows that the greater the budget, the greater the profit because there are more products/markets from which to choose.
For the same budget, the greater the risk tolerance, the greater the profit, which also agrees with the general perception of profit and risk. For the lowest risk tolerance (200), regardless of budget is, the profit is lowest at 891 because many options with high risk and high profit are rejected so there is a limited profit margin.
Discussions
The current PPM emphasizes the selection of new products and modification or abandon of old products in a portfolio for profit maximization. The problems with this view is that products are highly correlated with the markets; an unwelcome product in one market may just be a popular product in another. Therefore, the PPM analysis must consider products and markets simultaneously if value maximization of the PPM is to be expected. The contribution of this study is to extend the product portfolio to the product/market portfolio, and uses Ansoff matrix to plan the abandon, the modification, and the development of old/new products, and the abandon, the penetration, and the development of old/new markets. The machine learning and deep learning algorithms are used to screen the products/markets with a high success rate, and the mathematical programming model is finally used to form a portfolio with maximum profit. The two-stage approach proposed can assist management to avoid the mistake of choosing products with low risk and low profit using pure financial methods, and making erroneous selection decisions using subjective judgmental methods. Most importantly, a profit-maximizing product/market portfolio with a high success rate and formed by a scientific method is surely better than a product portfolio without considering the success rate and compatible markets and formed by human judgment. Lastly, the management can learn from this study that the product portfolio must be replaced by the product/market portfolio if the overall profit is to be truly maximized.
Conclusion
Traditionally, most enterprises focused PPM on the development of new products to meet the strategic objectives. Latterly, it was recognized that PPM must cover the entire life cycle of the products. This study proposes that maximizing the value of a PPM must not only consider the new and old products, but also the new and old markets. Therefore, the maximization of the PPM value becomes the decision of determining which old products should stay in existing markets, which new markets should be considered, or which markets should be abandoned, and develop new products for old markets or introduce new products to some new markets. To deal with this issue, this study uses machine learning and deep learning algorithms to determine the market decisions for old products and market planning for new products and then uses mathematical programming models to determine the product/market portfolio that generates the greatest profit. A sensitivity analysis of resource limitations and risk level is then performed to compare the effect of changes in resource and risk on the overall profit. The results show that a model that uses AI algorithms and mathematical programming allows enterprises to concurrently determine the products and markets that generate maximum profits. The contribution of this study is extending the concept of product portfolio to product/market portfolio, and proposing an approach to maximize the value of the product/market portfolio. The quality and number of historical product/market data can affect the accuracy of the outcomes, besides, the items used to evaluate the product, i.e., product innovation, market accessibility, expected profit, market size, market cost, and market competition, may not be applicable to all products and industries. Future research can be to use other machine learning algorithms and apply multi-objective mathematical programming models.
Disclosure statement
No potential conflict of interest was reported by the author(s).
References
- Baptestone, R., and R. Rabechini. 2018. Influence of portfolio management in decision-making. Journal of Industrial Engineering and Management 11 (3):406–1355. doi:10.3926/jiem.2464.
- Chourmouziadis, K., and D. C. Prodromos. 2019. Intelligent stock portfolio management using a long-term fuzzy system. Applied Artificial Intelligence 33 (9):775–95. doi:10.1080/08839514.2019.1630124.
- Clarissia, M. S. 2019. A study on Ansoff Matrix Technique: As a growth strategy and an adaptive learning technique adopted in the leading brand of products. Journal of Composition Theory 12 (9):1494–506.
- Cooper, R. G., S. J. Edgett, and E. J. Kleinschmidt. 1999. New product portfolio management: Practices and performance. Journal of Product Innovation Management 16:333–51. doi:10.1111/1540-5885.1640333.
- Cooper, R. G., S. J. Edgett, and E. J. Kleinschmidt. 2001. Portfolio management for new product development: Results of an industry practices study. R&D Management 31 (4):361–80. doi:10.1111/1467-9310.00225.
- Cooper, R. G. 2013. Where are all the breakthrough new products? using portfolio management to boost innovation. Research-Technology Management 56 (5):25–32. Sept-Oct
- Cooper, R. G., and A. F. Sommer. 2020. New-product portfolio management with agile. Research-Technology Management 63 (1):29–38. doi:10.1080/08956308.2020.1686291.
- Dawes, J. 2018. The ansoff matrix-a legendary tool, but with two logical problems. Social Science Research Network 97–105. doi:10.2139/ssrn.3130530
- Doorasamy, M. 2015a. Product portfolio management: An important business strategy. Foundations of Management 7. doi:10.1515/fman-2015-0023.
- Doorasamy, M. 2015b. Product portfolio management: An important business strategy. Foundations of Management 7:29–36. doi:10.1515/fman-2015-0023.
- Garcia, F., J. González-Bueno, F. Guijarro, J. Oliver, and R. Tamošiūnienė. 2020. Multiobjective approach to portfolio optimization in the light of the credibility theory. Technological and Economic Development of Economy 1–22. doi:10.3846/tede.2020.13189.
- García, F., J. González-Bueno, J. Oliver, and R. Tamošiūnienė. 2019. A credibilistic mean-semivariance-PER portfolio selection model for Latin America. Journal of Business Economics and Management 20 (2):225–43. doi:10.3846/jbem.2019.8317.
- Gavett, G. 2014. What you need to know about segmentation, Harvard Business Review, 09, July.
- González-Bueno, J. 2019. Optimización multiobjetivo para la selección de carteras de inversión a la luz de la teoría de la credibilidad: Una aplicación en el mercado integrado Latinoamericano. Medellín, Colombia: Editorial Universidad Pontificia Bolivariana.
- Griffin, A. 1997. PDMA research on new product development practices: Updating trends and benchmarking best practices. Journal of Product Innovation Management 14:429–58. doi:10.1111/1540-5885.1460429.
- Jaideep, S. 2022. Market targeting: Introduction, definition, procedure and methods, https://www.yourarticlelibrary.com/economics/market/market-targeting-introduction-definition-procedure-and-methods/48609.
- Jalota, H., M. Thakur, and G. Mittal. 2017a. Modelling and constructing membership function for uncertain portfolio parameters: A credibilistic framework. Expert Systems with Applications 71:40–56. doi:10.1016/j.eswa.2016.11.014.
- Jalota, H., M. Thakur, and G. Mittal. 2017b. A credibilistic decision support system for portfolio optimization. Applied Soft Computing 59:512–28. doi:10.1016/j.asoc.2017.05.054.
- Kipley, D., A. Q. Lewis, and J. L. Jeng. 2012. Extending Ansoff’s strategic diagnosis model: Defining the optimal strategic performance positioning matrix. SAGE Open 1–14. doi:10.1177/2158244011435135
- Mehlawat, M. K., P. Gupta, A. Kumar, S. Yadav, and A. Aggarwal 2020. Multi-objective fuzzy portfolio performance evaluation using data envelopment analysis under credibilistic framework. IEEE Transactions on Fuzzy Systems 28 (11):2726-2737. doi: 10.1109/TFUZZ.2020.2969406.
- Mustonen, E., J. Harkonen, J. Seppänen, H. Haapasalo, and A. Tolonen. 2020. Product portfolio management strategic targets and kpis over life-cycle: A case study in telecommunications business. Managing Global Transitions 18 (1):5–23. doi:10.26493/1854-6935.18.5-23.
- Otten, S., M. Spruit, and R. Helms. 2015. Towards decision analytics in product portfolio management. Decision Analytic 2 (4):1–25. doi:10.1186/s40165-015-0013-7.
- Tolonen, A., J. Harkonen, and H. Haapasalo. 2014a. Product portfolio management—governance for commercial and technical portfolios over life cycle. Technology and Investment 5:173–83. doi:10.4236/ti.2014.54016.
- Tolonen, A., H. Kropsu-Vehkapera, and H. Haapasalo. 2014b. Product portfolio management – current challenges and preconditions. International Journal of Performance Measurement 4 (2):69–90.
- Tolonen, A., M. Shahmarichatghieh, J. Harkonen, and H. Haapasalo. 2015a. Product portfolio management – Targets and key performance indicators for product portfolio renewal over life cycle. International Journal of Production Economics 170:468–77. doi:10.1016/j.ijpe.2015.05.034.
- Tolonen, A., J. Harkonen, M. Verkasalo, and H. Haapasalo. 2015b. Product portfolio management process over horizontal and vertical portfolios. International Journal of Product Lifecycle Management 8 (3):189–215. doi:10.1504/IJPLM.2015.074132.
- Ward, A. J. 1968. Measuring, directing and controlling new product development. London: In Com Tec.
- Wei, C. C., A. Andria, H. W. Xiao, C. S. Wei, and T. C. Lai. 2016. A new fuzzy decision-making approach for selecting new product development project. Concurrent Engineering 24 (3):240–50. doi:10.1177/1063293X16644950.
- Yang, C. L., M. H. Ni, and C. C. Wei. 2011. Timing for launching a new product to maximize overall profit. Concurrent Engineering 19 (3):201–12. doi:10.1177/1063293X10389798.
- Yenidogan, T. G., and S. Aksoy. 2018. Applying Ansoff’s growth strategy to innovation classification. International Journal of Innovation Management 22 (4):1-30. doi: 10.1142/S1363919618500391.