
 ?Mathematical formulae have been encoded as MathML and are displayed in this HTML version using MathJax in order to improve their display. Uncheck the box to turn MathJax off. This feature requires Javascript. Click on a formula to zoom.
ABSTRACT
The steady increase at the turnover of online trading during the last decade and the increasing use of credit cards has subsequently made credit card frauds more prevalent. Machine Learning (ML) models are among the most prominent techniques in detecting illicit transactions. In this paper, we apply the Just-Add-Data (JAD), a system that automates the selection of Machine Learning algorithms, the tuning of their hyper-parameter values, and the estimation of performance in detecting fraudulent transactions using a highly unbalanced dataset, swiftly providing prediction model for credit card fraud detection. The training of the model does not require the user setting up any of the methods’ (hyper)parameters. In addition, it is trivial to retrain the model with the arrival of new data, to visualize, interpret, and share the results at all management levels within a credit card organization, as well as to apply the model. The model selected by JAD identifies 32 out of a total of 39 fraudulent transactions of the test sample, with all missed fraudulent transactions being small transactions below 50€. The comparison with other methods on the same dataset reveals that all the above come with a high forecasting performance that matches the existing literature.
Introduction
The creation of international agreements that promote transactions with credit cards such as the Single Euro Payments Area have significantly eased the use of card payments by consumers and businesses. The total value of card transactions using cards issued in the SEPA area amounted to €4.38 trillion in 2016 (ECB, Citation2018) and is expected to double by 2025. Nevertheless, along with credit card transactions, we have seen a significant rise in credit card fraud. In 2016, credit card fraud in the SEPA area amounted to €1.8 billion (European Central Bank Citation2018), while the worldwide incidents rose from $7.6 billion in 2010 to $21.81 billion in 2015 and are expected to reach $31.67 billion in 2020 (Robertson Citation2016). Despite the increasing effort to alleviate such fraudulent transactions and the substantial resources allocated by credit card issuers toward this end, the rising cost of fraudulent transactions suggests that there is much room for improvement in this research area.
The detection of a fraudulent transaction is an ambitious task. First, fraudulent cases are rare (in our dataset only 1 every 5000 records), rendering the outcome distribution severely skewed. The distribution of fraud cases seems to have seasonality effects and structural breaks as the attack strategies evolve over time (Dorronsoro et al. Citation1997). Another important issue is the accurate definition of the cost function, given that the cost of a false positive differs from the cost of a false negative (Dal Pozzolo et al. Citation2014). When the system characterizes a genuine transaction as fraudulent and freezes erroneously that transaction (false positive), the financial institution has an administrative cost to pay, as well as a decrease in customer satisfaction. In the case of frequent false-positive alarms, the financial institution faces the risk of losing customers and gathering adverse publicity. Conversely, when the system fails to detect a fraudulent transaction (false negative), the amount of that transaction is a loss for the financial institution or the merchant. Thus, it is very hard to define the asymmetric loss of each occurrence.
Another significant difficulty in fraud detection is that electronic defrauders perform mainly legitimate transactions and occasionally fraudulent ones, rendering the profiling of them into universal standard patterns difficult. Each transaction must be examined separately, rendering the reaction overdue, especially on the non-working hours of electronic transactions. For an actual system to be useful, response to a fraudulent transaction should be almost contemporaneous, which is difficult given that most systems end up forwarding automatic flagged transactions to (human) fraud examiners for manual inspection. Finally, security and privacy laws limit the public availability of data and/or censor the performed analyses, making them difficult to assess.
Credit card fraud can be broadly separated into two categories: identity fraud with the physical presence of the card, and electronic fraud without the physical presence of the card. In the first case the fraud demands the acquisition of the credit card and the identity of the actual owner. In order to perform a transaction, the imposter must be physically present. The second category does not require physical presence of the card or its owner/imposter and is targeted to online transactions, where only identity and safety details are required. The latter category accounts for more than 70% of the worldwide credit card fraud (Robertson Citation2016), given that no face-to-face contact between seller and buyer is required. Despite the use of several technological improvements such as the Address Verification System (AVS), Chip and Pin verification and the Card Verification Code (CVV), new credit card fraud strategies are continuously being developed. This makes the automated timely detection of fraudulent transactions a very significant defense mechanism in combating fraud and reducing the associated losses to financial institutions.
Modern data-driven statistical and machine-learning (ML) methods can provide statistical-like predictive models that output the probability of a transaction to be fraudulent and address the above challenge. Indeed, ML applications have shown to be promising in fraud detection (see Related Work). However, each such application requires coding its own script, experimentation with several algorithms, and significant experience with statistical and machine learning methods as some ML algorithms do not converge in big sample data, some return sub-optimal predictive models, some are inappropriate for imbalanced outcomes, others require fine-tuning of their hyper-parameter values, others are hard to explain or interpret, or challenging to combine with feature selection (see Related Work Section). Manual scripting is also time-consuming and prone to methodological errors. Thus, the challenges that arise are “can credit card fraud predictive modeling be automated? Do the resulting models compete with the ones developed by human experts? Does automation obfuscate the interpretation of the model, or can it actually also help in obtaining intuition into the data patterns and task?”
To respond to such challenges, systems and services that automate a large part of the machine learning pipeline have recently appeared under the name of Automated Machine Learning (AutoML) system. Such systems automate the selection of ML algorithms, the tuning of their hyper-parameter values, the estimation of performance, and the visualization and interpretation of results. In this paper, we demonstrate how AutoML tools could potentially increase the productivity of detecting fraudulent credit card transactions without a reduction in the prediction performance compared to a manual analysis. Specifically, we describe and use the Just Add Data BioFootnote1 (hereafter JAD) AutoML tool on the fraud detection problem described above and achieve results on par with state-of-the-art previous analyses that are manually coded. Secondly, in addition to modeling, JAD performs automated feature selection to identify the most significant variables to fraud detection, providing valuable intuition to fraud inspectors. We’d like to note that JAD’s feature selection considers features jointly (multivariate) and not simply one by one. Features that are informative by themselves may become redundant given other features; similarly, features that are uninformative by themselves may be necessary for optimal prediction and become informative given other features. Hence, optimal feature selection is a combinatorial problem that returns the minimal-size feature subset that in combination leads to the optimally predictive model. After examining numerous combinations of algorithms for feature selection and modeling, as well as their tuning hyper-parameter values, JAD selects the best one to create a final model for prediction. It estimates its predictive performance along several common metrics (e.g., AUC, accuracy, balanced accuracy, F1 score), the confidence intervals of performance, the Receiver Operating Characteristic (ROC) curve, and the contribution to performance for each selected feature.
Post-analysis, JAD provides an easy way to access the trained model and apply it on new data to get predictions, without the need for computer coding. This means that any employee of a financial institution or a credit card firm can get predictions and try different scenarios of credit card transactions to gauge how predictions change with the feature values. JAD also supports collaborative analyses by sharing projects, data, and analyses results; the later can also be shared with anybody via unique links to the specific results’ page.Footnote2
The present work provides evidence that AutoML systems can indeed address to a large extent the challenges for automated credit card fraud detection modeling, at least within the limited scope of the present computational experiments performed. JAD does automatically output predictive models that can compete with prior work, selects the important features for prediction removing irrelevant and redundant features, and helps explain and interpret results. Several limitations of course, remain (see Discussion). Nevertheless, Auto ML can open a new path of research and provide supervision tools to the industry that overcome some of the limitations and obstacles of academic research. Based on this work, we argue that AutoML tools and services should be considered when analyzing credit card transaction data and potentially, other similar-type financial data. The simplicity, accuracy and speed of such systems make them an excellent fit in such financial transaction situations. The model can filter and flag a transaction as probably fraudulent in real time out of thousands of other transactions, keeping human intervention to a minimum.
The remainder of the paper is organized as follows. In section 2 we describe in more detail the Related Work. In Section 3, we describe the data and the methodology, while the empirical findings are presented in section 4. Section 5 discusses the limitations of the study, and Section 6 concludes the paper.
Related Work
The obvious financial benefits in detecting fraudulent transactions has sparked a voluminous literature in the field. The first attempts to create automate detection systems that examine an––often—large number of transactions and classify them as fraudulent or legitimate, are expert systems based on a set of classification rules (Hanagandi, Dhar, and Buescher Citation1996). Nevertheless, given that the distribution of credit card transaction datasets changes due to seasonality patterns, new market trends and the evolvement of new fraud strategies, the applied rules should be constantly updated, making rule-induction systems infeasible and ineffective.
Following an econometric approach, Ng and Jordan (Citation2002) compare logistic regression with Naïve Bayes classification models, showing that logistic regression models have a lower asymptotic error than Bayes classifiers, but fail to converge in very large datasets, as the ones used in credit card transaction problems. The Bayes classifier converges quickly, but its classification accuracy is lower than that of the logistic regression models. On a similar path, Maes et al. (Citation2002) compare Bayesian and neural networks, concluding that the Bayesian network converges faster and exhibits a lower classification error than neural networks. In an extended benchmark simulation, Lessmann et al. (Citation2015) compare 41 methodologies on various evaluation criteria and several credit scoring datasets. It is confirmed that the random forest method, i.e., the randomized version of bagged decision trees, outperforms logistic regression and has progressively become one of the standard models in the credit scoring industry (Grennepois, Alvirescu, and Bombail Citation2018).
Over the last decades, the rapid advances in the field of ML, provided additional tools to the satisfaction of fraud investigators. In a thorough survey of the relevant literature Ngai et al. (Citation2011) conclude that the most commonly used ML methods in fraud detection are decision trees, Artificial Neural Networks (ANN), Support Vector Machines (SVM) and genetic algorithms. These techniques can be used alone or in collaboration using ensemble or meta-learning techniques to build classifiers. Most of the applications are based on supervised training algorithms such as ANN (Dorronsoro et al. Citation1997; Prodromidis, Chan, and Stolfo Citation2000; Syeda, Zhang, and Pan Citation2002; Schindeler Citation2006; Juszczak et al. Citation2008; Quah and Sriganesh Citation2008) decision tree techniques like ID3, C4.5 and CART (Chen et al. Citation2005; Mena Citation2003; Wheeler and Aitken Citation2000) and SVM (Bhattacharyya, Citation2011).
A synopsis of the relevant literature suggests that classification performance of ML methodologies is heavily dependent on the dataset under study, with Bayesian networks and logistic regression exhibiting higher classification performance in smaller samples and ANNs and C4.5 decision trees outperforming all competing methodologies in larger samples. An obvious contrast of the previous works to the current proposed direction, is that a large part of the effort goes to the identification of the best algorithms for the given task and the optimization of the hyper-parameter. Moreover, as the number of the observations increases, the task of selecting the most informative features becomes a computationally impossible task. Thus, many researchers select a number of variables (often arbitrarily), conditioning the performance of their model to subjective feature selection processes. In contrast, the AutoML approach completely automates feature selection and model tuning.
Data and Methodology
The Data
For our analysis we use a large and frequently used in the literature cross-sectional dataset on credit card fraud detection, available in Dal Pozzolo et al. (Citation2014).Footnote3 The dataset includes online credit card transactions made in September 2013 by European cardholders. It consists of 492 fraudulent out of a total of 284,807 transactions for a two-day period. Thus, the fraud rate is approximately 0.172% of all transactions or approximately 1 in every 579 transactions. The data contains 28 anonymized variables, plus two named variables “Time” and “Amount.” The anonymized variables are the result of a Principal Component Analysis (PCA) transformation of the original data for confidentiality issues. The time feature contains the seconds elapsed between each transaction and the first transaction in the dataset. The “Amount” feature is the transaction amount. Regarding the anonymized nature of the features, as stated in Carneiro, Figueira, and Costa (Citation2017), the variables typically collected by financial institutions regarding credit card transactions are similar, since they are regulated by monetary authorities.
Variable “Amount” ranges from €0.1 to €25,691.16, with an average of and a standard deviation of
. provides an overview of the descriptive statistics of this variable. As we observe from Panel A, the data are severely skewed toward the left tail, while this finding is also highlighted in Panel B, since the majority of transactions are under €200. According to the Augmented Dickey-Fuller and the Kwiatkowski–Phillips–Schmidt–Shin tests, the variable is stationary.
Table 1. Overview of the amount variable
Just-add-Data
JAD is a Software-as-a-Service platform that runs on AWS, available at jadbio.com. JAD employs some simple feature transformations and imputation of missing values. For feature selection, it employs the Statistically-Equivalent-Signature (Lagani et al. Citation2017) algorithm (SES for short). A feature selection algorithm ideally returns a subset of the features that is minimal in size, and optimally predictive in a multivariate fashion, i.e., when all features are considered jointly. The predictors selected by SES are the neighbors of the outcome in any faithful Bayesian Network representing the data distribution, which a subset of the full Markov Blanket. The latter has been shown to be the optimal solution to the feature selection problem under certain broad conditions (Tsamardinos and Aliferis Citation2003). A feature of SES is that it heuristically and efficiently attempts to identify statistically, equivalent solutions, i.e., minimal-sized feature subsets with the same optimal predictive performance. Identifying all equivalent solutions is important when feature selection is employed for knowledge discovery and getting insight to the domain under study. Returning an arbitrarily chosen single solution S may mislead the domain expert into thinking that all other variables are either redundant or irrelevant, when they could just be substituting for a selected feature without loss of predictive power.
For classification, JAD considers Decision Trees (DT), Random Forests (RF), Support Vector Machines (SVM) with full polynomial and Gaussian kernels, and Ridge Logistic Regression. All the algorithms included above require the user to set the values of hyper-parameters. Hyper-parameters determine the behavior of an algorithm, typically regulating how sensitive the algorithm is in detecting patterns. The optimal values of the hyper-parameters must be found by trial-and-error. Results can vary greatly depending on their appropriate tuning. Using an Artificial Intelligence (AI) system JAD automatically decides which algorithms to try and which hyper-parameter values, depending on the size of the data, the type of the data, and the user preferences. The AI system is based on a set of rules that guide the fine-tuning process. JAD then generates all combination of choices called configurations. A configuration is a pipeline of algorithms with specific hyper-parameters that take the data and lead to a forecasting model.
To determine which configuration leads to the best model, JAD estimates the performance of the average model produced by each configuration using a (stratified) N-repeated, K-fold cross-validation protocol. The (standard) K-fold cross-validation (CV) protocol splits the data into K non-overlapping approximately equal-sized sets (called folds) of samples. The value K to use is determined by the AI system. The procedure progresses by keeping each fold out once, training models using all configurations on the remaining K-1 folds and estimating their performance on the held-out fold. The held-out test sets are used to simulate the application of the models on new, never-seen-before samples and to estimate the predictive performance obtained by training a specific configuration. In the end, the K performance estimates are computed on each fold, as well as the average, for each configuration. The configuration with the best average performance is selected as the winning configuration. For details on the repetition and stratification of CV see Tsamardinos, Greasidou, and Borboudakis (Citation2018). To produce the final model, JAD applies the winning configuration on the full dataset. The reasoning behind this is that we expect that the model learnt on all the data to be best on average.
Unfortunately, the cross-validated performance estimate of the winning configuration is optimistically biased and should not be reported as the final estimate. This is because numerous configurations have been tried. This is a statistical phenomenon conceptually equivalent to the adjustment of p-values in multiple hypothesis testing and related to the “winner’s curse” in biostatistics (Zollner and Pritchard Citation2007). In computer science it is called the Multiple Comparisons in Induction problem (Jensen and Cohen, Citation2000). JAD estimates the bias of the performance and the confidence intervals using a bootstrap-based method called Bootstrap Bias Corrected CV or BBC-CV and removes it to return the final performance estimate (adjust estimations for multiple tries of algorithms/configurations).The selection of the optimum forecasting model is performed based on the Area Under the Receiver Operating Characteristic (AUC-ROC) curve, that explores the trade-offs between sensitivity and specificity of the model and selects the most cost-effective operational point.
In addition to performance estimates, JAD provides several plots to help user understand and interpret results. The first is a Supervised 2D PCA plot, i.e., a 2D PCA plot based on the selected features (hence, the characterization “supervised”). The goal is to visually understand the data and detect anomalies (outliers) in the dataset. The Individual Conditional Expectation (ICE) plots displays how each instance’s prediction changes when a feature changes, in an effort to explain the role of each feature in the prediction output of the model. The Cumulative Variable Importance aims to explain the added value of each feature to the final forecast. Nevertheless, we do not provide extensive analysis on the feature selection abilities of JAD, given that the 28 variables of the credit-card transaction dataset come from a PCA compression of the original financial variables. Moreover, there is no information regarding the order of the variables; we do not possess information that the first variable is actually the first component of the PCA analysis, the second variable the second component etc. Thus, we do not present other post-analysis information, given that we cannot actually support evidence of the importance of an actual financial variable in forecasting.
Empirical Findings
In order to assess the ability of the JAD application to train and forecast credit card fraud in unknown data we split our sample into 2 parts using stratified sampling: 90% of the data are used to train the models and 10% is kept aside and it is only used to test the forecasting ability of the trained model to unknown data. Thus, we use 256,552 observations for training of which 446 correspond to credit card fraud and we left 28,255 observations for testing (46 are credit card fraud cases). Fraudulent transactions are labeled Class 1 and the rest are labeled Class 0.
Overall, it took 8 hours and 40 minutes for JAD to train 415 models and test alternative configurations on different subsets of the training data. The best overall configuration in terms of maximizing the Area Under the Curve on the training dataset is: a) selecting features using the SES algorithm with hyperparameters maxK-conditioning-set = 2 and significance level a = 0.1 and b) fit (learn) a ridge logistic regression model with penalty hyper-parameter lambda = 100. In step a) JAD selected 7 out of the total 30 explanatory variables (features) in our sample as the ones required for the optimal credit card fraud detection.
The model with the highest predictive performance is:
where is the probability of observation yi of a transaction belonging to Class 1 (fraudulent) of seven regressors where xi,j is the ith observation of variable (feature) . The predictive performance is measured using several metrics reported in .
Table 2. Accuracy metrics
The simplest of these metrics is classification accuracy, which equals the probability of the model making a correct classification on a new transaction. As we observe from , the overall classification performance of the best performing model is 99,9%. Nevertheless, this metric is not suitable to measure predictive performance in heavily unbalanced datasets. One can achieve a 99.93% accuracy by classifying all transactions as Class 0, since Class 1 (fraudulent cases) accounts only for the 0.172% of all observations. Thus, classification accuracy is a metric that is affected by the class distribution. A better metric typically used for binary classification, is the area under the ROC curve (AUC). The AUC is a metric that is independent of the class distribution. It is also invariant to a change in the class distribution between the train and test sets, in other words, it will not be affected if the percentage of fraudulent transactions increases in the test data (provided this is the only change in the data distribution). Nonetheless, as we mentioned above, we used stratified sampling so that our test and training distribution remain consistent. The AUC also has another, statistically intuitive interpretation: it is the probability that the model will correctly assign a higher probability of being fraudulent to a pair of transactions, given that one fraudulent and the other is legitimate. In our case, the AUC is 0.973, suggesting a high identification ability of the legitimate vs. fraudulent transactions.
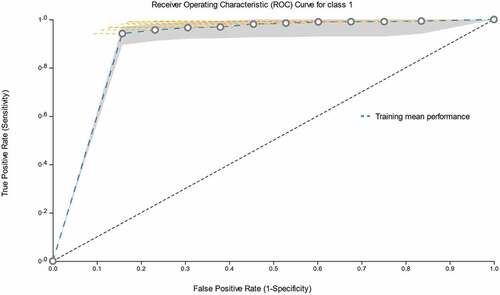
The model estimates the probability that a new transaction is fraudulent i.e. P(y = 1|x), given the values x of the seven features of the transaction selected in the training step. To classify a new observation, one uses a threshold t, such that, if the probability is higher than t, the transaction is classified as fraudulent. Depending on t one can become more or less conservative in classifying any transaction as fraudulent. Depending on t one can achieve various values of sensitivity (percentage of fraudulent correctly classified), specificity (percentage of non-fraudulent correctly classified), true positive rate (which equals sensitivity), false-positive rate (which equals 1-specificity), precision, and recall. The ROC curve depicts all the potential tradeoffs between true positive rate and false positive rate (false alarms). Typically, to increase the true positive rate we must accept an increase in the false positive (false alarms) rate as well. The rate of this trade-off is described by the slope of the ROC. The ROC created by JAD for this problem is shown in .
Figure 1. The ROC curve for Class 1 (fraudulent transactions), along with the respective 95% confidence intervals. The thick dashed (blue) line is the estimated ROC from the training data. Different points on the ROC curve provide a different trade-off between False Positive Rate (FPR) and the true positive rate (sensitivity) of the classifier. JAD can output models operating at different FPRs by selecting any of the circles.
The evaluation of a fraud detection model is more complex than simply identifying the model with the top predictive performance; the model should also aim at the best cost-effective classification, as it is defined a) by the cost of misclassifying a fraudulent (true positive) transaction as legitimate (false negative), b) the cost of false positives, and c) the ratio of prevalence between positives and negatives. JAD can produce models that operate on any threshold and achieve several sensitivity-specificity trade-offs.
The metrics shown in are calculated with a threshold of 0.0481, selected from the ROC curve during the training phase, as the threshold that maximizes true positive rate and minimizes false-positive rate for Class 1. Balanced accuracy refers to the average of the proportion corrects of each class individually to account for the seriously imbalanced nature of the dataset.
As we observe from , in terms of detecting fraudulent transactions (sensitivity of Class 1) our classifier achieves 78% on the training and 85% on the test sample, while the identification of legitimate transactions (specificity) reaches 100% in both cases. For the visualization of our results, in we report the confusion matrix of the train and test sample.
Table 3. The confusion matrix
The best model identified by JAD correctly identified 39 out of the 46 fraudulent transactions (84.78%), missing only 7 transactions (15,22%) and producing 10 false positives. Thus, out of the 49 cases of credit card transactions that would be flagged for manual inspection, only 10 cases would be false alarms. Given that we are provided with the exact amount of each transaction we can study the behavior of the model on each of the observed instance of . The descriptive statistics are reported in .
Table 4. Descriptive statistics of out-of-sample forecasts
The economic valuation of the credit card fraud detection by JAD is very interesting. The ridge regression model correctly identified 39 fraudulent transactions saving 7,535.24€ to the financial institution, while it has missed 7 transactions with a total cost of 477.64€. Most of the missed instances are small transactions below 50€ (39.90€, 11.39€, 3.39€ and the rest are below 1€), while only two transactions (311,91€ and 108,51€) exceed the amount of 100€. The false alarm transactions are all transactions below 1€ except one transaction of 89.90€. Thus, JAD exhibited the ability to efficiently detect all financially significant fraud transactions (above 500€) and to minimize the financial fraud cost and the administrative cost of manual inspection.
Comparing our findings with previous studies on the same dataset, we observe that our AutoML JAD setup exhibits similar or higher fraud detection abilities, while its AI interface simplifies the variable selection and fine-tuning procedures that are required compared to other applications. More specifically, Dal Pozzolo et al. (Citation2015) is the first use of the dataset in our study. The authors train Logit Boost, Random Forests and Support Vector Machines (SVM) classifiers in forecasting credit card fraud based on an under-sampling scheme. Awoyemi et al. (Citation2017) train a Logistic Regression, a Naïve Bayes and a K-Nearest Neighbors classifier in forecasting credit card fraud using the same dataset, but without feature selection. Fiore et al. (Citation2019) use the same dataset to produce artificial fraudulent transactions using a Deep Learning Artificial Neural Network (DLANN), in order to balance the dataset. Then, the artificial data are merged with the original dataset and a new DLANN is trained on the balanced dataset, keeping the last 30% observations for model evaluation (out-of-sample forecasting). Their application requires tuning 2 DLANN models that is a computationally intense and time-consuming procedure, while it requires expert knowledge and is prone to handling errors. The comparative results pertaining to fraudulent transactions (Class 1) in out-of-sample forecasting are reported in .
Table 5. Comparison to earlier studies
Overall, our AutoML approach simplifies training and testing even in such an imbalanced sample, produces a battery of useful forecasting performance metrics, while it achieves a similar or superior detection rate to the one reported in the literature.
Limitations
In terms of limitations, the current version of JAD does not automatically detect data distribution drift, perform automated data cleaning, raise alarms when the model seems to be invalidated in new samples, and in general, lacks functionalities for automatic model maintenance. In addition, it requires formatting the data as a 2-dimensional matrix. In practice however, credit card data are originally stored in relational databases and require extensive data engineering for feature extraction and construction, a step that is not automated. A limitation of the specific study stems from the fact that the features have been linearly transformed using PCA on the original measured quantities. This precludes the economic and financial interpretation of the selected features. Further experimentation with more financial datasets is necessary to generalize further the conclusions of the study.
Conclusion
In this paper we use an AutoML SaaS platform, namely JAD, to credit cards fraud detection on a dataset of 284,807 online transactions. JAD automatically performs imputation, feature selection, modeling, fine tuning of the hyper-parameters of a significantly large number of models and estimates predictive performance and confidence intervals. The automatic nature of the application provides model training and model selection in a manner that shields against methodological errors and is accessible to all users, expert and non-experts alike. Moreover, the user-friendly interface makes the retraining of the model effortless and the model update straightforward. The gains in generality and applicability do not come at the expense of forecasting performance, given that our approach has matched or superseded existing applications on the same dataset.
Ethical Approval
This article does not contain any studies with human participants or animals performed by any of the authors.
Disclosure Statement
No potential conflict of interest was reported by the author(s).
Notes
1. JAD Bio has been developed specifically for low-sample, high-dimensional, molecular biology data however, its algorithms are general enough to provide high-quality results in this application without any further customizations specifically for enterprise data.
2. The results for this analysis can be found at https://app.jadbio.com/share/4589e2ee-70aa-4594-aa5e-bae8d36c59ce
3. The dataset can be accessed at https://www.kaggle.com/mlg-ulb/creditcardfraud
References
- Bhattacharyya, S., S. Jha, K. Tharakunnel, and J. C. Westland. 2011. Data mining for credit card fraud: A comparative study. Decision Support Systems 50 (3):602–1599. doi:10.1016/j.dss.2010.08.008.
- Carneiro, N., G. Figueira, and M. Costa. 2017. data mining-based system for credit-card fraud detection in e-tail. Decision Support Systems 95:91–101. doi:10.1016/j.dss.2017.01.002.
- Chen, R.-C., S.-T. Luo, X. Liang, and V. C. S. Lee. 2005. Personalized approach based on SVM and ANN for detecting credit card fraud. Proceedings of the IEEE international conference on neural networks and brain. 810–15. Beijing, China.
- Dal Pozzolo, A. C., O. Caelen, Y.-A. Le Borgne, S. Waterschoot, and G. Bontempi. 2014. Learned lessons in credit card fraud detection from a practitioner perspective. Expert Systems with Applications 41 (10):4915–28. doi:10.1016/j.eswa.2014.02.026.
- Dal Pozzolo, A., O. Caelen, A. J. Reid, and G. Bontempi. 2015. Calibrating probability with undersampling for unbalanced classification. Symposium on Computational Intelligence and Data Mining (CIDM) Cape Town, South Africa, IEEE.
- Dorronsoro, J. R., F. Ginel, C. Sgnchez, and C. Cruz. 1997. Neural fraud detection in credit card operations. IEEE Trans. Neural Netw 8 (4):827–34. doi:10.1109/72.595879.
- European Central Bank. 2018. Fifth report on card fraud. https://www.ecb.europa.eu/pub/cardfraud/html/ecb.cardfraudreport201809.en.html#toc11.
- Fiore, U., A. De Santis, F. Perla, P. Zanetti, and F. Palmieri. 2019. Using generative adversarial networks for improving classification effectiveness in credit card fraud detection. Information Sciences 479:448–55. doi:10.1016/j.ins.2017.12.030.
- Grennepois, N., M. Alvirescu, and M. Bombail. 2018. Using random forest for credit risk models. London, UK: Deloitte Risk Advisory.
- Hanagandi, V., A. Dhar, and K. Buescher. 1996. Density-based clustering and radial basis function modeling to generate credit card fraud scores. Proceedings of the IEEE/IAFE conference New York, NY, USA. 247–51.
- Jensen, D., and P. Cohen. 2000. Multiple Comparisons in Induction Algorithms. Machine Learning 38 (3):309–38. doi:10.1023/A:1007631014630.
- Johm, A., A. O. Adetunmbi, and S. A. Oluwadare. 2017. Credit card fraud detection using machine learning techniques: A comparative analysis, IEEE International Conference on Computing Networking and Informatics (ICCNI), Lagos, Nigeria.
- Juszczak, P., N. M. Adams, D. J. Hand, C. Whitrow, and D. J. Weston. 2008. Off-the peg and bespoke classifiers for fraud detection. Computational Statistics & Data Analysis 52 (9):4521–32. doi:10.1016/j.csda.2008.03.014.
- Lagani, V., G. Athineou, A. Farcomeni, M. Tsagris, and I. Tsamardinos. 2017. Feature selection with the R package MXM: discovering statistically-equivalent feature subsets. Journal of Statisitcal Software 80 (7): 1–25 .
- Lessmann, S., B. Baesens, H.-V. Seow, and L. C. Thomas. 2015. Benchmarking stateof-the-art classification algorithms for credit scoring: An update of research. European Journal of Operational Research 247:124–36. doi:10.1016/j.ejor.2015.05.030.
- Maes, S., K. Tuyls, B. Vanschoenwinkel, and B. Manderick. 2002. Credit card fraud detection using Bayesian and neural networks. Proceedings of the 1st international naiso congress on neuro fuzzy technologies Havana, Cuba. 261–70.
- Mena, J. (2003). Investigate data mining for security and criminal detection. Amsterdam: Butterworth-Heinemann. C. Phua, V. Lee, K. Smith, and R. Gayler.
- Ng, A. Y., and M. I. Jordan. 2002. On discriminative vs. generative classifiers: A comparison of logistic regression and naive Bayes. Advances in Neural Information Processing Systems 2:841–48.
- Ngai, E., Y. Hu, Y. Wong, Y. Chen, and X. Sun. 2011. The application of data mining techniques in financial fraud detection: A classification framework and an academic review of literature. Decision Support Systems 50 (3):559–69. doi:10.1016/j.dss.2010.08.006.
- Prodromidis, A. L., P. K. Chan, and S. J. Stolfo. 2000. Meta-learning in distributed data mining systems: Issues and approaches. In Chapter 3 Advances of distributed data mining, ed. H. Kargupta and P. Chan, AAAI Press pp. 81–114 .
- Quah, J. T., and M. Sriganesh. 2008. Real-time credit card fraud detection using computational intelligence. Expert Systems with Applications 35 (4):1721–32. doi:10.1016/j.eswa.2007.08.093.
- Robertson, D. The Nilson report. 2016. https://www.nilsonreport.com/upload/content_promo/The_Nilson_Report_10-17-2016.pdf.
- Schindeler, S. 2006. Fighting card fraud in the USA. In Credit control, 50–56. House of Words Ltd.
- Syeda, M., Y. Zhang, and Y. Pan. 2002. Parallel granular neural networks for fast credit card fraud detection. Proceedings of the 2002 IEEE international conference on fuzzy systems Honolulu, HI, USA. 572–77.
- Tsamardinos, I., and C. Aliferis. 2003. Towards Principled Feature Selection: Relevancy, Filters and Wrappers, Proceedings of the Ninth International Workshop on Artificial Intelligence and Statistics, AISTATS, Key West, Florida, USA, January 3-6, 2003. Society for Artificial Intelligence and Statistics.
- Tsamardinos, I., E. Greasidou, and G. Borboudakis. 2018. Bootstrapping the out-of-sample predictions for efficient and accurate cross-validation. Machine Learning 107 (12):1895–922. doi:10.1007/s10994-018-5714-4.
- Wheeler, R., and S. Aitken. 2000. Multiple algorithms for fraud detection. Knowledge- Based Systems 13 (2/3):93–99. doi:10.1016/S0950-7051(00)00050-2.
- Zollner, S., and J. Pritchard. 2007. Overcoming the winner’s curse: Estimating Penetrance parameters from case-control data. American Journal of Human Genetics 80:605–15. doi:10.1086/512821.