
 ?Mathematical formulae have been encoded as MathML and are displayed in this HTML version using MathJax in order to improve their display. Uncheck the box to turn MathJax off. This feature requires Javascript. Click on a formula to zoom.
ABSTRACT
Learning-Enabled Components (LECs), such as neural networks, are broadly employed in Cyber-Physical Systems (CPSs) to tackle a wide variety of complex tasks in high-uncertainty environments. However, the training dataset is inevitably incomplete, and Out-Of-Distribution (OOD) data not encountered during the LEC training may lead to erroneous predictions, jeopardizing the safety of the system. In this paper, we first analyze the causes of OOD data and define various types of OOD data in learning-enabled CPSs. We propose an approach to effectively detect OOD data for both classification and regression problems. The proposed approach incorporates the variational autoencoder for classification and regression model to the Inductive Conformal Anomaly Detection (ICAD) framework, enabling the detection algorithm to take into consideration not only the LEC inputs but also the LEC outputs. We evaluate the approach using extensive experiments for both classification and regression tasks, and the experimental results validate the effectiveness of the proposed method for detecting different types of OOD data. Furthermore, the execution time of detection is relatively short; therefore, the proposed approach can be used for real-time detection.
Introduction
The rapid development of machine learning techniques such as Deep Neural Networks (DNNs) over the past few years has made them widely used in a broad range of fields as they can tackle complex tasks that conventional techniques cannot easily solve. From another perspective, Cyber-Physical Systems (CPSs) are typically deployed and operated in environments with high uncertainty and variability, which requires a high level of autonomy. Therefore, it is unsurprising that CPSs increasingly employ Learning-Enabled Components (LECs) to perform different tasks (Yan et al. Citation2021). Although LECs have achieved remarkable performance, we should analyze and ensure their safety and reliability before employing them in real systems. Nevertheless, the characteristics and complexity of the LECs impose immense obstacles to the analysis.
An explicit assumption that training and test data should follow the same distribution is essential in typical learning techniques used for training LECs, such as supervised learning. However, the training dataset of LEC is necessarily incomplete, and Out-Of-Distribution (OOD) data not encountered during training are inevitably present when LEC is deployed in the real world. OOD data may jeopardize the safety of the system by incurring erroneous LEC predictions. Consequently, to ensure the safety and reliability of the system, it is very significant and necessary to equip the LEC with the OOD detection method. The objective of OOD detection is to quantify the strangeness of test instances relating to the training dataset and raise alarms indicating that LEC may compute a large-error output due to the OOD data.
Although many efforts have been made for OOD detection in neural networks (Hendrycks and Gimpel Citation2017), different types of OOD data have not been investigated systematically. The first contribution of this paper is the formal definition of different types of OOD data present in the LEC of CPS. We first discuss the causes of OOD examples and then classify them into four different categories, which are OOD data caused by (1) covariate shift, (2) target shift, (3) concept shift, and (4) label concept shift. We also provide distinctive examples for each type of OOD data in both classification and regression tasks. The categorization of the OOD data is based on the categorization of the dataset shift for the training and test distributions (Quionero-Candela et al. Citation2009). Note that dataset shifts focus on the difference between the distributions of the training and test datasets, while OOD detection aims at testing whether a single test instance comes from the distribution of the training dataset.
The second and main contribution of the paper is an algorithm for detecting different types of OOD data in learning-enabled CPS. Typical OOD detection techniques (DeVries and Taylor Citation2018; Hendrycks and Gimpel Citation2017) could cause a high volume of false alarms because they do not consider the dynamical nature of the CPS. Recently, an Inductive Conformal Anomaly Detection (ICAD) (Laxhammar and Falkman Citation2015) based method has been proposed by Cai and Koutsoukos (Citation2020), in which multiple examples are incorporated to improve the robustness of detection. The method uses learning models such as Variational Autoencoder (VAE) to efficiently measure the differences between the test example and the training dataset. Our work follows the similar approach but utilizes a VAE for classification and regression model. The benefit of using such a model is that not only LEC inputs but also LEC outputs are taken into consideration, enabling the detection of a variety of OOD data present in CPS.
Last but not least contribution of this work is the comprehensive evaluation using several datasets for classification and regression tasks. We design experiments for different types of OOD data and use the same model for OOD detection. The experimental results demonstrate that the proposed method can detect different types of OOD data with a quite small number of false alarms. Besides, the execution time is relatively short; therefore, our approach can be used for real-time detection.
The remainder of the paper is structured as follows: Section 2 discusses the related work, Section 3 defines various types of OOD data and formulates the detection problem, Section 4 introduces the VAE for classification and regression model and presents the detection algorithm, Section 5 utilizes several experiments to evaluate the proposed approach, and Section 6 provides concluding remarks.
Related Work
OOD detection in deep neural networks has received considerable attention, and multiple approaches for different application domains have been developed. The SoftMax score is utilized in Hendrycks and Gimpel (Citation2017) to distinguish the in- and out-of-distribution examples. The idea is that in a well-trained neural network, the maximum SoftMax scores for in-distribution examples should be higher than those for OOD examples. In DeVries and Taylor (Citation2018), an additional branch in the neural network is introduced to estimate the learning confidence, and the learned confidence estimates can be used for OOD detection.
Conformal Anomaly Detection (CAD) framework can provide well-calibrated error rates for anomaly detection (Laxhammar and Falkman Citation2015). The framework allows using different NonConformity Measures (NCMs) to evaluate the differences between test instances and the training dataset. Kernel Density Estimation (KDE) NCM (Smith et al. Citation2014) and -nearest neighbor NCM with Euclidian distance measure (Laxhammar and Falkman Citation2010) can be utilized for detecting point-wise anomalies, while sub-sequence local outlier factor NCM (Laxhammar and Falkman Citation2015) and
-nearest neighbor NCM with Hausdorff distance NCM (Laxhammar and Falkman Citation2011) can be performed for detecting sequence-wise anomalies. However, such NCMs struggle to cope with the high-dimensional inputs. Based on the CAD framework, Cai and Koutsoukos (Citation2020) first proposes to leverage the deep neural networks such as Variational AutoEncoders (VAEs) to compute nonconformity scores for high-dimensional inputs efficiently. Thereafter, a series of works adopt different neural networks trying to improve the performance of the detection (Feng, Ng, and Easwaran Citation2021; Kaur et al. Citation2022; Ramakrishna et al. Citation2022).
When considering the distribution of a test dataset in place of a single test instance, the OOD detection problem turns into the dataset shift detection problem. The effect of dataset shifts on the performance of models is investigated in Shimodaira (Citation2000), where a reweighing method – Maximum Weighted Log-likelihood Estimate (MWLE), is proposed to improve the performance of models. Huang, Gretton, Borg-wardt, Sch¨olkopf, and Smola (Huang et al. Citation2007) discusses another robust reweighing method aiming to covariate shift called Kernel Mean Matching (KMM). Such a KMM approach is adapted to label shifts in classification problems (Zhang et al. Citation2013). Label concept shifts are analyzed in Moreno-Torres et al. (Citation2012) and, in general, are very difficult to detect.
Out-Of-Distribution Data in Learning-Enabled Cyber-Physical Systems
Formal Definition of Out-Of-Distribution Data
Before diving into the detection of different types of OOD data in learning-enabled CPSs, in this section, we will analyze the causes of different OOD data and categorize them based on the underlying dataset shifts.
OOD Data Caused by Covariate Shift
One of the most common dataset shifts encountered in the real-world problem is the covariate shift (Sugiyama, Krauledat, and Mãžller Citation2007). Suppose that an LEC is trained with the dataset
. A typical assumption is that inputs
are independent and identically distributed (IID) drawn from
. Given
, the LEC can make predictions for some
according to the probabilistic model
. Covariate shift is encountered when the input distribution
shifts between the training and test scenarios but the conditional relationship
remains the same. Generalizing this definition, OOD data caused by covariate shift can be defined as the data where the input
does not come from the same distribution as training dataset
whereas the prediction model
stays unchanged.
OOD Data Caused by Label Shift
Label shift is the opposite of the covariate shift, which describes the case where the distribution over the output variable changes after training phase but the conditional probability of
given
stays unchanged. OOD data caused by label shift can be defined as the data where the output
is no longer generated from the distribution
after training while the output-conditional model
does not change.
OOD Data Caused by Concept Shift
Concept shift occurs when the relationship changes between the training and test phases, while the input distribution is preserved (Vorburger and Bernstein Citation2006). Using the definition, for the OOD data caused by concept shift, we assume that the covariate variable
is from the same distribution as the training dataset
whereas the conditional probability
changes such that
.
OOD Data Caused by Label Concept Shift
Label concept shift is the contrary definition of concept shift, where the distribution over the output stays unchanged, while the output-conditional probability shifts. OOD data caused by label concept shift can be defined as the data where the output
is generated from the training distribution
but the output-conditional probabilistic model
changes, i.e.
.
Examples of OOD Data
Classification
Consider the well-known digit recognition problem for the MNIST dataset (LeCun et al. Citation1998). A classification model is trained on the MNIST dataset, which only contains black and white handwritten digits. However, if a colorful handwritten digit or a handwritten digit with a different background is used as a test input, such a classification model is very likely to make an erroneous prediction. In this case, the test images are not from the training distribution. However, the classification results ought to be independent of the color or the background of the digits, and therefore the underlying relationship should not change. Such test examples are typical OOD data caused by covariate shift. Further, the classification model can be influenced by other types of OOD data, such as OOD data caused by label shift, for example, when the probability distribution for the digit class
is not uniform or some classes of digits are not present in the training dataset.
OOD data caused by label concept shift arise in fault diagnosis and identification, where a classification model is used to predict the type of fault based on sensor measurements. For example, consider the fault diagnosis model for a gearbox (PHM data challenge, Citation2009) which aims at classifying the damage type that may occur. Typically, the model is trained using data obtained under specific load conditions and tested under similar conditions resulting in satisfying accuracy. However, if the model is tested under a higher load condition, the performance will be degraded. In this case, although damage types in the test examples are still the same, the underlying relationship changes due to additional load.
Regression
Covariate shifts occur in perception LECs used in autonomous vehicles. Consider, for example, an Advanced Emergency Braking System (AEBS) for an automobile that is designed to detect obstacles (Cai and Koutsoukos Citation2020). In this case, the perception LEC performs regression, and its performance can be degraded in the case of OOD data caused by covariate shift which arises when the environmental conditions for the test data are different from conditions considered during training. Such components may also be susceptible to OOD data caused by label shift. Similar to the classification problem, it is typically assumed that the output variable, e.g., distance to the obstacle, is uniformly distributed. However, in real-life situations, the collected training data may not match this assumption. Further, it is usually assumed that the vehicle types conform to standard specifications (e.g., size and shape). However, such specifications may change, for example, in response to autonomous vehicle technologies and the regression model may fail to predict the distance to a vehicle of type or size not used during training. In this case, the output-conditional probabilistic model shifts, and such data should be considered as OOD data caused by label concept shift. Additional examples and datasets relating to applications in industrial informatics are evaluated in Section 5.
Problem Formulation
Consider an LEC that is well trained to perform classification or regression using a labeled training dataset
. While the system is running, the inputs
are sequentially fed to and consumed by the LEC to predict corresponding targets
. Such a model is assumed to be deployed in a system where test instances are sampled from the training distribution. Nevertheless, as the training dataset is necessarily incomplete, the LEC
may receive OOD test data pair
, fail to make faithful predictions, and further threaten the system’s safety. Therefore, it is crucial to quantify a degree to which OOD data are present in the input sequence. OOD detection should consider all the various types of OOD data that may be present. Further, the detection algorithms must be robust and computationally efficient so they can be executed in real-time.
Detection of Out-Of-Distribution Data in Learning-Enabled Cyber-Physical Systems
VAE for Classification and Regression
Variational AutoEncoder (VAE) is an autoencoder introduced by Kingma and Welling (Citation2014), which models the relationship between high-dimensional observations and representations in a latent space in a probabilistic manner. Aiming to disentangle the representations by the regression variable, a VAE for regression model is presented in Zhao et al. (Citation2019), where the latent space is conditioned by the output of an additional regression branch. Such a model can be adapted for the classification problem, and shows the architecture of the VAE for classification and regression model. The predictor module in the figure can be a standard classification or regression network.
Figure 1. Variational autoencoder for classification and regression model. Note that “Predictor” can be a classification or regression network.
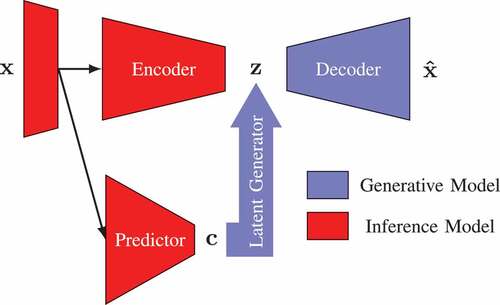
The essential of this model is to condition the latent encodings on the target variable
inferred by the predictor, which performs classification or regression. Consequently, the prior distribution of the latent variables can be described using a conditional Gaussian distribution
. Specifically, compared with the VAE, there are two additional components: the predictor and the latent generator. The predictor employs a model
to infer the target
, which, in turn, is transformed by the latent generator to condition the latent representation
. The form of the target variable
is a one-hot encoding in the case of the classification task and a predicted scalar in the case of the regression task. The VAE for classification and regression model can be trained in two distinct phases: the prediction and the VAE phase. During the prediction phase, the predictor is trained to perform the classification or regression task regularizing the predicted class probability with the actual labels. The parameters of the predictor network are fixed after the prediction phase. Then, during the VAE phase, the following loss function is employed to jointly train the encoder, decoder, and latent generator,
The first term, the reconstruction term, is designed to enable the decoder to reconstruct the input from the latent representation as accurately as possible. The second term, the regularization term, aims to minimize the Kullback-Leibler (KL) divergence between the approximate posterior and the desired prior, a conditional Gaussian distribution .
In practice, the balance between these two terms should be carefully tuned to trade off the fidelity of reconstruction against the quality of samples from the model (Rybkin, Daniilidis, and Levine Citation2021). Recently, a calibrated decoder architecture called -VAE, which can automatically tune the trade-off and improve the quality of the generated samples, is developed in Rybkin, Daniilidis, and Levine (Citation2021). The idea of
-VAE is to add a weighting parameter
between the reconstruction term and regularization term. The parameter
can be computed analytically and does not require manual tuning. Implementation details can be found in Rybkin, Daniilidis, and Levine (Citation2021). This technique can also be used with the proposed VAE for classification and regression model in a similar fashion by adding the weighting parameter
in the reconstruction term in Equationequation (1)
(1)
(1) .
Inductive Out-Of-Distribution Detection
Our approach is built upon the Inductive Conformal Anomaly Detection (ICAD) framework, where a suitable NonConformity Measure (NCM) is required to evaluate the strangeness of a test example relative to the training dataset (Laxhammar and Falkman Citation2015). The VAE for classification and regression models are used to define the NCM. There are two significant benefits of using such models. First, the approach can scale up to the high-dimensional inputs and second, the model encodes both input and output variables of the regression or classification tasks into the latent representations, and consequently, can be used to detect different types of OOD data.
Nonconformity Measures
A test input and its predictive label
are encoded as
in the latent space of the VAE for classification and regression model, and subsequently, the decoder module reconstructs a similar example
. If the input-output pair
is sampled from the same joint distribution
as the training dataset, the test instance
will be reconstructed accurately. Therefore, the squared error between the test input
and its reconstructed example
, or the reconstruction error, can be defined as an NCM
It is possible that some input features have rare or no contribution to the LEC prediction. Taking an image input as an example, such an NCM will bring about a large nonconformity score when the generative model struggles to reconstruct the fine-granularity details. Therefore, the nonconformity of input features should be evaluated based on their contribution to the LEC output. Layer-wise Relevance Propagation (LRP) is a typical saliency map technique that attributes high relevance scores to input features contributing most to the predictions (Bach et al. Citation2015). Considering an input , by propagating the prediction backward in the predictor portion of the VAE for classification and regression model, LRP computes the relevance score for each pixel of the input. Because different inputs will have different total contributions, the relevance should be normalized by the sum of contributions for all features in the input. Let us define a function
to denote the LRP algorithm computing the relevance map
for a given input
. The NCM with LRP is computed by weighting the reconstruction error for each input feature using the relevance score, which is defined as
An important property introduced by the VAE for classification and regression models is that the latent representations are disentangled by the target variable. Specifically, in the classification problem, the representations will be clustered by the target class. Therefore, for a test example and its prediction
, the distance of its representation
to the corresponding class center
can be defined as the distance-based NCM
where the center can be computed as the mean of the representations of the training data with the class label
. Note that such distance-based NCM cannot be used for regression since the target variable is continuous.
Detection Method
The proposed method operates in two phases, offline and online. During the offline phase, our approach first randomly divides the original labeled training dataset into two parts, the proper training dataset
and the calibration dataset
. It then trains a VAE for classification and regression model using the proper training dataset
. For each calibration example
, the encoder portion of the model approximates a posterior distribution in the latent space, and then a single point
is sampled from it. The nonconformity score
of this example can be computed by the NCMs defined earlier (Equationequation (2)
(2)
(2) , Equationequation (3)
(3)
(3) and Equationequation (4)
(4)
(4) ). Specifically, for the reconstruction-based NCMs
and
, the sampled point
is used to reconstruct the input; for the distance-based NCMs
, the sampled point
is directly used to compute the distance to the cluster center. The last step of offline phase is to sort the nonconformity scores of calibration data as
for online detection.
During the online detection phase, the test inputs arrive at the VAE for classification and regression model sequentially, which are used to make predictions for the underlying task in the CPS and are also used to perform the detection task. Based on the approach in Cai and Koutsoukos (Citation2020), multiple examples are incorporated to improve the robustness of the detection. Given a test input
, a posterior is estimated in the latent space, and
points
are sampled from it. Then, for each sampled point
, we compute its nonconformity score
using the NCM
, which is the same as the NCM used for calibration data. The
-value
for each nonconformity score
is calculated as the ratio of calibration nonconformity scores that are not less than
:
If the test data comes from a distribution similar to the training distribution, most of values in this
-value set
should be relatively larger than
. However, if many small values presented in the
-value set, the test example
is very likely to be an OOD example. A martingale can be used to test if many small
-values are present in the set (Fedorova et al. Citation2012)
If the test example is OOD, the martingale value
will increase dramatically. Further, as described in Cai and Koutsoukos (Citation2020), a stateful cumulative sum (CUSUM) detector
can be used to detect and raise alarms on the consistently large martingale values. It should be noted that, if the input is not an example in a time sequence, the stateful CUSUM detector should be omitted, and the martingale value can be used for detection directly.
Evaluation
In this section, we evaluate the proposed approach on several datasets for both classification and regression tasks. All experiments are performed on a desktop PC with a -core Ryzen 5 CPU and a single GTX 1080Ti GPU.
IoT Network Intrusion
Experimental Setup
The number of Internet of Things (IoT) devices has grown dramatically over the past few years, providing a large surface to deploy malicious cyberattacks. Intrusion detection in IoT networks is very significant for mitigating such attacks. We use two IoT intrusion datasets, N-BaIoT (Meidan et al. Citation2018) and IoTID20 (Ullah and Mahmoud Citation2020), to evaluate the proposed approach. N-BaIoT is a multivariate sequential dataset collected from commercial IoT devices using two of the most prevailing botnet families: BASHLITE and Mirai. Our experiments focus on the data collected on a WiFi video doorbell. The dataset has
features extracted from the network packets, including packet size, packet count, etc. IoTID20 is another IoT botnet dataset collected from
typical IoT devices – a smart speaker and a WiFi camera. The dataset has
features extracted from raw network packet files. Compared with N-BaIoT, IoTID20 has more types of IoT attacks, including
categories and
subcategories. However, the data in IoTID20 are not sequential. The entire IoTID20 dataset is utilized in our evaluation. In the following, we design and conduct different experiments using these two datasets to demonstrate our approach for detecting various types of OOD data.
Evaluation Metrics
Different evaluation metrics are used for non-sequential and sequential data, respectively. For non-sequential data, a threshold-free metric, AUROC, is used to assess the detection performance, which can be interpreted as the probability that the detector assigns a nonconformity score for in-distribution data to be lower than OOD data. For sequential data, the number of false alarms, including false positives and false negatives, is used to evaluate the performance. We run the detection algorithm against multiple in-distribution and OOD sequences. We consider in-distribution sequences as false positives if alarms are raised and OOD sequences as false negatives if no alarm is raised.
Novelty Detection for Unknown Classes
Data from unknown classes are a typical case of OOD data caused by label shift. In this experiment, the training dataset includes not only the normal data but also some types of intrusion data. The objective is to detect the unknown types of intrusion data. Specifically, for the experiment using the N-BaIoT dataset, the training dataset consists of the normal data and data under attack by the BASHLITE botnet, and the data under attack by Mirai are considered as the OOD data caused by label shift. In the IoTID20 dataset, normal data and two categories of intrusion data (DoS and Mirai) are included in the training dataset, and the rest two categories (MITM and Scan) are the unknown classes. We note that because this experiment is deliberately designed to evaluate the method for detecting OOD data caused by label shift, the literature does not report results on the specific datasets and configurations.
We train both VAE for classification and -VAE for classification models. The VAE architecture is similar to the autoencoder architecture in Meidan et al. (Citation2018). For the N-BaIoT dataset, we select
normal sequences,
sequences attacked by BASHLITE, and
sequences attacked by Mirai as the test sequences. We report the false positives and false negatives by considering different numbers of generated examples
, CUSUM detection parameters
and
, and learning models (VAE and
-VAE for classification) in . We use the reconstruction-based NCMs and distance-based NCMs for both learning models. The results show that all four different methods can detect novelty for unknown classes with zero false alarms.
Table 1. False alarms for detecting OOD data in N-BaIot dataset.
Table 2. Classification accuracy and AUROC for detecting OOD data in gearbox dataset.
For the IoTID20 dataset, the AUROCs are reported in for different learning models and NCMs. For reconstruction-based NCMs, the method using -VAE for classification has a larger AUROC than using VAE for classification showing the
-VAE for classification model can improve the reconstruction quality, and further improve the detection performance. As for the distance-based NCMs, it is interesting that the method using
-VAE for classification model performs worse than the method using VAE for classification. This is because the disentanglement ability of
-VAE for classification model is not as good as VAE for classification model. Further, we also report the AUROCs based on generating a single example from the latent space, and the evaluation results demonstrate the performance improvement by incorporating multiple examples.
Intrusion Detection
In order to compare our approach with existing work, we consider intrusion detection without classifying the type of attack. Meidan et al. (Citation2018) employs a deep autoencoder to detect malicious intrusions for the N-BaIoT dataset. In the experiment, only the normal data are used for training. The intrusion detection experiment can be viewed as a case for OOD data caused by label shift because only the data from the normal class are included in the training dataset. It should be noted that the VAE for classification model degrades to a VAE model as only one class is used to train the model. For the N-BaIoT dataset, we select normal sequences,
sequences attacked by BASHLITE, and
sequences attacked by Mirai as the test sequences. We report the false positives and false negatives by considering different numbers of generated examples
, CUSUM detection parameters
and
, NCMs, and learning models in . From the results, both methods can also achieve the same zero false alarms for detecting intrusions as the deep autoencoder method in Meidan et al. (Citation2018). In practice, as more data are collected, more categories of labeled intrusion data will be present in the training dataset and a VAE for classification can be used.
For the IoTID20 dataset, we report the AUROCs by considering different learning models in . From the table, we can see that the AUROCs of the methods using -VAE for classification are greater than those using VAE for classification, reflecting again that the improvement in quality of generated examples can also enhance the detection performance.
Gearbox Fault Detection
We evaluate the performance of detecting OOD data caused by label concept shift using a gearbox fault detection dataset (PHM data challenge, Citation2009). The objective is to classify the damage types of the gearbox by using the measurements from accelerometers mounted on various locations. In this experiment, we consider the output shaft vibration data. The gearbox operates under the normal behavior and five different types of fault behavior. For each behavior, low- and high-load conditions are simulated to generate two sub-datasets, respectively. The sub-dataset from low-load condition (including all normal and fault data) is used as the training dataset to train a VAE for classification model. On the contrary, the data from the high-load condition are regarded as the OOD data. The classification labels or the fault types keep unchanged between two sub-datasets, but the working condition or the output-conditional probabilistic model has changed. Therefore, OOD data from different working conditions can be viewed as the OOD data caused by label concept shift, and this experiment is designed to evaluate the proposed approach for detecting such kind of OOD data.
The encoder portion of the VAE for classification model consists of four fully connected layers with units, and the decoder has the symmetric architecture of encoder. The AUROCs and the classification accuracy are reported in . The classification accuracy for In-Distribution (ID) data is much higher than for Out-Of-Distribution (OOD) data due to the change in conditional probability. The results reveal that the method using
does not have a promising performance as the method using
.
MNIST Dataset
In this subsection, to demonstrate that our approach can also apply to the image input, we evaluate the approach on a well-known digit recognition dataset, MNIST (LeCun et al. Citation1998). We first design an experiment to detect the OOD data caused by covariate shift. The encoder and latent generator portions of the VAE for the classification model used in this experiment are listed in . The classifier has a similar architecture to the encoder but its last layer is a fully connected layer with units, and the decoder is mirrored from the encoder. For the test data, the colorful MNIST (Su et al. Citation2020) and SVHN (Netzer et al. Citation2011) are used as the OOD dataset. These two datasets have the same labels of ten digits as the MNIST dataset; however, the input images are collected from different scenarios: the colorful MNIST images are synthesized by the MNIST image with colorful backgrounds, and SVHN images are the digit images from street view house numbers. Because the test input does not come from the same distribution as the training dataset, but the underlying relationship between input and output remains the same, the data from these two datasets are the OOD data caused by covariate shift. We report AUROCs in using different NCMs. All the AUROCs are almost close to
, which demonstrates that the method can detect the OOD input images caused by covariate shift.
Table 3. AUROC for detecting OOD data in MNIST dataset.
Table 4. VAE for classification architecture in MNIST.
We also evaluate our approach for detecting the OOD input image caused by label shift using the MNIST dataset. In our experiment, following the experimental protocol in Chen et al. (Citation2020), six digits in MNIST are randomly selected as known classes, while the remaining four digits are unknown. The data from unknown classes can be viewed as the OOD data caused by label shift. The AUROCs using different NCMs are shown in . The results also reveal that the reconstruction-based NCM using -VAE for classification performs better than the NCM using VAE for classification. The distance-based NCM using VAE for classification model has a comparable performance with the reconstruction-based NCM using
-VAE for classification model.
Moreover, we also perform the ablation analysis by directly using the VAE-based method introduced in Cai and Koutsoukos (Citation2020) to detect the OOD examples. The results of using VAE-based method are reported in denoted by . Although there is no difference between the methods using VAE and VAE for classification in the detection of OOD data caused by covariate shift, as for the OOD data caused by label shift, the novel method using VAE for classification obviously reveals better performance than the VAE-based method. This is because the VAE for classification takes into account not only the input but also the output.
Advanced Emergency Braking System
We also evaluate the approach using a perception LEC of the Advanced Emergency Braking System (AEBS). The system attempts to predict the distance to the approaching obstacle and applies an appropriate brake to stop the host vehicle safely, avoiding the potential collision. We implement the AEBS in an autonomous driving simulator – CARLA (Dosovitskiy et al. Citation2017). The perception LEC is a typical regression LEC whose objective is to predict the distance to the nearest front obstacle by consuming the images. In order to collect the training dataset, we control the precipitation parameter available in CARLA, which is randomly sampled between and
. We totally collect labeled
images to construct the training dataset, which are almost balanced between
and
. Then, the training dataset is randomly divided into two sets: a proper training set (
images) and a calibration set (
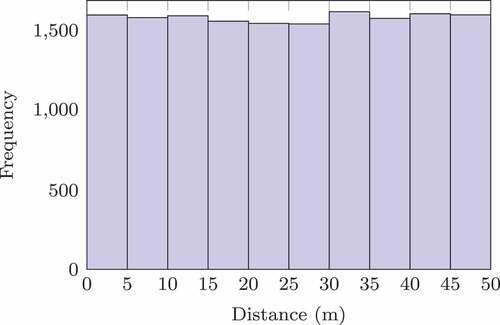
images). The histogram of ground-truth distance for the training data set is plotted in , which shows that the amount of data corresponding to each interval of the distance range under consideration is almost equal.
Figure 2. Histogram of ground-truth distance in training dataset.
We implement the VAE for regression model using a convolutional neural network, whose encoder and latent generator modules are listed in . The regressor has almost the same architecture as the encoder but two additional dense layers with and
units. The decoder has a symmetric architecture of encoder. The regressor is successfully trained with satisfying training and test errors after
-epoch training. Additionally, we plot the low-dimensional representations of the latent encodings in by applying t-SNE (Maaten and Hinton Citation2008). The distance-related dimensions are well disentangled in the latent space using the VAE for regression model.
Figure 3. The 2D embedded features visualized by t-SNE.
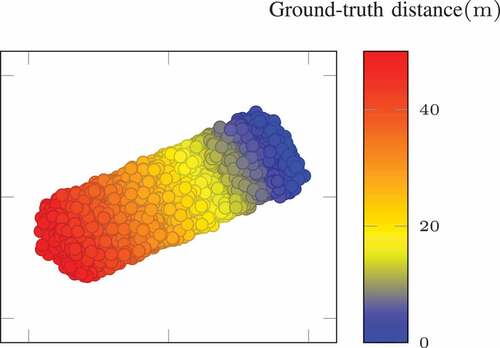
Table 5. VAE for regression architecture in AEBS.
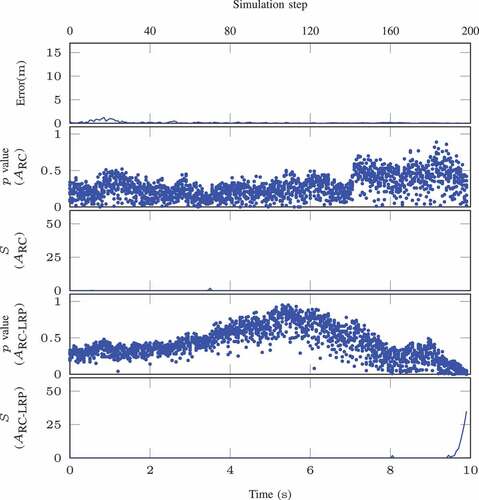
We precompute and sort the nonconformity scores for the calibration data for the online detection. In the online phase, examples are generated from the VAE for regression model for each test example. The proposed approach is firstly illustrated using an in-distribution epoch in , where the prediction error of the regression module, the
-values, and CUSUM detector outputs are plotted. Both reconstruction-based NCMs with and without LRP are employed in our experiments, and their results are shown in . From the plots, we can see that, for in-distribution data, the
-values of both NCMs are greater than
resulting in low detector values during the whole episode, which indicates there are no OOD data presented in the sequence.
Figure 4. An episode with in-distribution data in AEBS (detector parameter: ,
,
).
In AEBS, the precipitation parameter can be controlled to enforce the input of test examples out of the distribution of the training dataset. Specifically, the precipitation parameter in images of the training dataset is randomly sampled between and
; however, in testing, the precipitation parameter is from a different distribution
.
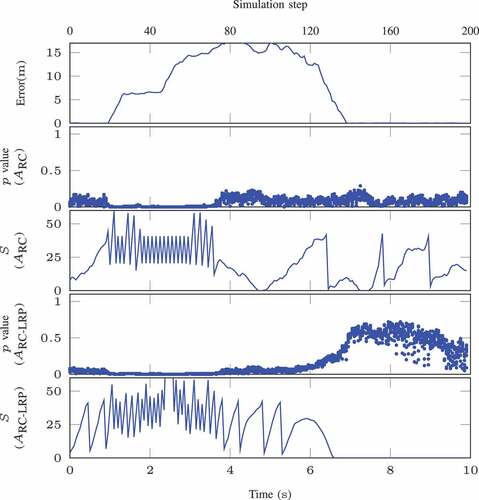
An OOD episode caused by such precipitation shift is plotted in . The prediction errors are conspicuously greater than those of in-distribution episode, which can surpass m. The
-values for both NCMs are relatively small (close to
), and the detector
reveals the OOD data are present in the sequence. We evaluate the approach using total
episodes,
of which are in-distribution episodes and
are out-of-distribution episodes caused by covariate shift. We report the false positives and false negatives for detection of such specific type of OOD data using two different NCMs
and
in . From the results, we can see that the method can be used for detecting OOD data caused by covariate shift with few false alarms.
Figure 5. An episode with OOD data caused by covariate shift in AEBS (detector parameter: ,
,
).
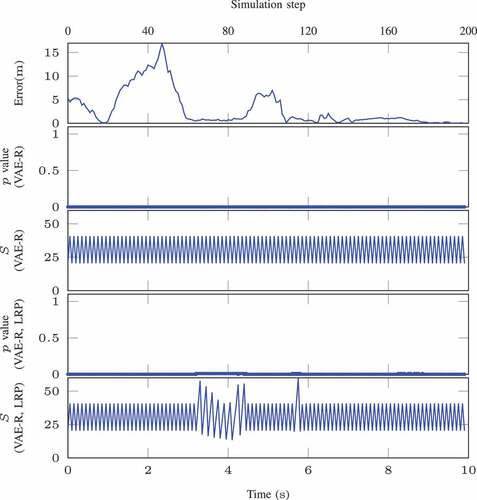
Table 6. False alarms for detecting OOD data in AEBS.
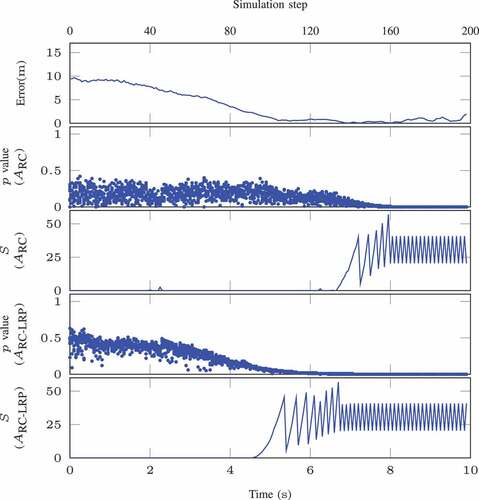
For OOD data caused by label shift, the training dataset excludes all data ranging from m to
m, which is illustrated in . We retrain the VAE for regression model and report the false alarms for detecting such type of OOD data in . The results show that the proposed method can be used for detecting OOD data caused by label shift. The method using NCM with LRP has fewer false alarms than without LRP, which validates that the LRP algorithm can improve the robustness of the detection. An OOD episode caused by label shift is presented in , where the data cover from
m to
m. The LEC fails to estimate accurate distances to the obstacle. In the plots,
-values approach zero and the detector values
grow dramatically, indicating the presence of OOD data during the episode.
Figure 6. Histogram of ground-truth distance of training dataset that excludes data ranging from to
.
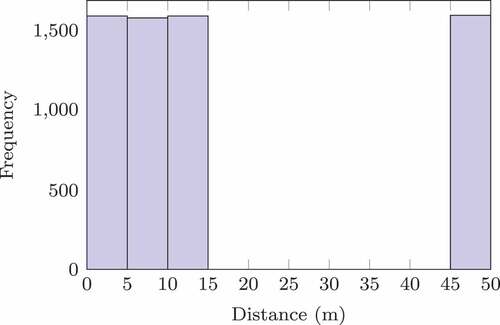
Figure 7. An episode with OOD data caused by label shift in AEBS (detector parameter: ,
,
).
We also evaluate the approach for detecting OOD data caused by label concept shift. In this experiment, we introduce a double-size leading vehicle and collect episodes doubling the size of the leading vehicle for testing. The distribution of the distance keeps unchanged, and the OOD data is caused by changes in the relationship between the image and distance. Therefore, such OOD data can be viewed as OOD data caused by label concept shift. The results of one episode are illustrated in . It is reasonable to see that the predicted distance is much less than the ground-truth distance at the beginning of the OOD episode since the double-size car occupies more pixels in the image than the normal-size car. The
-value becomes small and the detector indicates the OOD data are present in the test episode. From the experiment, we observe that the method with LRP has a shorter detection delay compared to the one without LRP since the LRP makes the NCM concentrate on features contributing most to the LEC output. We report the false alarms for detecting such OOD data in , which demonstrates the effectiveness of our approach for detecting such type of OOD data in AEBS.
Figure 8. An episode with OOD data caused by label concept shift in AEBS (detector parameter: ,
,
).
Computational Efficiency
The timeliness is significant for detection tasks applied in CPS. Therefore, we take the AEBS as an example and measure the execution time of using different NCMs in one episode of the experiment. We plot the results in the boxplot in . Note that as the number of points sampled from the posterior in the latent space increases, the execution time of the detection method will also increase. We fix the number
at
when measuring these execution times. From the plot, we can observe that the execution time of the method using LRP is slightly longer than that of the method not using LRP because of the LRP computations. Besides, since the execution time of the detection approach is less than the operational period of the AEBS, 50, the proposed detection method can be operated in real-time.
Figure 9. Execution times of proposed method.
Conclusions
This paper discusses the causes of the OOD data and categorizes them into four different types. Focusing on such OOD data, we propose a detection approach based on the ICAD framework, which utilizes VAE for classification and regression models to compute the nonconformity measures. Since such models take not only LEC inputs but also LEC outputs into consideration, it is beneficial to the detection of different types of OOD data. We designed and conducted multiple experiments for classification and regression tasks, and the results show that the proposed method can detect different types of OOD data with a relatively small number of false alarms. Further, our approach can be used for real-time detection due to the short execution time. A promising direction to improve the detection performance is to incorporate attention mechanisms into VAE models.
Acknowledgement
The material presented in this paper is based upon work supported by the Defense Advanced Research Projects Agency (DARPA) through contract number FA8750-18-C-0089. The views and conclusions contained herein are those of the authors and should not be interpreted as necessarily representing the official policies or endorsements, either expressed or implied of DARPA.
Disclosure statement
No potential conflict of interest was reported by the author(s).
Additional information
Funding
References
- Bach, S., A. Binder, G. Montavon, F. Klauschen, K.-R. Müller, and W. Samek. 2015. On pixel-wise explanations for non-linear classifier decisions by layer-wise relevance propagation. PloS One 10 (7):e0130140.
- Cai, F., and X. Koutsoukos (2020). Real-time out-of-distribution detection in learning-enabled cyber-physical systems. In Proceedings of the acm/ieee 11th international conference on cyber-physical systems. Sydney, Australia.
- Chen, G., L. Qiao … et al (2020,). Learning open set network with discriminative reciprocal points. In The european conference on computer vision (eccv). Glasgow, UK.
- DeVries, T., and G. W. Taylor. 2018. Learning confidence for out-of-distribution detection in neural networks. arXiv preprint abs/1802.04865.
- Dosovitskiy, A., G. Ros, F. Codevilla, A. López, and V. Koltun (2017). CARLA: An open urban driving simulator. In Proceedings of the 1st annual conference on robot learning. Mountain View, USA.
- Fedorova, V., A. J. Gammerman, I. Nouretdinov, and V. Vovk (2012). Plug-in martingales for testing exchangeability on-line. In Proceedings of the 29th international conference on machine learning. Edinburgh, Scotland, UK.
- Feng, Y., D. J. X. Ng, and A. Easwaran. 2021. Improving variational autoencoder based out- of-distribution detection for embedded real-time applications. ACM Transactions on Embedded Computing Systems (TECS) 20 (5s):1–23.
- Hendrycks, D., and K. Gimpel (2017). A baseline for detecting misclassified and out-of- distribution examples in neural networks. In Proceedings of the 5th international conference on learning representations. Toulon, France.
- Huang, J., A. Gretton, K. Borgwardt, B. Sch¨olkopf, and A. J. Smola. 2007. Correcting sample selection bias by unlabeled data. In Proceedings of the annual conference on neural information processing systems. Vancouver, Canada. .
- Kaur, R., K. Sridhar, S. Park, S. Jha, A. Roy, O. Sokolsky, and I. Lee. 2022. Codit: Conformal out-of-distribution detection in time-series data. arXiv Preprint, abs/2207.11769.
- Kingma, D. P., and M. Welling (2014). Auto-encoding variational bayes. In Proceedings of the 2nd international conference on learning representations. Banff, Canada.
- Laxhammar, R., and G. Falkman (2010). Conformal prediction for distribution-independent anomaly detection in streaming vessel data. In 1st international workshop on novel data stream pattern mining techniques. New York, United States.
- Laxhammar, R., and G. Falkman (2011). Sequential conformal anomaly detection in trajec- tories based on Hausdorff distance. In Proceedings of the 14th international conference on information fusion. Chicago, USA.
- Laxhammar, R., and G. Falkman. 2015. Inductive conformal anomaly detection for sequential detection of anomalous sub-trajectories. Annals of Mathematics and Artificial Intelligence 74:67–94.
- LeCun, Y., L. Bottou, Y. Bengio, and P. Haffner. 1998. Gradient-based learning applied to document recognition. Proceedings of the IEEE 86 (11):2278–324. doi:10.1109/5.726791.
- Maaten, L. V. D., and G. Hinton. 2008. Visualizing data using t-sne. Journal of Machine Learning Research 9 (Nov):2579–605.
- Meidan, Y., M. Bohadana, Y. Mathov, Y. Mirsky, A. Shabtai, D. Breitenbacher, and Y. Elovici. 2018. N-baiot - network-based detection of iot botnet attacks using deep autoencoders. IEEE Pervasive Computing 17 (3):12–22.
- Moreno-Torres, J. G., T. Raeder, R. Alaiz-Rodríguez, N. V. Chawla, and F. Herrera. 2012. A unifying view on dataset shift in classification. Pattern Recognition 45 (1):521–30. doi:10.1016/j.patcog.2011.06.019.
- Netzer, Y., T. Wang, A. Coates, A. Bissacco, B. Wu, and A. Y. Ng (2011). Reading digits in natural images with unsupervised feature learning. In Workshop track proceedings of the 25th annual conference on neural information processing systems. Granada, Spain.
- Phm data challenge. (2009). http://www.phmsociety.org/competition/09. ( Accessed: 2009-09-28)
- Quionero-Candela, J., M. Sugiyama, A. Schwaighofer, and N. D. Lawrence. 2009. Dataset shift in machine learning. Cambridge, Massachusetts: The MIT Press.
- Ramakrishna, S., Z. RahimiNasab, G. Karsai, A. Easwaran, and A. Dubey. 2022. Efficient out-of-distribution detection using latent space of β-vae for cyber-physical systems. ACM Transactions on Cyber-Physical Systems (TCPS) 6 (2):1–34.
- Rybkin, O., K. Daniilidis, and S. Levine (2021). Simple and effective VAE training with cali- brated decoders. In Proceedings of the 38th international conference on machine learning. Virtual.
- Shimodaira, H. 2000. Improving predictive inference under covariate shift by weighting the log-likelihood function. Journal of Statistical Planning and Inference 90 (2):227–44. doi:10.1016/S0378-3758(00)00115-4.
- Smith, J., I. Nouretdinov, R. Craddock, C. Offer, and A. Gammerman (2014). Anomaly detection of trajectories with kernel density estimation by conformal prediction. In Proceedings of the international conference on artificial intelligence applications and innovations. Rhodes, Greece.
- Sugiyama, M., M. Krauledat, and K.-R. Mãžller. 2007. Covariate shift adaptation by importance weighted cross validation. Journal of Machine Learning Research 8 (May):985–1005.
- Su, X., Y. Jiang, S. Guo, and F. Chen. 2020. Task understanding from confusing multi-task data.In Proceedings of the 37th international conference on machine learning. Virtual.
- Ullah, I., and Q. H. Mahmoud (2020). A scheme for generating a dataset for anomalous activity detection in iot networks. In Canadian conference on ai Ottawa, Canada. (pp. 508–20).
- Vorburger, P., and A. Bernstein (2006). Entropy-based concept shift detection. In Sixth international conference on data mining. Hong Kong, China.
- Yan, C., C. Wang, X. Xiang, Z. Lan, and Y. Jiang (2021). Deep reinforcement learning of collision-free flocking policies for multiple fixed-wing UAVs using local situation maps IEEE Transactions on Industrial Informatics. 18 1260-–1270 . .
- Zhang, K., B. Sch¨olkopf, K. Muandet, and Z. Wang (2013). Domain adaptation under target and conditional shift. In International conference on machine learning Atlanta, USA. (pp. 819–27).
- Zhao, Q., E. Adeli, N. Honnorat, T. Leng, and K. M. Pohl (2019). Variational autoencoder for regression: Application to brain aging analysis. In Proceedings of the 22nd international conference on medical image computing and computer assisted intervention. Shenzhen, China.