
 ?Mathematical formulae have been encoded as MathML and are displayed in this HTML version using MathJax in order to improve their display. Uncheck the box to turn MathJax off. This feature requires Javascript. Click on a formula to zoom.
ABSTRACT
Groundwater (GW) is a key source of drinking water and irrigation to combat growing food insecurity and for improved water access in rural sub-Saharan Africa. However, there are limited studies due to data scarcity in the region. New modeling techniques such as Machine learning (ML) are found robust and promising tools to assess GW recharge with less expensive data. The study utilized ML technique in GW recharge prediction for selected locations to assess sustainability of GW resources in Ghana. Two artificial neural networks (ANN) models namely Feedforward Neural Network with Multilayer Perceptron (FNN-MLP) and Extreme Learning Machine (FNN-ELM) were used for the prediction of GW using 58 years (1960–2018) of GW data. Model evaluation between FNN-MLP and FNN-ELM showed that the former approach was better in predicting GW with R2 ranging from 0.97 to 0.99 while the latter has an R2 between 0.42 to 0.68. The overall performance of both models was acceptable and suggests that ANN is a useful forecasting tool for GW assessment. The outcomes from this study will add value to the current methods of GW assessment and development, which is one of the pillars of the sustainable development goals (SDG 6).
Introduction
Increased access to quality food and water supply is considered part of human rights and became among the high priorities in the global agendas (Bartram and Cairncross Citation2010; Funk and Brown Citation2009). However, food and water scarcity may be exacerbated by climate change, population growth, and urbanization. On the other hand, the current agriculture system in sub-Saharan Africa (SSA) is predominantly rainfed and it is vulnerable to rainfall variability and changing climate (MacDonald et al. Citation2012; UNEP Citation2010). Currently, only 5% of the arable land in Africa is irrigated (Siebert et al. Citation2010) and there is growing interest to expand irrigation to meet rising food demands. Climate variability has been posing significant uncertainty in the management and distribution of water resources, especially on GW. For example, the Intergovernmental Panel on Climate Change (IPCC) predicted an increase in temperature of about 1.5°C over the next 100 years (Masson-Delmotte et al. Citation2018). Africa is likely to have a greater mean annual warming than the global annual mean warming in all seasons with the subtropics getting drier than moist tropics(Barros and Field Citation2014; Seneviratne et al. Citation2012). Moreover, precipitation is projected to decrease in the near, mid, and far future (Siabi et al. Citation2021; Yeboah et al. Citation2022). GW resources are connected to climate change through the direct relationship with surface water resources (rivers and lakes) and indirectly through the process of recharge. Especially, the surface water sources are affected by competing needs such as hydropower production, irrigation, transport, recreation, and domestic and industrial water supply (Kabo-Bah et al. Citation2016). Direct impacts of climate change on GW resources rely upon the variation in the volume and distribution of GW recharge. Also, a reduction in precipitation and higher evapotranspiration may result in a reduced availability of water for GW. Inferring from (Shrestha et al. Citation2018), variability of temperature, rising heat waves, and intensified degrees of evaporation affect rainfall intensity and thus reduce or increase groundwater recharge. However, climate change alone decreased the annual surface water (runoff), precipitation, and GW recharge by 28 to 150 mm in 2006 and 32 to 204 mm in 2007 across the white Volta basin (Obuobie Citation2008a).
The extraction of GW has been extensive in developing countries for domestic, agricultural, municipal, commercial, and industrial supply causing significant GW depletion in many places over the last decades (Konikow and Kendy Citation2005). For instance, countries such as India and South Africa are experiencing depletion in their available GW leading to declining water levels, well dry-ups, water quality reduction, rise in pumping costs, and reduction in good yields (Wang, Jin, and Li Citation2009). As such, many watersheds are experiencing severe environmental, social, and financial problems (Tsanis and Apostolaki Citation2009). Although many of the SSA countries’ GW use has been minimal, the rate of use is increasing over time, which calls for robust GW monitoring and forecasting that aid sustainable GW use in the face of an increasing population and water demand as well as threat from climate change (Adamowski and Sun Citation2010; Sethi et al. Citation2010).
The sustainable use of the GW, therefore, requires understanding the available water resources in basins to make informed decisions.
Over the last decades, Machine Learning (ML) has gained popularity in hydrological studies including GW prediction due to its performance and accuracy (Guzman et al. Citation2015; El Ibrahimi et al. Citation2017). Over the last decade, several studies across the globe have applied ML with different setups in GW level prediction (Kayhomayoon et al. Citation2021; Moghaddam et al. Citation2019). However, the use of ML in the prediction of GW recharge is still gray, especially in Ghana and SSA as a whole. To the best of the author’s knowledge based on literature, there is no study on the application of FNN-MLP and FNN-ELM for GW recharge prediction in SSA.
This study, therefore, aimed to apply ML to predict GW recharge in Ghana where a large part of the country depends on GW for basic water demands. This research will provide insights on how to sustainably manage GW in Ghana for water supply, sanitation, and irrigation. The outcomes from the research are anticipated to add value to the importance of GW to address the goal of SDG 6 and raise awareness for a national forum on protecting GW resources. Also, these outcomes are expected to provide relevant information to agencies such as the Ghana Water Company Ltd (G.W.C.L.), Community Water and Sanitation Agency (C.W.SA.), Water Research Institute (W.R.I.), Hydrological Services Department, and the Water Resources Commission (W.R.C.), who work in the area of potable water provision, safeguarding and advising on issues pertaining to water resources in the country.
Literature Review
Artificial Neural Network
GW modeling has become one of the most important subjects in the field of hydrology. This is because it assists decision-makers to determine the water balance status. Conventional models have been widely used in the modeling of GW resources over the past years. However, these models are limited practically and temporally (Milan, Roozbahani, and Ebrahim Banihabib Citation2018). Aside from this, these models require accurate data (which is scarce in many parts of the world) as input variables to make predictions. For instance, autoregressive, autoregressive moving average, and autoregressive integrated moving average models have been employed invariably in different studies (Moghaddam et al. Citation2019), however, these models cannot incorporate non-linear and non-stationary features of the data structure (Maier and Dandy Citation1996). Therefore, the different artificial intelligence techniques are now available to employ especially for regions where there are scarce and inaccurate data (Moghaddam et al. Citation2019; Nguyen et al. Citation2020; Pham et al. Citation2019). These intelligent models, such as artificial neural networks (ANN), have been proven to perform well in predictions (Ahmadi et al. Citation2022). The ANN has been noted to perform well in modeling non-stationary and non-linear problems as well as capable of learning relationships among variables without complex mathematics and associations. Utilizing the least available data, ANN can develop a regression model for the prediction of an output with good performance (Kayhomayoon et al. Citation2021). ANN especially the feedforward neural network remains the most widely used and accurate algorithm, despite the model performance not based on the choice of model but instead on the input data content (Ahmadi et al. Citation2022).
Several studies have employed ANN with different setups for GW resource studies. Whereas some studies investigated the different ANN setups, other studies focused on the performance of ANN with other models. For instance, (Kayhomayoon et al. Citation2021) optimized ANN with two advanced optimization methods (particle swam and whale optimization) to simulate regional GW levels. The validation scores in terms of RMSE, NSE, and MAPE ranged from 0.001–0.006, 0.97–0.99, and 0.05–0.30 respectively for different clusters based on water recharge, precipitation, water discharge, water table, transmissivity, and earth level. The study concluded that the simulation accuracy of ANN can improve with the presence of optimization algorithms. Di Nunno and Granata (Citation2020) used the NARX neural network to predict GW level in the Apulia region. The performance of the NARX neural network relied on the location of wells on different hydrogeological structures and is affected by the GW resources management issues. Other studies such as (Lallahem et al. Citation2005; Nguyen et al. Citation2020; Taormina, Wing Chau, and Sethi Citation2012) have revealed the satisfactory performance of ANN with different setups in GW level prediction and simulation. Gibson (Citation2020) employed the Neural Network Autoregression (NNAR) to predict the GW level of two aquifers in South Africa. The results of the study show a good overall performance of the NNAR model in predicting GW levels.
In other studies, ANN was compared with other ML models to assess their performance. For instance (Moghaddam et al. Citation2019) compared the performance of the MODFLOW, Bayesian Network (BN), and ANN in forecasting GW levels. The Bayesian Network was found to outperform the MODFLOW, and ANN with an R2 of 0.90 compared to 0.72, and 0.76, respectively.
Moghaddam et al. (2021) also employed the Group method of data handling model, BN, and ANN in aquifer GW level prediction based on spatial clustering. The Group method of data handling model performed better than the BN and ANN with 0.074 RMSE, 0.97 NASH, 0.0037 MAPE, and 0.97 R2. In another study, (Kanyama et al. Citation2020) utilized the decision trees, support vector regression, random forest regression, FFN-MLP, and gradient boosting tree models for predicting GW levels in the Grootfontein Aquifer in the North West Province of South Africa. The gradient boosting trees model emerged as the best model.
For GW level prediction with other ML models, Pham et al. (Citation2022) in a comparative study used seven ML models in predicting GW levels in a drought-prone area. Random Tree and Forest were found to outperform the other ML models. Kayhomayoon et al. (Citation2021), applied Artificial intelligence and machine learning in predicting GW storage loss. The study utilized Harris Hawks Optimization Adaptive Neuro-Fuzzy Inference System (HHO-ANFIS) and the Least-Squares Support Vector Machine (LS-SVM). Both models performed well, however, the HHO-ANFIS was the best model. Moreover, (Gaffoor et al. Citation2022) used an autoregressive approach to predict monthly GW level changes in Ramostwa aquifers of Southern Africa. This produced a satisfactory result. Furthermore, (Mozaffari et al. Citation2022) used the Support Vector Regression (SVR) models, Bayesian models as well as a hybrid SVR optimized with the Particle Swarm Optimization to predict the GW level of the Zanjan aquifer in Iran. The hybrid SVR optimized with the Particle Swarm Optimization was found to perform well than the other models in terms of R2 and RMSE. For further details on the application of ML in GW level modeling see (Ahmadi et al. Citation2022).
Extreme Learning Machine
Comparing the conventional FNN models to the FFN-ELM, the FFN-ELM has more strength in terms of over- and under-learning behaviors as well as an iterative learning process. Due to the presence of bias in the output layer of the FNN-ELM, the ELM model is able to accomplish the learning process in one-step operations (Abba, Elkiran, and Nourani Citation2021; Huang et al. Citation2019). This results in a reduction in training time required which enhances performance compared to the conventional FNN models. Moreover, the universal approximation capacities of the ELM allow it to offer a universal global solution. As a result, several studies have applied the ELM to the modeling of hydrological problems with good reports in terms of performance (Abba, Elkiran, and Nourani Citation2021; Hadi et al. Citation2019; Yaseen et al. Citation2019). Also, in a comparative study, (Niu and Feng Citation2021) compared the performance of ELM, ANN, Support Vector Machine (SVM), Gaussian process regression (GPR), and Adaptive Neural-based Fuzzy Inference System (ANFIS) in forecasting daily streamflow time-series. The study revealed that the ELM, SVR, and GPR can produce better results compared to the ANN and ANFIS.
Other studies coupled the ELM with other models for hydrological studies. For instance, Feng, Niu, and Liu (Citation2021) coupled ELM with the Cooperation Search Algorithm to predict the runoff of selected hydrological stations in China. Moreover, Di Nunno et al., (Fabio et al. Citation2022) compared the performance of the NARX neural network and Extreme learning machine (ELM) neural network in forecasting GW level in northern Bangladesh. The results showed that the NAXR models performed better in predicting long-term GW levels compared to the ELM. Whereas the NARX models attained R2 ranging from 0.918 to 0.947, the ELM attained R2 ranging from 0.675 to 0.825. Huang, Yu Zhu, and Kheong Siew (Citation2006), Sahoo, Ray, and Wade (Citation2005); Yaseen et al. (Citation2019), and Abba et al. (Citation2020) presented a detailed review of the ELM model and its real-world application in their studies.
It is evident that most studies focused on ML applications to the GW level. However, there are few or no studies on the application of ML in GW recharge prediction. Again, most studies have applied different combinations and comparisons of ML algorithms in GW level prediction. However, no study was found to compare the performance of the FNN-MLP and FNN-ELM.
Material and Methods
Methodology
Simulation models form one of the most important decision-supporting tools in water resources management. These models are highly efficient despite the sophisticated challenges observed in the GW sector. The study uses two artificial neural networks (ANN) models (the Feedforward Neural Network and the Extreme learning Machine) for GW prediction. The performance of both models was assessed to determine the applicability and suitability of machine learning in GW prediction in data-scarce regions.
Study Area
The study used four hydro-climatic stations which are located in the Volta basin, Ghana. The Volta basin is the largest in Ghana and has four main tributaries which are the Black, Oti, White, and Lower Volta basins. Each of the tributaries was represented by one hydro-climatic station. The hydro-climatic stations selected were Akuse, Wenchi, Ketekrachi, and Tamale representing the Lower, Black, Oti, and White Volta tributaries, respectively (). The Volta basin covers approximately 238,538 km2 which accounts for ~70% of the overall area of Ghana, especially the Central and Northern parts of Ghana (Anayah et al. Citation2013a) (). Agriculture is the dominant land cover (~57%) of Ghana (Anayah et al. Citation2013b) in which subsistence agriculture forms the backbone of the local economy in Ghana (Lutz et al. Citation2015). The majority of the Ghanaian population (>68%) are rural smallholder farmers in which agriculture employs about 67% of the labor force (Amoako-Tuffour and Sackey Citation2008). There is high climatic variability in Ghana (Siabi et al. Citation2021) where the northern part of the country is semi-arid with a mono-modal rainfall distribution while the southern part is subtropical humid with a bimodal rainfall distribution (see ). The average annual precipitation is about 1086 mm, 1249 mm, 1357 mm, and 1086 mm Akuse, Wenchi, Ketekrachi, and Tamale respectively. The average daily temperature across Ghana varies between 26.4°C and 29.3°C (see ) (Anayah et al. Citation2013).
Figure 1. Map of Ghana showing the location of the study site.
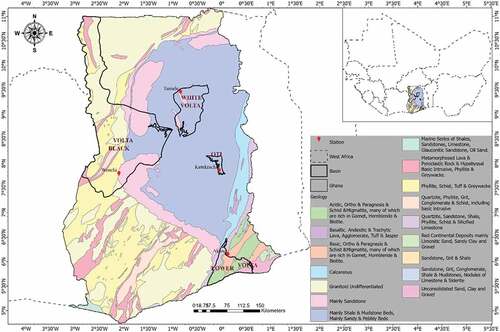
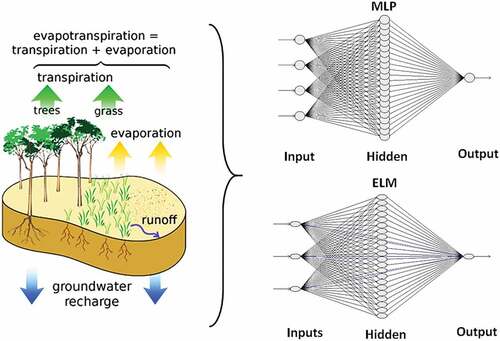
Figure 2. Conceptual diagram showing the structure of the study modified from (Toews Citation2007) and a typical framework for feed-forward neural network with the multi-layer perceptron (FFN-MLP) and extreme learning machine (FFN-ELM) models.
Ghana has a relatively undulating topography with gentle slopes where the average elevation is 190 meters above sea level. The country is largely dominated by sandy loam, loam, and gravel soils. The content of gravels in the sandy soils increases with depth, which indicates lower soil stability, but better drainage during the rainy season (O’Driscoll et al. Citation2010). The geology of the Volta basin is made up of shale, mudstone, sandy and pebbly beds, sandstone, siltstone, and arkose (Lutz et al. Citation2015). The primary porosity of sandstone in the Volta basin is clogged due to cementation and consolidation leading to GW recharge only through fractures of different forms of confinement conditions (Kortatsi Citation1994) and (Acheampong and Hess Citation2000). The fractures are serving as a continuum or an unconfined aquifer in most hydrological studies (Schneider et al. Citation2011) and (Lloyd Citation1999) since the GW recharge is assumed to occur as infiltration through the rock matrix (Gyau-Boakye Citation2001).
Data and Station Selection
The four major tributaries of the Volta basin were delineated using the 90 m resolution Digital Elevation Model (DEM). The study sites were characterized using rainfall and temperature data collected from the Ghana Meteorological Agency (GMA). The selection of the stations was determined based on the quality of the available data. Since some climate stations have significant missing data, the study periods of the stations were different to capture periods where there was complete data. All the stations have data for the period 1960–2018 except Akuse which has data for the period 1964–2016 ().
Table 1. Description of the daily climate data used in the four weather stations in the volta basin.
Groundwater Recharge Estimation and Machine Learning Prediction
GW recharge is one of the most challenging components of the water balance to estimate because it cannot be measured directly (Qu et al. Citation2010). There are multiple methods available for computing GW recharge with weaknesses and strengths (Scanlon, Healy, and Cook Citation2002). The study empirically estimated GW recharge using the Modified Chaturvedi method. This formed the input variable for the ML algorithms for GW recharge prediction. Also, the relationship between the predicted GW recharge and other climate variables, such as Precipitation, PET, Tmax, and Tmin, was established to ascertain the response of GW recharge to climate.
Modified Chaturvedi Natural GW Recharge Estimation
Chaturvedi derived an empirical equation that expresses recharge as a function of annual precipitation (EquationEquation 1(1)
(1) ). However, the GW recharge was estimated using a modified empirical Chaturvedi natural GW recharge estimation method (Chaturvedi 1936) as cited in (Kumar 2009), which uses annual precipitation (Kumar Citation2011).
Where R is net annual recharge in inches and P is annual precipitation in inches. EquationEquation (1)(1)
(1) was further modified by U.P. Irrigation Research Institute, Rooke as in Equationequation (2)
(2)
(2) .
The study employed the modified equation due to the similarities between the Indian monsoons climate where they were developed and the humid subtropical climate of Ghana. For instance, both countries are heavily dependent on rainfall during the summer monsoon (Flore, Janicot, and Kiladis Citation2008, 8; Taraz Citation2017). The monsoons in both regions undergo interdecadal variability in the form of wet and dry phases. The monsoons in both regions cause mean rainfall to vary more from decade to decade than it would be if rainfall was independent and identically distributed (Flore, Janicot, and Kiladis Citation2008; Taraz Citation2017). Different studies in West Africa (Abdullahi et al. Citation2018; Adeleke et al. Citation2015; Oke et al. Citation2013), India (Bera et al. Citation2021; Kumar and Seethapathi Citation2002) and across the world (Saghravani et al. Citation2013).
Coefficients of Recharge Estimation
The coefficient of recharge was estimated as the recharge ratio to effective rainfall and given in Eqn 3 as a percentage (Moseki Citation2017). This was selected to estimate the proportion of effective precipitation that may potentially become recharge in the study area and it is given as;
Where R = the recharge and Pe = The effective rainfall. The equation is applicable in the study area because similar studies (Abdullahi et al. Citation2018; Adeleke et al. Citation2015; Oke et al. Citation2013) utilized this equation in estimating the coefficients of recharge in West Africa.
Direct Runoff Estimation
Direct runoff was estimated using the water budget developed by (Ako Citation1979) and expressed as:
Where Roff = Direct Runoff and P = Precipitation. This was used to estimate the run-offs during precipitation events which may be GW after vertical infiltration in macropores or through soil matrix (Bengtsson Citation2011) in the study area. Previous studies (Abdullahi et al. Citation2018; Adeleke et al. Citation2015; Oke et al. Citation2013) applied this equation in their study area which is similar to this current study.
Potential Evapotranspiration Estimation
The study used the Hargreaves empirical formula (Hargreaves and Samani Citation1985) to estimate Potential evapotranspiration (PET) since it requires only maximum and minimum temperature, and extra-terrestrial radiation data which is extracted based on the location and Julian date as presented by (Zhang Citation2019). This method was used because of its basic input prerequisite being maximum, minimum, mean temperature, and extra-terrestrial radiation data (Zhang Citation2019):
ETH is the potential evapotranspiration (mm/d), Tmax and Tmin are maximum and minimum temperature (oC) respectively, Rs is solar radiation (mm/d) KRS is Hargreaves empirical coefficient, Ra is the extra-terrestrial radiation (mm/d), E is Equationequation (2)(2)
(2) parameter.
Substituting Equationequation (2)(2)
(2) in to Equationequation (1)
(1)
(1) , ETH is given as (Zhang Citation2019):
Where [C = 0.0023(KRS = 0.16, C = 0.0135KRS), E = 0.5, T = 17.8]
Therefore, the Hargreaves equation is given as (Zhang Citation2019):
Where Ra was estimated using station latitude as (Zhang Citation2019):
Where GSC (Solar constant) = 0.082MJm−2min−1, dr = earth-sun distance; ωs is solar altitude.
dr was given as (Zhang Citation2019):
Where J (Julian day) = 1,2, 3 … …365/366
Machine Learning Algorithms for GW Recharge Estimation
The study used Feed-forward Neural Network with the Multi-layer perceptron (FFN-MLP) and Extreme Learning Machine (FFN-ELM) to estimate GW recharge. Both models consist of an input layer, a hidden layer with 22 neurons, and an output layer (). The input layer was the estimated GW recharge from the Chaturvedi model (from 1960–2018) while the output layers were the predicted and forecasted GW recharge. The data were divided into training and testing. Data spanning from 1960 to 2010 was used for training and validation whereas the rest of the data was used for testing. Also, the hidden layer contained the number of neurons selected for the study. The optimum number of neurons was determined with trial-and-error processes using Mean Squared Error (MSE) between the estimated GW recharge and the predicted recharge as the measure of selection for an optimum model (Adamowski and Sun Citation2010). Since there is no well-established method for selecting the number of neurons in a hidden layer, a trial-and-error approach was used to determine optimal models (Daliakopoulos, Coulibaly, and Tsanis Citation2005). shows a typical FFN-MLP and FFN-ELM and the structure of the study modified from (Toews Citation2007).
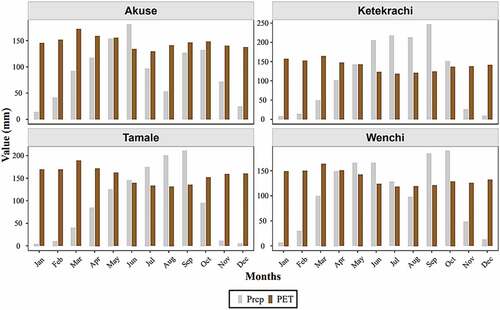
Figure 3. Average monthly rainfall and PET for the four studied stations.
The analysis was conducted based on the nnfor R package version 0.9.6 (Kourentzes Citation2019). Nnfor is an automatic time-series modeling package with capabilities of semi-manual or fully manual specification of networks. The nnfor package concurrently tracks training and validation errors during training and validation sets. During the training, the MSE at the validation set was tracked and if this error increases subsequently for approximately 50 epochs, the training is halted. An epoch is a complete pass through the training set (Epoch Definition | DeepAI.”|“Epoch Definition | DeepAI Citationn.d). Therefore, to reduce training errors, initial training was done with different random starting weights and biases (i.e. the trainable parameters of the model), which are helpful to deeply explore the error surface (Crone and Kourentzes Citation2010; Kourentzes, Barrow, and Crone Citation2014). Since training of a neural network is a complex optimization process, the initial training helps to prevent the model from being trapped in the local minima of the error surface. Moreover, initial training decreases training time and helps to achieve reasonable out-of-sample performance, thereby avoiding over-fitting of the training sample (Kourentzes, Barrow, and Crone Citation2014).
Comparison and Evaluation of Model Performance
The performance of the ML models was evaluated to select the best model that predicted GW recharge better (El Ibrahimi and Baali Citation2017). The coefficient of determination (R2), Mean Square Error (MSE), Root Mean Square Error (RMSE), and Nash-Sutcliffe coefficient (NSE) were used to evaluate the agreement between observed GW recharge (i.e. the estimated GW recharge from the Chaturvedi model) and predicted GW recharge by the ML models.
where, is the observed GW recharge;
is the predicted GW recharge;
is the average of observed GW recharge, and
is the number of observations.
ranges from 0 to 1, where models providing an
values ≥0.5 were considered satisfactory while those that provide values ≥0.7 were considered very good (Willmott Citation1981). NSE ranges from -∞ to 1, where ≥0.5 are satisfactory, and values ≥0.7 are very good (Nash and Sutcliffe Citation1970). The smaller the RMSE and MSE, the better the model performance.
Results
Potential Evapotranspiration Estimation (PET)
The rainfall in the studied climatic stations showed both uni-modal and bi-modal patterns. For stations which are located in Northern Ghana such as Tamale and Ketekrachi, a uni-modal rainfall pattern with peaks in September was observed while for stations in Southern Ghana (i.e. Wenchi and Akuse) a bi-modal rainfall pattern with peaks in June and October was observed (). PET generally decreased from January to December across all the stations (). The highest PET of approximately 188 mm was found in Tamale followed by Akuse of about 172 mm. The Highest amount of PET at Ketekrachi and Wenchi stations was similar at ~164 mm (). The smallest PET was observed in July and August in all of the stations. However, the highest PET occurred from November to March. This suggested that water availability in these months may be limited and aquifers may be vulnerable to drying up, especially in the Harmattan season.
GW Recharge
The estimated average annual GW recharge in the studied areas ranged from ~182 mm to 214 mm accounting for 16% to 17% of the average annual rainfall (). GW recharge in Ghana was higher in areas, such as Ketekrachi and Wenchi, but it was lower in Akuse and Tamale. In terms of direct run-offs, Ketekrachi recorded the highest percentage of rainfall (24%). This affected the rate of rainfall that recharges GW aquifers (). The Oti basin (where Ketekrachi is located) has steep topography, which can affect direct runoff. GW recharge decreased where PET increased. For instance, Tamale recorded the highest PET of about 1839 mm followed by Akuse (1726 mm), this affected GW recharge to about 182 mm and 181 mm respectively (see ). This may be attributed to the location of Tamale in northern Ghana. The northern parts of Ghana are vulnerable to climate change and variability as a result of their location in the savannah climate zone as compared to the southern part of Ghana. Northern Ghana records the highest temperatures with low annual rainfall.
Table 2. Average annual potential evapotranspiration (PET), runoff, and groundwater (GW) recharge (mm) and their percentages to the average annual precipitation (P). DR refers to direct runoff.
GW Recharge Prediction Using FFN-MLP and FFN-ELM
The performance of FFN-MLP and FFN-ELM models to predict GW recharge (see. ) was satisfactory based on the R2 goodness-of-fit measure, which ranged between 0.97 to 0.99 and 0.42 to 0.68, respectively (). Comparing the two models, the FFN-MLP showed better performance in predicting estimated GW recharge (). For example, from , the standard deviations of FFN-MLP for all the stations were better in representing the corresponding variables of the observed GW recharge as compared to the FFN-ELM. Also, the overall Nash-Sutcliffe efficiency of FFN-MLP for all the stations ranged between 97% and 99% while that of FFN-ELM ranged between 41% and 66%. Moreover, the FFN-ELM showed an overall under-prediction with MSE ranging from approximately 184 to 362, which was about 20 times more than the MSE of FFN-MLP, which ranged between 2.05 and 13.59. In terms of RMSE, the FFN-MLP outperformed FFN-ELM. FFN-MLP had an RMSE value of 3.69 while the RMSE for the FFN-ELM was 19.1. Although the FFN-ELM could not simulate the extreme GW recharge well, both models equally reproduced the observed GW recharge at the Akuse station (, ). Similarly, both models simulated well the observed GW recharge at Ketekrachi except that the FFN-ELM failed to capture the extreme GW recharge (), which affected the performance of the FFN-ELM model (). Although both models tried to mimic the observed GW recharge at Wenchi, the performance of both models was relatively weaker as compared to the other stations (). At Tamale, the performance of FFN-MLP was good, but the FFN-ELM failed to reproduce the extreme GW recharge (, ).
Figure 4. Training and prediction of FFN-MLP and FFN-ELM using observed GW recharge data at Akuse, Ketekrachi Wenchi, and Tamale.
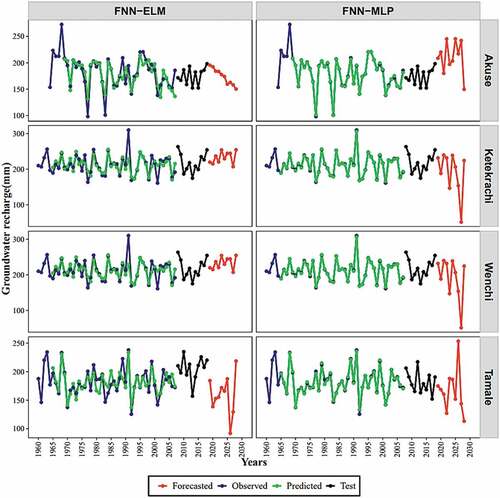
Figure 5. Correlation between observed and predicted GW recharge in selected stations in Ghana.
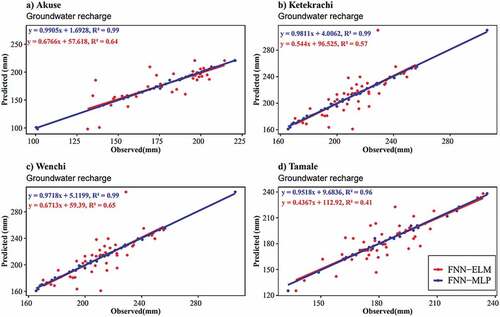
Table 3. Summary statistics of observed and predicted GW recharge for the four studied stations in Ghana.
Discussion
Potential Evapotranspiration and Impacts on GW Recharge in Ghana
The seasonal trend analysis showed () that higher PET may occur in March before the onset of rains. However, the trend decreases as the major and minor rainfall seasons progress due to the shift of the Inter-tropical Discontinuity (ITD) toward the north in early March (Osei et al. Citation2019). This may be due to an increase in humidity and monsoonal clouds that reduce PET by reducing evaporative demand. The results showed that PET consistently reduces during the rainy season from June to September with minor increases in the dry season. The PET values were found to increase considerably from southern Ghana to the North due to increased rainfall and temperature (Kabo-Bah et al. Citation2016). This conforms with the study of (Carrier et al. Citation2008) which found similar south to north increasing PET trend in Ghana. Rainfall, for instance, plays a major role in explaining uncertainties in the estimation for PET. However, rainfall decreases significantly from north to south in Ghana. This conforms with the study of (Carrier et al. Citation2008) which found a south-south-west to north-north-east PET trend in Ghana. Rainfall varied significantly from northern to southern Ghana () and this was also reported by (Anayah et al. Citation2013). Therefore, an increase in PET, combined with variations in precipitation has the potential to modify the hydrological cycle especially GW recharge of any region (Rodríguez-Huerta, Rosas-Casals, and Margarita Hernández-Terrones Citation2020). Since shallow GW storage serves as the main source of water for plants with a deep root system, the increase in PET may deplete this storage. This, therefore, may cause wilting to most plants, especially natural vegetation and grasses. The water shortage and/or drought situation may get worse in the basins which are located in northern Ghana since forested trees with deep roots may use the shallow groundwater during the dry season (Osei et al. Citation2019). As a consequence, all the major dimensions of food security (i.e. availability, accessibility, utilization, and stability) and livelihoods may be at risk. For instance, the Upper East region has 21% of the consumption budget for food compared national average of 8% (GSS Citation2010).
Comparing the mean annual PET of the selected stations to other studies, the mean annual PET observed at Tamale was 1839 mm compared to the PET estimates by other studies at Tamale showing 1861 mm (Owusu et al. Citation2017), 1952 mm (Anayah et al. Citation2013), and 1944 mm (Carrier et al. Citation2008) of mean annual PET. For Wenchi, the average annual PET was estimated to be 1599 mm compared to 1484 mm (Anayah et al. Citation2013) and 1472 mm (Carrier et al. Citation2008). At Ketekrachi, the average annual PET was estimated to be 1635 mm compared to1592 mm (Anayah et al. Citation2013) and 1582 mm (Carrier et al. Citation2008). Overall, the estimations of PET are similar to the estimates of previous studies undertaken in the Volta Basin.
Surface Runoff and GW Recharge Estimations
Surface Runoff Estimation and Impacts on GW Recharge Prediction
Proper surface runoff estimation forms an important role in accurately estimating GW recharge. However, the lack of surface runoff data availability in the Volta Basin made the model calibration and validation difficult (Anayah et al. Citation2013; Carrier et al. Citation2008). As a result, several studies were conducted using different approaches to estimate surface runoff. For example, (Ako Citation1979) used a direct runoff estimation method to estimate a water budget in south-western Nigeria, which has a similar agroclimatic condition to Ghana. Other studies (e.g. (Andreini et al. Citation2000; Barry et al. Citation2005; Carrier et al. Citation2008)) used constant runoff coefficient to estimate runoff as a function of rainfall. The drawbacks of runoff coefficient methods are that they may overestimate surface runoff in moist regions (Anayah et al. Citation2013). This is mainly due to the contributions from base and interflows. As such runoff estimation using runoff coefficient methods may increase the uncertainty of the recharge predictions. This study, however, employed the direct runoff estimation developed by (Ako Citation1979), which provided comparable estimates with other research (; (Adeleke et al. Citation2015)).
Table 4. Comparison of estimated annual GW recharge in the study and prior studies. The comparison was done using absolute estimates and ratios to rainfall estimates.
GW Recharge Potentials in Ghana
GW recharge in Ghana was generally low (). The GW recharge estimates were similar to estimates in other studies (e.g. (Anayah et al. Citation2013)). Among the studied stations, GW recharge was higher at the Ketekrachi and Wenchi. Ketekrachi is found in the semi-arid climatic zone of Ghana where water scarcity is a major issue (Lutz et al. Citation2015). The results suggest that sufficient GW recharge is available in this part of Ghana to replenish the aquifer system. Thus, the higher GW recharge may support the demand for potable water supply in this part of Ghana, which is negatively affected by climate change. However, although the highest average GW recharge was observed at Ketekrachi, the GW recharge rate (16%) was relatively lower. This conforms with the findings of (Anayah et al. Citation2013) who reported lower recharge rates from the Oti basin but contradicts the findings of (Gumma and Pavelic Citation2013), and (Forkuor et al. Citation2013) that found most parts of the black Volta and Oti basin fall within a good GW potential zone. The Oti basin has steep topography, which led to a low average recharge rate in these parts of Ghana (Mark et al. Citation2019; Nonterah, Xu, and Osae Citation2019) (). Overall, the findings of this study showed that the Volta basin has a low recharge rate (17%), as shown in other studies (Sood, Muthuwatta, and McCartney Citation2013). Anayah et al., (Anayah et al. Citation2013) recorded an annual mean recharge rate of 23% across the Volta basin, which is fairly different from this study (i.e. about a 5% difference). The difference between this study and that of (Anayah et al. Citation2013) could be attributed to the different methods employed in the estimation of GW recharge, and underlying data used in the studies. For example, both studies used rainfall data that span different periods, which could lead to a difference in results. The decrease in GW recharge in certain parts of Ghana calls for an integrated approach to watershed management that considers spatial variability within the country. This is because, with lower GW recharge, shallow GW irrigation may not be a viable option. This could adversely affect the livelihoods of the people in and around the basin and amplify the vulnerability and plight of farmers.
Generally, the results suggest the development of GW irrigation and related energy policies since energy is crucial for the sustainable development of GW resources (Shah, Giordano, and Mukherji Citation2012). Managing aquifer recharge through decentralized water resources management approaches may help to counter the decreasing natural GW recharge. This approach has been applied successfully in other arid and semi-arid regions (Lopez‐gunn and Ramón Llamas Citation2008; Sheng Citation2005). Moreover, other approaches to improving water productivity should be encouraged. A continuum of water storage in the soil moisture, GW, and reservoirs may address water scarcity issues (MacCartney and Smakhtin Citation2010). For example, GW storage may conjunctively be used with surface water storage to increase the robustness of the less vulnerable surface-water storage systems. Such systems not only aid in increasing water availability during water scarcity but could also, if scaled up and efficiently managed and designed, help to reduce flood flows (Sood, Muthuwatta, and McCartney Citation2013).
Comparison of GW Recharge Estimations
The GW recharge estimated by different methods provided a modest difference among studies (). For example, the GW estimation based on water balance employed by (Anayah et al. Citation2013) showed maximum GW recharge for Ghana at 41% of rainfall with an average recharge reaching up to 23% of rainfall in a wet year. The recharge decreased up to 11% during drier years. (Friesen et al. Citation2005) applying the Thornthwaite-Mather recharge model estimated a maximum GW recharge rate of 10% during a rainy year in Ghana. Studies (Carrier et al. Citation2008; Nyagwambo Citation2006; Obuobie Citation2008b; Sena et al. Citation2019) that employed Chloride mass balance for the GW recharge estimation showed modest difference (see ) although a significant difference was observed in studies conducted in the Upper East region (Martin Citation2006; Obuobie Citation2008b). For example, studies in the Upper East region, (Obuobie Citation2008b) reported a GW recharge rate between 3.4% and 18.5% whilst [53] reported a GW recharge rate between 3% and 6.2%. However, (Akurugu, Pax Chegbeleh, and Mark Yidana Citation2019) estimated a 21% rate of GW recharge in the Upper East region. The GW recharge rate estimated in the current study using the modified Chaturvedi method, therefore, was a modest estimate which conformed with the average GW recharge rate estimated by several studies in Ghana ().
GW recharge fluctuates in semi-arid regions, such as Ghana where the aquifer, is replenished only during short periods of rainfall season (Şen Citation2015). In the south-western part of Ghana where a moist climate is present with bimodal precipitation high GW recharge is prevalent (Anayah et al. Citation2013). A study conducted by (Alfa et al. Citation2011) in the Densu basin located in the south-eastern part of Ghana reported a recharge rate ranging from 120 mm to 153 mm from different soil types. Developing and enhancing GW resources in Ghana should be given a priority, especially in the northern parts of Ghana where GW resources are the main source of water.
Machine Learning and GW Recharge Prediction
Generally, the performance of both models was good. However, FNN-MLP captured the GW recharge well compared to the FNN-ELM in predicting GW recharge. The ANN has been noted to perform well in modeling non-stationary and non-linear problems as well as capable of learning relationships among variables without complex mathematics and associations. Utilizing the least available data, ANN can develop a regression model for the prediction of output with good performance (Kayhomayoon et al. Citation2021). However, compared to other methods, studies have revealed the ANN model falls short when used without the combination of other models. For instance, the study of (Moghaddam et al. Citation2019) showed that the BN outperforms the ANN. However, the study of (Kardan et al. Citation2021) in predicting GW levels revealed the Group method of data handling model performed better than the BN and ANN. Also, the study of (Mirarabi et al. Citation2019) showed the superiority of the SVR model over the ANN in predicting GW levels. The study of (Kanyama et al. Citation2020) assessed the performance of the decision trees, support vector regression, random forest regression, FFN-MLP, and gradient boosting tree models in predicting GW levels in the Grootfontein Aquifer in the North West Province of South Africa. The gradient boosting trees model emerged as the best model. The performance of ANN is found to boost after combining it with other models. For instance, the study of (×. Huang et al. Citation2019) found that the ANN with multi-layer perceptron (MLP) model performed better than the linear regression model. There was an improvement in the performance of ANN in predicting different clusters based on water recharge, precipitation, water discharge, water table, transmissivity, and earth level. The study concluded that the simulation accuracy of ANN can improve with the presence of optimization algorithms. In trying to predict the pre and post-monsoon GW levels, Kochhar et al., (Kochhar et al. Citation2021) found that the ANN-MLP outperformed the LSTM. Other studies (e.g. (El Ibrahimi et al. Citation2017)) also reported similar findings where Feedforward neural networks with multilayer perceptron performed better than other neural networks.
Although the FNN-ELM trains faster which enhance performance compared to the traditional FNN models, however, the FNN-MLP was found to outperform the FNN-ELM. This is similar to the findings of Kumar et al., (Pandey et al. Citation2020) that the deep learning model with 99% R2 and 0.04 RMSE performed better than the Extreme Learning Machine (ELM) and Gaussian process in predicting GW depth fluctuation. Moreover, the NAXR models performed better in predicting long-term GW levels compared to the ELM after comparing the performance of the NARX neural network and Extreme learning machine (ELM) neural network in forecasting GW levels in northern Bangladesh (Fabio et al. Citation2022). Whereas the NARX models attained R2 ranging from 0.918 to 0.947, the ELM attained R2 ranging from 0.675 to 0.825 (Fabio et al. Citation2022).
Conversely, several studies have applied the ELM to the modeling of hydrological problems with good reports in terms of performance (Hadi et al. Citation2019; Yaseen et al. Citation2019). Also, in a comparative study, (Niu and Feng Citation2021) compared the performance of ELM, ANN, Support Vector Machine (SVM), Gaussian process regression (GPR), and Adaptive Neural-based Fuzzy Inference System (ANFIS) in forecasting daily streamflow time-series. The study revealed that the ELM, SVR, and GPR can produce better results compared to the ANN and ANFIS.
Globally, ANN finds many applications in hydrological studies with many positive outcomes on planning and decision-making efforts toward water resources management (Mohanty et al. Citation2010; Sun et al. Citation2016). Fundamentally, the complex nature of aquifer systems due to the direct consequences of anthropogenic and natural phenomena make its forecasting a major bottleneck (Harter and Walker Citation2001; Qu, Zhou, and Chen Citation2010). However, the constraints surrounding the prediction of recharge of aquifer systems have been greatly curtailed by the advent of empirical models such as the Artificial Neural Networks.
Conclusion
The GW recharge in the Lower, Oti, White, and Black Volta sub-basins was estimated using two ML (FNN-MLP and FNN-ELM) methods. The study showed that there is high Spatio-temporal climate variability in Ghana, which significantly impacts the GW resources. The study found that the GW recharge has a strong correlation with rainfall. The findings showed that both ML methods were successful in estimating and forecasting GW recharge in Ghana; however, the FNN-MLP performed better. This suggests that ML can serve as a useful tool to estimate and forecast water balance components for sustainable water resources management in the face of climate change. It is recommended that further researches focus on combining other techniques such as earth observation and remote sensing techniques with the neural network for GW resources research.
Author Contributions
Siabi K. Ebenezer conducted this research and was Supervised by Amos T. Kabo-Bah, Mark Amo-Boateng, and Geophery K. Anornu. Yihun Dile, and Komlavi Akpoti contributed to the write-up and revision of the paper. Thomas Attah-Darkwa, Christopher Vuu, Peter Donkor, Awo Manson, Samuel Kofi Mensah and Emmanuel K. Opoku contributed to the data collection and analysis for this research.
Disclosure statement
No potential conflict of interest was reported by the author(s).
Additional information
Funding
References
- Abba, S. I., G. Elkiran, and V. Nourani. 2021. Improving novel extreme learning machine using Pca algorithms for multi-parametric modeling of the municipal wastewater treatment plant. Desalination and Water Treatment 215 (October 2019):414–30. doi:10.5004/dwt.2021.26903.
- Abba, S. I., N. Thi Thuy Linh, J. Abdullahi, S. Ismael Albrka Ali, Q. Bao Pham, R. Aliyu Abdulkadir, R. Costache, V. Thai Nam, and D. Tran Anh. 2020. Hybrid machine learning ensemble techniques for modeling dissolved oxygen concentration. IEEE Access 8:157218–37. doi:10.1109/ACCESS.2020.3017743.
- Abdullahi, M. G., M. K. A. Kamarudin, N. A. Wahab, R. Umar, N. A. F. Nik Wan, H. Juahir, M. B. Gasim, Wahab, N. A. 2018. Assessment of natural groundwater recharge in Tudun wada assessment of natural groundwater recharge in tudun wada local government kano state, Nigeria local government Kano state, Nigeria. Journal of Fundamental and Applied Sciences 4 (1):9–10. doi:10.4314/jfas.v10i1s.7.
- Acheampong, S. Y., and J. W. Hess. 2000. Origin of the shallow groundwater system in the southern voltaian sedimentary basin of Ghana: An isotopic approach. Journal of Hydrology 233 (1–4):37–53. doi:10.1016/S0022-1694(00)00221-3.
- Adamowski, J., and K. Sun. 2010. Development of a coupled wavelet transform and neural network method for flow forecasting of non-perennial rivers in semi-arid watersheds. Journal of Hydrology 390 (1–2):85–91. doi:10.1016/j.jhydrol.2010.06.033.
- Adeleke, O. O., V. Makinde, A. O. Eruola, O. F. Dada, A. O. Ojo, and T. J. Aluko. 2015. Estimation of groundwater recharges using empirical formulae in odeda local government area, 271–81. Nigeria: Ogun State. doi:10.3390/challe6020271.
- Ahmadi, A., M. Olyaei, Z. Heydari, M. Emami, A. Zeynolabedin, A. Ghomlaghi, A. Daccache, G. E. Fogg, and M. Sadegh. 2022. Groundwater level modeling with machine learning: A systematic review and meta-analysis. Water (Switzerland) 14 (6):1–22. doi:10.3390/w14060949.
- Ako, B. D. 1979. Geophysical prospecting for groundwater in parts of South-Western Nigeria. Unpublished PhD Thesis., Department of Geology, University of Ife, Ile-Ife, Nigeria, 371.
- Akurugu, B. A., L. Pax Chegbeleh, and S. Mark Yidana. 2019. Characterisation of groundwater flow and recharge in crystalline basement rocks in the Talensi district, Northern Ghana. Journal of African Earth Sciences 161:103665. doi:10.1016/j.jafrearsci.2019.103665.
- Alfa, B., B. Hasholt, N. O. Jørgensen, and B. Banoeng-Yakubo. 2011. Rainfall and water resources of a coastal basin of Ghana. Journal of Hydrologic Engineering 16 (4):316–23. doi:10.1061/(ASCE)HE.1943-5584.0000314.
- Amoako-Tuffour, J., and H. A. Sackey. 2008. Informal sector activities and urban poverty in Ghana: Patterns and poverty policy options. Poverty Reduction Strategies in Action: Perspectives and Lessons from Ghana 243.
- Anayah, F. M., J. J. Kaluarachchi, and P. Pavelic. 2013a. Predicting groundwater recharge in Ghana by estimating evapotranspiration. October 2014 37–41. doi:10.1080/02508060.2013.821642.
- Anayah, F. M., J. J. Kaluarachchi, P. Pavelic, and V. Smakhtin. 2013b. Predicting groundwater recharge in Ghana by estimating evapotranspiration. Water International 38 (4):408–32. doi:10.1080/02508060.2013.821642.
- Andreini, M., N. van de Giesen, A. van Edig, M. Fosu, and W. Andah. 2000. Volta basin water balance Zentrum für Entwicklungsforschung (ZEF) Center for Development Research Walter-Flex-Strasse 3 D – 53113 Bonn Germany 21 21 https://www.econstor.eu/bitstream/10419/84715/1/zef_dp21.pdf .
- Barros, V. R., and C. B. Field. 2014. Climate change 2014: Impacts, adaptation, and vulnerability. Part B: Regional aspects. Cambridge, CB2 8EA: Cambridge University Press pp. 1–1820 9781107415386 https://www.cambridge.org/core/books/climate-change-2014-impacts-adaptation-and-vulnerability-part-b-regional-aspects/036A899BD52861D61B0D519C5F2B9334 doi:https://doi.org/10.1017/CBO9781107415386 .
- Barry, B., E. Obuobie, M. Andreini, W. Andah, and M. Pluquet Rapport, IWMI, CAWMA . 2005. The Volta River basin: Comprehensive Assessment of Water Management in Agriculture Comparative study on river basin development and management. IWMI, CAWMA 1 1–187.
- Bartram, J., and S. Cairncross. 2010. Hygiene, sanitation, and water: Forgotten foundations of health. PLoS Medicine 7 (11):1–10. doi:10.1371/journal.pmed.1000367.
- Bengtsson, L. Singh , Vijay P., Singh, Pratap, Haritashya, Umesh K. 2011. Direct surface runoff Encyclopedia of Snow, Ice and Glaciers Part 4 232- 234 doi:10.1007/978-90-481-2642-2_114 .
- Bera, A., B. Prasad Mukhopadhyay, P. Chowdhury, A. Ghosh, and S. Biswas. 2021. Groundwater vulnerability assessment using GIS-based DRASTIC model in Nangasai River basin, India with special emphasis on agricultural contamination. Ecotoxicology and Environmental Safety 214:112085. doi:10.1016/j.ecoenv.2021.112085.
- Carrier, M.-A., R. Lefebvre, J. Racicot, and E. B. Asare. 2008. Groundwater recharge assessment in Northern Ghana using soil moisture balance and chloride mass balance. GeoEmonton 08:1437–44.
- Crone, S. F., and N. Kourentzes. 2010. Feature selection for time series prediction - a combined filter and wrapper approach for neural networks. Neurocomputing 73 (10–12):1923–36. doi:10.1016/j.neucom.2010.01.017.
- Daliakopoulos, I. N., P. Coulibaly, and I. K. Tsanis. 2005. Groundwater level forecasting using artificial neural networks. Journal of Hydrology 309 (1–4):229–40. doi:10.1016/j.jhydrol.2004.12.001.
- Epoch Definition | DeepAI.”|“Epoch Definition | DeepAI. n.d. Accessed March 2, 2021. https://deepai.org/machine-learning-glossary-and-terms/epoch
- Fabio, D. N., S. I. Abba, B. Quoc Pham, A. R. M. Towfiqul Islam, S. Talukdar, and G. Francesco. 2022. Groundwater level forecasting in Northern Bangladesh using nonlinear autoregressive exogenous (NARX) and extreme learning machine (ELM) neural networks. Arabian Journal of Geosciences 15 (7):7. doi:10.1007/s12517-022-09906-6.
- Feng, Z. K., W. J. Niu, and S. Liu. 2021. Cooperation search algorithm : A novel metaheuristic evolutionary intelligence algorithm for numerical optimization and engineering optimization problems. Applied Soft Computing Journal 98:106734. doi:10.1016/j.asoc.2020.106734.
- Flore, M., S. Janicot, and G. N. Kiladis. 2008. The West African monsoon dynamics. Part III: The quasi-biweekly zonal dipole. Journal of Climate 21 (9):1911–28. doi:10.1175/2007JCLI1706.1.
- Forkuor, G., P. Pavelic, E. Asare, and E. Obuobie. 2013. Modélisation des zones potentielles déexploitation des eaux souterraines pour léagriculture Au Ghana septentrional En utilisant Le SIG/RS. Hydrological Sciences Journal 58 (2):437–51. doi:10.1080/02626667.2012.754101.
- Friesen, J., M. Andreini, W. Andah, B. Aminsigo, and N. Van De Giesen. 2005. Storage capacity and long-term water balance of the volta basin, West Africa. IAHS-AISH publication 296 138–145 .
- Funk, C. C., and M. E. Brown. 2009. Declining global per capita agricultural production and warming oceans threaten food security. Food Security 1 (3):271–89. doi:10.1007/s12571-009-0026-y.
- Gaffoor, Z., A. Gritzman, K. Pietersen, N. Jovanovic, A. Bagula, and T. Kanyerere. 2022. An Autoregressive machine learning approach to forecast high-resolution groundwater-level anomalies in the Ramotswa/North West/Gauteng dolomite aquifers of Southern Africa. Hydrogeology Journal 30 (2):575–600. doi:10.1007/s10040-021-02439-4.
- Gibson, K. 2020. The application of machine learning for groundwater level prediction in the steenkoppies compartment of the Gauteng and North West dolomite aquifer, South Africa (University of the Free State)http://hdl.handle.net/11660/11231 . :.
- GSS. 2010. Population and housing census: Summary report of final results. Ghana: Ghana Statistical Service Accra.
- Gumma, M. K., and P. Pavelic. 2013. Mapping of groundwater potential zones across Ghana using remote sensing, geographic information systems, and spatial modeling. Environmental Monitoring and Assessment 185 (4):3561–79. doi:10.1007/s10661-012-2810-y.
- Guzman, S. M., J. O. Paz, M. Love M Tagert, and A. Mercer. 2015. Artificial neural networks and support vector machines. Contrast Study for Groundwater Level Written for Presentation at the 2015 ASABE Annual International Meeting Sponsored by ASABE, New Orleans, Louisiana, 0–10.
- Gyau-Boakye, P. 2001. Environmental impacts of the akosombo dam and effects of climate change on the lake levels. Environment, Development and Sustainability 3 (1):17–29. doi:10.1023/A:1011402116047.
- Hadi, S. J., S. I. Abba, S. S. H. Sammen, S. Q. Salih, N. Al-Ansari, and Z. Mundher Yaseen. 2019. Non-linear input variable selection approach integrated with non-tuned data intelligence model for streamflow pattern simulation. IEEE Access 7:141533–48. doi:10.1109/ACCESS.2019.2943515.
- Hargreaves, G. H., and Z. A. Samani. 1985. Reference crop evapotranspiration from temperature. Applied Engineering in Agriculture 1 (2):96–99.
- Harter, T., and L. G. Walker. 2001. Assessing vulnerability of groundwater, vol. 3. California: University of California 978-1-879906-81-5 .
- Huang, X., L. Gao, R. S. Crosbie, N. Zhang, G. Fu, and R. Doble. 2019. Groundwater recharge prediction using linear regression, multi-layer perception network, and deep learning. Water (Switzerland) 11 (9):9. doi:10.3390/w11091879.
- Huang, G. B., Q. Yu Zhu, and C. Kheong Siew. 2006. Extreme learning machine: Theory and applications. Neurocomputing 70 (1–3):489–501. doi:10.1016/j.neucom.2005.12.126.
- Ibrahimi, A. E., and A. Baali. 2017. Application of neural modeling and the SPI index for the prediction of weather drought in the saïss plain (Northern Morocco). International Journal of Intelligent Engineering and Systems 10 (5):5. doi:10.22266/ijies2017.1031.01.
- Ibrahimi, A. E., A. Baali, A. Couscous, T. El Kamel, and N. Hamdani. 2017. Comparative study of the three models (ANN-PMC), (DWT-ANN-PMC) and (MLR) for prediction of the groundwater level of the surface water table in the saïss plain (North of Morocco). International Journal of Intelligent Engineering and Systems 10 (5):220–30. doi:10.22266/ijies2017.1031.24.
- Kabo-Bah, A. T., C. J. Diji, K. Nokoe, Y. Mulugetta, D. Obeng-Ofori, and K. Akpoti. 2016. Multiyear rainfall and temperature trends in the volta river basin and their potential impact on hydropower generation in Ghana. Climate 4 (4):49. doi:10.3390/cli4040049.
- Kadyampakeni, Davie M., Mul, Marloes L., Obuobie, Emmanuel, Appoh, Richard, Owusu, A., B. Ghansah, E. Boakye-Acheampong, and J. Barron. 2017. Agro-climatic and hydrological characterization of selected watersheds in Northern Ghana International Water Management Institute IWMI Working Paper 173 doi:10.5337/2017.209 .
- Kanyama, Y., R. Ajoodha, H. Seyler, N. Makondo, and H. Tutu. 2020. Application of machine learning techniques in forecasting groundwater levels in the grootfontein aquifer. 2nd International Multidisciplinary Information Technology and Engineering Conference, IMITEC. doi:10.1109/IMITEC50163.2020.9334142.
- Kardan, M., S. G. M. Hamid, Z. Kayhomayoon, Z. Rahimzadeh Kivi, and N. Arya Azar. 2021. The prediction of aquifer groundwater level based on spatial clustering approach using machine learning. Environmental Monitoring and Assessment 193 (4):1–20. doi:10.1007/s10661-021-08961-y.
- Kayhomayoon, Z., A. Azar Naser, S. Ghordoyee Milan, K. Moghaddam Hamid, and B. Ronny. 2021. Novel approach for predicting groundwater storage loss using machine learning. Journal of Environmental Management 296 (July):113237. doi:10.1016/j.jenvman.2021.113237.
- Kayhomayoon, Z., S. Ghordoyee Milan, N. Arya Azar, and H. Kardan Moghaddam. 2021. A new approach for regional groundwater level simulation: Clustering, simulation, and optimization. Natural Resources Research 30 (6):4165–85. doi:10.1007/s11053-021-09913-6.
- Kochhar, A., H. Singh, S. Sashikant, P. K. Litoria, and B. Pateriya. 2021. Prediction and forecast of pre-monsoon and post-monsoon groundwater level: Using deep learning and statistical modelling. Modeling Earth Systems and Environment 8 (2):0123456789. doi:10.1007/s40808-021-01235-z.
- Konikow, L. F., and E. Kendy. 2005. Groundwater depletion: A global problem. Hydrogeology Journal 13 (1):317–20. doi:10.1007/s10040-004-0411-8.
- Kortatsi, B. K. 1994. Groundwater utilization in Ghana IAHS Publications-Series of Proceedings and Reports-Intern Assoc Hydrological Sciences . 222:149–56.
- Kourentzes, N. 2019. Tsutils: Time series exploration, modelling and forecasting. R Package 20 03 2022 https://kourentzes.com/forecasting/tag/time-series-exploration/ Version 0.9. 0.
- Kourentzes, N., D. K. Barrow, and S. F. Crone. 2014. Neural network ensemble operators for time series forecasting. Expert Systems with Applications 41 (9):4235–44. doi:10.1016/j.eswa.2013.12.011.
- Kumar, C. P. 2011. Groundwater data requirement and analysis. Angelfire Com 247667:27. https://www.academia.edu/384575/Groundwater_Data_Requirement_and_Analysis.
- Kumar, C. P., and P. V. Seethapathi. 2002. Assessment of natural ground water recharge in upper ganga canal command area. Journal of Applied Hydrology, Association of Hydrologists of India XV (4):13–20. http://www.angelfire.com/nh/cpkumar/publication/ugcm.pdf.
- Lallahem, S., J. Mania, A. Hani, and Y. Najjar. 2005. On the use of neural networks to evaluate groundwater levels in fractured media. Journal of Hydrology 307 (1–4):92–111. doi:10.1016/j.jhydrol.2004.10.005.
- Lloyd, J. W. 1999 (Paris: Unesco Pub.) 284 p 92310351189231035118 https://digitallibrary.un.org/record/1489036 . .
- Lopez‐gunn, E., and M. Ramón Llamas. 2008. In Natural resources forum, vol. 32, 228–38 https://onlinelibrary.wiley.com/doi/10.1111/j.1477-8947.2008.00200.x doi:10.1111/j.1477-8947.2008.00200.x . : .
- Lutz, A., S. Minyila, B. Saga, and S. Diarra. 2015. Fluctuation of groundwater levels and recharge patterns in Northern Ghana. Climate 3 (1):1–15. doi:10.3390/cli3010001.
- MacCartney, M., and V. Smakhtin. 2010. Water storage in an era of climate change: Addressing the challenge of increasing rainfall variability. 14. doi:10.22004/ag.econ.212430.
- MacDonald, A. M., H. C. Bonsor, B. É. Ó. Dochartaigh, and R. G. Taylor. 2012. Quantitative maps of groundwater resources in Africa. Environmental Research Letters 7 (2):2. doi:10.1088/1748-9326/7/2/024009.
- Maier, H. R., and G. C. Dandy. 1996. Of water quality parameters dendrites. Water Resources Research 32 (4):1013–22.
- Mark, S., Y. Evans, K. Vakpo, P. Asamoah, S. Larry, P. Chegbeleh, and T. M. Akabzaa. 2019. Groundwater – lakewater interactions : An evaluation of the impacts of climate change and increased abstractions on groundwater contribution to the volta lake, Ghana. Environmental Earth Sciences 0 (0):0. doi:10.1007/s12665-019-8076-8.
- Martin, N. 2006. Development of a water balance for the atankwidi catchment, West Africa-A case study of groundwater recharge in a semi-arid climate. Nonnenstieg: Cuvillier Verlag 184 3865378854 .
- Masson-Delmotte, V., P. Zhai, H. O. Portner, D. Roberts, J. Skea, P. Shukla, A. Pirani, W. Moufouma-Okia, C. Pean, and R. Pidcock. 2018. Global warming of 1.5 OC: An IPCC special report on the impacts of global warming of 1.5 degrees C above pre-industrial levels and related global greenhouse gas emission pathways Masson-Delmotte, V., Zhai, P., Pörtner , H. O., Roberts, D., Skea, J., Shukla, P. R., Pirani, A., Moufouma-Okia, W., Péan, C., Pidcock, R., Connors, S., Matthews, J. B. R., Chen, Y., Zhou, X., Gomis, M. I., Lonnoy, E., Maycock, T., Tignor, M., Waterfield, T. In The context of strengthening the global response to the threat of climat. Sustainable development, and efforts to eradicate poverty, Cambridge: Cambridge University Press pp. 93–174 doi:https://doi.org/10.1017/9781009157940.004 .
- Milan, S. G., A. Roozbahani, and M. Ebrahim Banihabib. 2018. Fuzzy optimization model and fuzzy inference system for conjunctive use of surface and groundwater resources. Journal of Hydrology 566:421–34. doi:10.1016/j.jhydrol.2018.08.078.
- Mirarabi, A., H. R. Nassery, M. Nakhaei, J. Adamowski, A. H. Akbarzadeh, and F. Alijani. 2019. Evaluation of data-driven models (SVR and ANN) for groundwater-level prediction in confined and unconfined systems. Environmental Earth Sciences 78 (15):15. doi:10.1007/s12665-019-8474-y.
- Moghaddam, H. K., H. Kardan Moghaddam, Z. Rahimzadeh Kivi, M. Bahreinimotlagh, and M. Javad Alizadeh. 2019. Developing comparative mathematic models, BN and ANN for forecasting of groundwater levels. Groundwater for Sustainable Development 9 (May):100237. doi:10.1016/j.gsd.2019.100237.
- Mohanty, S., M. K. Jha, A. Kumar, and K. P. Sudheer. 2010. Artificial neural network modeling for groundwater level forecasting in a river Island of Eastern India. Water Resources Management 24 (9):1845–65. doi:10.1007/s11269-009-9527-x.
- Moseki, 2017. Climate change impacts on groundwater : Literature review Environmental Risk Assessment and Remediation . 2(1 16–20 doi:10.4066/2529-8046.100033).
- Mozaffari, S., S. Javadi, H. Kardan Moghaddam, and T. O. Randhir. 2022. Forecasting groundwater levels using a hybrid of support vector regression and particle swarm optimization. Water Resources Management 36 (6):1955–72. doi:10.1007/s11269-022-03118-z.
- Nash, J. E., and J. V. Sutcliffe. 1970. Ireland’s water budget - model validation and a greenhouse experiment. Journal of Hydrology 34 (2):124–34. doi:10.1080/00750770109555783.
- Nguyen, P. T., D. Hai Ha, M. Avand, A. Jaafari, H. Duy Nguyen, N. Al-Ansari, T. Van Phong, R. Sharma, R. Kumar, H. V. Le, et al. 2020. Soft computing ensemble models based on logistic regression for groundwater potential mapping. Applied Sciences (Switzerland) 10 (7):7. doi:10.3390/app10072469.
- Niu, W. J., and Z. K. Feng. 2021. Evaluating the performances of several artificial intelligence methods in forecasting daily streamflow time series for sustainable water resources management. Sustainable Cities and Society 64 (October 2020):102562. doi:10.1016/j.scs.2020.102562.
- Nonterah, C., Y. Xu, and S. Osae. 2019. Groundwater occurrence in the sakumo wetland catchment, Ghana : Model – setting – scenario approach. Hydrogeology Journal 27 (3):983–96. doi:10.1007/s10040-019-01959-4.
- Nunno, F. D., and F. Granata. 2020. Groundwater level prediction in apulia region (Southern Italy) using NARX neural network. Environmental Research 190 (April):110062. doi:10.1016/j.envres.2020.110062.
- Nyagwambo, N. L. 2006. Groundwater Recharge Estimation And Water Resources Assessment In A Tropical Crystalline Basement Aquifer (Leiden, Balkema)http://resolver.tudelft.nl/uuid:626367cd-b816-4bf1-b6e7-288e2391787a .
- Obuobie, E. 2008a. Estimation of groundwater recharge in the context of future climate change in the white volta river basin, West Africa. https://nbn-resolving.org/urn:nbn:de:hbz:5N-16169
- Obuobie, E. 2008b. Estimation of groundwater recharge in the context of future climate change in the white volta river basin, West Africa. Ecology and Development Series 62:168.
- O’Driscoll, M., S. Clinton, A. Jefferson, A. Manda, and S. McMillan. 2010. Urbanization effects on watershed hydrology and in-stream processes in the Southern United States. Water (Switzerland) 2 (3):605–48. doi:10.3390/w2030605.
- Oke, M., O. Martins, O. Idowu, and O. Aiyelokun. 2013. Comparative analysis of empirical formulae used in groundwater recharge in ogun – oshun river basins. Journal of Scientific Research and Reports 2 (2):692–710. doi:10.9734/jsrr/2013/4557.
- Osei, M. A., L. Ko, D. Dotse Wemegah, K. Preko, E. Serwaa Gyawu, and K. Obiri-Danso. 2019. Journal of hydrology : Regional studies the impact of climate and land-use changes on the hydrological processes of owabi catchment from SWAT analysis. Journal of Hydrology: Regional Studies 25 (December 2018):100620. doi:10.1016/j.ejrh.2019.100620.
- Pandey, K., S. Kumar, A. Malik, and A. Kuriqi. 2020. Artificial neural network optimized with a genetic algorithm for seasonal groundwater table depth prediction in Uttar Pradesh, India. Sustainability (Switzerland) 12 (21):1–24. doi:10.3390/su12218932.
- Pham, B. T., A. Jaafari, I. Prakash, S. K. Singh, N. K. Kim Quoc, and D. T. Tien Bui. 2019. Hybrid computational intelligence models for groundwater potential mapping. Catena 182 (May):104101. doi:10.1016/j.catena.2019.104101.
- Pham, Q. B., M. Kumar, F. Di Nunno, A. Elbeltagi, F. Granata, A. Reza Md Towfiqul Islam, S. T. X. Cuong Nguyen, A. Najah Ahmed, and D. Tran Anh. 2022. Groundwater level prediction using machine learning algorithms in a drought-prone area. Neural Computing & Applications 34 (13):10751–73. doi:10.1007/s00521-022-07009-7.
- Qu, J., J. Zhou, and N. Chen. 2010. Groundwater table prediction based on improved PSO algorithm and RBF neural network. Proceedings - International Conference on Artificial Intelligence and Computational Intelligence, AICI 2010, 1: 228–32. doi:10.1109/AICI.2010.55.
- Rodríguez-Huerta, E., M. Rosas-Casals, and L. M. Margarita Hernández-Terrones. 2020. A water balance model to estimate climate change impact on groundwater recharge in Yucatan peninsula, Mexico. Hydrological Sciences Journal 65 (3):470–86. doi:10.1080/02626667.2019.1702989.
- Saghravani, S. R., I. Yusoff, S. Mustaustapha, and S. Fazlollah Saghravani. 2013. Estimating groundwater recharge using empirical method: A case study in the tropical zone. Sains Malaysiana 42 (5):553–60.
- Sahoo, G. B., C. Ray, and H. F. Wade. 2005. Pesticide prediction in ground water in North Carolina domestic wells using artificial neural networks. Ecological Modelling 183 (1):29–46. doi:10.1016/j.ecolmodel.2004.07.021.
- Scanlon, B. R., R. W. Healy, and P. G. Cook. 2002. Choosing appropriate techniques for quantifying groundwater recharge. Hydrogeology Journal 10 (1):18–39. doi:10.1007/s10040-001-0176-2.
- Schneider, K., U. Leopold, F. Gerschlauer, F. Barthold, M. Giese, M. Steffens, C. Hoffmann, H. G. Georg Frede, and L. Breuer. 2011. Spatial and temporal variation of soil moisture in dependence of multiple environmental parameters in semi-arid grasslands. Plant and Soil 340 (1–2):73–88. doi:10.1007/s11104-010-0692-8.
- Şen, Z. 2015. Applied drought modeling, prediction, and mitigation. Jeddah, Kingdom of Saudi Arabia: Elsevier Inc. doi:10.1016/C2014-0-01944-2.
- Sena, Y., A. Loh, B. Awinbire Akurugu, E. Manu, and A. Abdul-Samed. 2019. Assessment of groundwater quality and the main controls on its hydrochemistry in some voltaian and basement aquifers, Northern Ghana. Groundwater for Sustainable Development 10:100296. doi:10.1016/j.gsd.2019.100296.
- Seneviratne, S. I., N. Nicholls, D. Easterling, C. M. Goodess, S. Kanae, J. Kossin, Y. Luo, Marengo J, McInnes K, Rahimi M, Reichstein, M., Sorteberg, A., Vera, C., Zhang, X., et al. 2012. Changes in climate extremes and their impacts on the natural physical environment. Managing the Risks of Extreme Events and Disasters to Advance Climate Change Adaptation: Special Report of the Intergovernmental Panel on Climate Change 9781107025:109–230. doi:10.1017/CBO9781139177245.006.
- Sethi, R. R., A. Kumar, S. P. Sharma, and H. C. Verma. 2010. Prediction of water table depth in a hard rock basin by using artificial neural network. International Journal of Water Resources and Environmental Engineering 4 (2):95–102. doi:10.5897/IJWREE.9000045.
- Shah, T., M. Giordano, and A. Mukherji. 2012. Political economy of the energy-groundwater nexus in India: Exploring issues and assessing policy options. Hydrogeology Journal 20 (5):995–1006. doi:10.1007/s10040-011-0816-0.
- Sheng, Z. 2005. An aquifer storage and recovery system with reclaimed wastewater to preserve native groundwater resources in El Paso, Texas. Journal of Environmental Management 75 (4):367–77. doi:10.1016/j.jenvman.2004.10.007.
- Shrestha, S., N. A. T. Hoang, P. Kumar Shrestha, and B. Bhatta. 2018. Climate change impact on groundwater recharge and suggested adaptation strategies for selected Asian Cities. APN Science Bulletin 8 (1). doi:10.30852/sb.2018.499.
- Siabi, E. K., A. T. Kabobah, K. Akpoti, G. K. Anornu, M. Amo-Boateng, and E. K. Nyantakyi. 2021. Statistical downscaling of global circulation models to assess future climate changes in the black volta basin of Ghana. Environmental Challenges 5 (September):100299. doi:10.1016/j.envc.2021.100299.
- Siebert, S., J. Burke, J. M. Faures, K. Frenken, J. Hoogeveen, P. Döll, and F. T. Portmann. 2010. Groundwater use for irrigation - a global inventory. Hydrology and Earth System Sciences 14 (10):1863–80. doi:10.5194/hess-14-1863-2010.
- Sood, A., L. Muthuwatta, and M. McCartney. 2013. A SWAT evaluation of the effect of climate change on the hydrology of the volta river basin. Water International 38 (3):297–311. doi:10.1080/02508060.2013.792404.
- Sun, Y., D. Wendi, D. Eon Kim, and S. Yui Liong. 2016. Technical note: Application of artificial neural networks in groundwater table forecasting-a case study in a Singapore swamp forest. Hydrology and Earth System Sciences 20 (4):1405–12. doi:10.5194/hess-20-1405-2016.
- Taormina, R., K. Wing Chau, and R. Sethi. 2012. Artificial neural network simulation of hourly groundwater levels in a coastal aquifer system of the Venice lagoon. Engineering Applications of Artificial Intelligence 25 (8):1670–76. doi:10.1016/j.engappai.2012.02.009.
- Taraz, V. 2017. Adaptation to climate change: Historical evidence from the Indian monsoon. Environment and Development Economics 22 (5):517–45. doi:10.1017/S1355770X17000195.
- Toews, M. W. 2007. File: Surface water cycle.svg - Wikimedia commons. https://commons.wikimedia.org/wiki/File:Surface_water_cycle.svg
- Tsanis, I. K., and M. G. Apostolaki. 2009. Estimating groundwater withdrawal in poorly gauged agricultural basins. Water Resources Management 23 (6):1097–123. doi:10.1007/s11269-008-9317-x.
- UNEP (United Nations Environment Programme). 2010. Division of early warning, assessment, African ministers’ council on water, African union. Commission, United States. Department of State, & European Union 1 1–100 . UNEP/Earthprint.
- Wang, W., J. Jin, and Y. Li. 2009. Prediction of inflow at three gorges dam in yangtze river with wavelet network model. Water Resources Management 23 (13):2791–803. doi:10.1007/s11269-009-9409-2.
- Willmott, C. J. 1981. On the validation of models. Physical Geography 2 (2):184–94. doi:10.1080/02723646.1981.10642213.
- Yaseen, Z. M., S. Oleiwi Sulaiman, R. C. Deo, and K. Wing Chau. 2019. An enhanced extreme learning machine model for river flow forecasting: State-of-the-art, practical applications in water resource engineering area and future research direction. Journal of Hydrology 569:387–408. doi:10.1016/j.jhydrol.2018.11.069.
- Yeboah, K. A., K. Akpoti, A. T. Kabo-Bah, E. A. Ofosu, E. K. Siabi, E. M. Mortey, and S. A. Okyereh. 2022. Assessing climate change projections in the volta basin using the CORDEX-Africa climate simulations and statistical bias-correction. Environmental Challenges 6 (August 2021):100439. doi:10.1016/j.envc.2021.100439.
- Zhang, Y. 2019. Estimation of potential evapotranspiration by different methods in Handan Eastern Plain, China. 4 (4):117–23. doi:10.11648/j.ajwse.20180404.15.