
 ?Mathematical formulae have been encoded as MathML and are displayed in this HTML version using MathJax in order to improve their display. Uncheck the box to turn MathJax off. This feature requires Javascript. Click on a formula to zoom.
ABSTRACT
Student dropout in secondary schools is a major issue in developing countries, particularly in Sub-Saharan Africa. Sub-Saharan African countries had the highest dropout rate (37.5%), followed by South Asia (15.5%), the Middle East (11%), East Asia (9.5%), Latin America (7%), and Central Asia (3.5%). Various initiatives such as the big results now initiatives, no child left behind, and secondary education development programme as well as machine learning prediction models have been used to reduce the severity of the problem in Sub-Saharan countries. The ongoing dropout problem, particularly in secondary schools is ascribed to improper root cause identification and the absence of formal procedures that can be used to estimate the severity of the issue. This study has compared the AutoML model, ensemble learning approach, and KNORA-AutoML to predict student dropout problems. The KNORA-AutoML model scored 97% of accuracy, precision = 71%, and AUC = 87% when compared to the conventional ensemble of optimized ML models with accuracy = 96%, precision = 70%, and AUC = 78%. KNORA-AutoML model performance increased by 0.6% accuracy, 0.8% precision, and 8.7% AUC. An optimized model draws a lot of attention to the findings related to student dropout rates in developing countries.
Introduction
Student dropout in Sub Saharan continues to be a challenging problem. Sub-Saharan countries have 37.5% dropout rates in secondary schools followed by South Asia 15.5% and Middle East 11% in 2018 (Statista Citation2022). In Tanzania, student dropouts in secondary schools increased from 3.8% in 2018 to 4.2% in 2019 (PO-RALG Citation2019, Citation2020). Student dropout has been addressed by different interventions to reduce the negative impact in secondary schools. Several measures have been proposed and implemented by education stakeholders to reduce student dropout (UNESCO-Tanzania Citation2015). Faruk (Citation2015) proposed the teachers’ training, seminars, and workshops as a measure for students not to drop out of school. Similarly, Bibi (Citation2018) evidenced that parents-teachers meetings contribute 93.5%, and parent workshops 82.3% to control student dropout rate. Likewise, authority in the United Republic of Tanzania (URT) established the Secondary Education Development Programme (SEDP) in 2005 that aimed to introduce at least one secondary school in every administrative ward so as to increase the number of secondary schools and reduce the distance from their homes as a measure to solve school dropout (URT Citation2008). Later on, the United Republic of Tanzania adopted the Big Results Now Initiative (World Bank Citation2014) to fast-track quality improvement of the education in secondary schools and address student dropout. Furthermore, the government’s fee-free basic education policy contributed to a significant decrease in student dropout in 2016 (UNICEF-Tanzania Citation2018).
The studies by Mduma, Kalegele, and Machuve (Citation2019), Lee and Chung (Citation2019), Chareonrat (Citation2016), Aguiar (Citation2015), and Sara et al. (Citation2015) have focused on establishing machine learning (ML) prediction models as measures to fight against student dropout in secondary schools, but the dropout problem still persists. The persisting dropout problem, especially in secondary schools, is attributed to a lack of proper identification of root causes and the unavailability of formal methods that can be used to project the severity of the problem. The difficulty stems from the fact that traditional machine learning algorithms suffer from feature processing and algorithm selection (Feurer et al. Citation2015). Moreover, no single machine learning algorithm/classifier or ensemble of classifiers can perfectly adapt to every test set (Azizi and Farah Citation2012). This is a significant drawback of most existing machine learning algorithms and ensemble learning techniques, as it compromises proper feature processing as well as the prediction accuracy of the machine learning models. However, automated machine learning (AutoML) methods provide better prediction results in different classification tasks. On the other hand, AutoML faces the challenge of selecting one of the optimal prediction models generated by the optimization methods for the various subsets of samples in the dataset (Tsiakmaki et al. Citation2020; Waring, Lindvall, and Umeton Citation2020). The challenge of selecting optimal prediction models among the pool of predictive methods is addressed by static and dynamic ensemble selection schemes (Ko, Sabourin, and Britto Citation2008). The static ensemble selection technique selects the optimal performing classifiers subsets for the whole test set (Azizi and Farah Citation2012). The method determines an ensemble of classifiers (EoC) for all test samples, not every selected classifier in the AutoML pool is an expert in classifying all known training samples (Ko, Sabourin, and Britto Citation2008). Dynamic ensemble techniques work by estimating the competence level of each classifier from a pool of classifiers (Vriesmann et al. Citation2012). The estimated competence of the ensemble of classifiers is based on a local region of the feature space where the query sample is located (Zhu, Wu, and Yang Citation2004). The local region can defined by different methods such as overall local accuracy, local class accuracy, A priori, A posteriori, and K-Nearest Oracle (KNORA) (Ko, Sabourin, and Britto Citation2008).
Furthermore, KNORA is used to combine the optimized machine learning models using the AutoML approach. KNORA-AutoML model scored 97% of accuracy, precision = 71%, recall = 76%, F1 = 74%, and AUC = 87% when compared to the conventional ensemble of optimized ML models with accuracy = 96%, precision = 70%, recall = 58%, F1 = 64%, and AUC = 78%. KNORA-AutoML model performance increased by 0.6% accuracy, 0.8% precision, 17.8% recall, 9.9% F1 and 8.7% AUC. The rest of the paper is organized as follows; Section 2 presents literature reviews in ensemble learning methods, Bayesian optimization technique, and automated machine learning approach. Section 3 presents the methodology, Section 4 presents results and discussions. Finally, Section 5 presents the conclusion and future scope.
Literature Review
This study has examined traditional machine learning algorithms, ensemble learning methods, and automated machine learning methods. Researchers reviewed Random Forest (RF), Decision Tree (DT), K-Nearest Neighbors (KNN), AdaBoost, Multilayer Perceptron (MLP), Logistic Regression (LR), Stochastic Gradient (SGD), Linear Discriminant Analysis (LDA), artificial neural network (ANN), support vector machine (SVM) and Nave Bayes (NB). It is difficult to determine which technique is superior to another because each has its own set of merits and demerits, and implementation issues (Soofi and Awan Citation2017). DT selects features in a top-down approach beginning with the attribute that offers the highest degree of information gain with the lower entropy (Berens et al. Citation2018). The lower value of entropy gives higher information purity of the node (Azad et al. Citation2021). LR is a statistical method that makes categorization according to the rules of probability by estimating the value assumptions of dependent variables as the probability (Korkmaz, Güney, and Yiğîter Citation2012). The probabilities describing the possible outcomes of each feature vector are modeled using the logistic function (Rovira, Puertas, and Igual Citation2017). NB uses Bayes Rule together with the assumption that the attributes are conditionally independent for the given class (Webb Citation2011). Random forest can be defined as where the {
} are independent identically distributed random vectors, and each tree casts a unit vote for the most popular class at input x. Significant improvements in classification accuracy have resulted from growing an ensemble of trees and letting them vote for the most popular class (Breiman Citation2001). ANNs involve nonlinear relationships among different datasets that are difficult to identify using conventional analyses (Kriesel Citation2007). Neural networks can learn non-linear and complex relationships and do not restrict input variables that represent dropout determinants (Kalegele Citation2020).
Ensemble Learning Approach
Ensemble learning brings the practice of multiple learner classifiers on a dataset to extract the number of predictions, which are combined into one composite prediction (Steinki and Mohammad Citation2015). Ensemble different machine learning algorithms is an effective method for acquiring a high level of predictive accuracy (Shanthini, Vinodhini, and Chandrasekaran Citation2018). Predictions made through ensembles are usually more accurate than predictions made by a single model (Shanthini, Vinodhini, and Chandrasekaran Citation2018). Ensemble learning improves classification accuracy by static and dynamic ensemble techniques (Mousavi and Eftekhari Citation2015). The static ensemble selection approach searches a pool of candidate classifiers for the best ensemble classifier structure based on a specific criterion (Karlos, Kostopoulos, and Kotsiantis Citation2020). The dynamic ensemble selection automatically selects a competent subset of ensemble classifiers when making predictions for different test sets of training samples (Cruz et al. Citation2020). The competence of an ensemble of classifiers can be achieved by various methods such as overall local accuracy, local class accuracy, A priori, A posteriori, and K-Nearest Oracle (KNORA) (Ko, Sabourin, and Britto Citation2008). KNORA selects all classifiers that correctly classify all subsets of samples in the region of competence (Oliveira et al. Citation2018). KNORA simply finds its nearest k-neighbors in the validation set for any test sample to determine optimal classifiers (Ko, Sabourin, and Britto Citation2008). KNORA – Eliminate and KNORA – Union DES techniques estimate the classifier competence over a test sample of competence region using a given criterion (Oliveira et al. Citation2018). KNORA – Eliminate selects all classifiers that correctly classify all samples in the test sample’s region of competence only if such a classifier exists. Otherwise, it removes the sample that is farthest away from the test sample from the region of competence. As a result, KNORA – Eliminate can lead to the selection of incompetent optimized machine learning models by reducing the region of competence (Janardhan and Kumaresh Citation2022). The study adapts the KNORA-Union method proposed by Ko, Sabourin, and Britto (Citation2008) to compose the ensemble of optimized machine learning models using the AutoML approach presented in . KNORA – Union selects all classifiers/optimized ML models that correctly classify at least one sample in the competence region. The more neighbors a classifier correctly classifies, the more votes it receives for a test sample (Junior et al. Citation2020).
Hutagaol (Citation2019) results revealed the performance of ML algorithms individually; KNN = 98.20%, NB = 98.24%, and DT = 97.91% and later combined them to build an ensemble classifier which showed a performance of 98.82% that was greater than the individual classifiers. Adejo and Connolly (Citation2018) used three algorithms such as DT, ANN, and SVM to build an ensemble classifier with an accuracy of 81.67%. Satyanarayana and Nuckowski (Citation2016) applied DT (J48), NB and RF to build an ensemble classifier with an accuracy of 95% which was higher compared to individual classifiers. Ayyappan and Sivakumar (Citation2018) used Bayes, Rules and Trees-based classifiers to build ensemble models by using boosting, bagging, and dagging methods. Results for Bayesian based classifiers when boosting method applied are as follows; BayesNet 72.18%, complement NaiveBayes 52.96%, and Naïve Bayes 69.98%. Results for Rules based classifiers were as follows; Conjunctive Rule 51.38%, Decision Table 71.68%, and JRip 70.66%. On the other hand, Trees based classifiers performed as follows; BTTree = 72.03%, Decision Stump = 51.38%, and J48 = 71.73%. Their study used a residence, medium of study, sex, attendance, subjects taught and student grade to determine the student performance and dropout. Unfortunately, the study did not show the impact of each factor on the dropout prediction models. Moreover, some of these factors are not relevant to developing countries.
Satyanarayana and Nuckowski (Citation2016) applied DT (J48), NB and RF to build an ensemble classifier. The ensemble of DT (J48) and Bagging was modeled by mathematics and Portuguese grades. The individual results of DT (J48) = 78%, Bagging = 82%, and ensemble model = 95% for the mathematics grades. Similarly, for the Portuguese grade, DT (J48) = 71%, Bagging = 79%, and ensemble model = 94%. The obtained results indicate the power of the ensemble learning techniques compared to individual machine learning algorithms. As a result, prediction accuracy improved significantly with the ensemble model. Moreover, their results showed that extra educational support, daily alcohol consumption, large family size, and internet access at home highly correlated with student dropout.
Automated Machine Learning (AutoML)
Automated Machine Learning (AutoML) is a technique to drive the best classification model and corresponding hyper-parameter for a given decision-making problem (Feurer et al. Citation2015). The AutoML selects the best combination of hyper-parameters and features for the optimal prediction model (Kotthof et al. Citation2017). The process of building such actionable machine learning models can generate added value to the existing problem (Tuggener et al. Citation2019). Several studies have predicted student performance and dropout rate in higher education using traditional machine learning models, and a few studies have used AutoML models (Zeineddine, Braendle, and Farah Citation2021). The KNORA-AutoML method for improving prediction models for student dropout is not yet covered in secondary schools in developing countries. Prabaharan, Mehta, and Chauhan (Citation2020) and Waring, Lindvall, and Umeton (Citation2020) evidenced the significance of using the AutoML method in healthcare, demonstrating the influential features and the best combination of the classification methods to improve health outcomes. Krauß et al. (Citation2020) applied the AutoML model using hyper-parameter optimization techniques in quality production. Their preliminary results showed F1 scores of 37% for the un-tuned model and 42% for the tuned model using Random forest. Automatic generation of influential features and machine learning algorithms lead to the optimal prediction model implemented by hyper-parameter optimization techniques (Feurer et al. Citation2015).
Mnyawami, Maziku, and Mushi (Citation2022) developed an improved model to predict student dropout in developing countries, particularly in Tanzania. The model was developed using AutoML to improve prediction results for secondary schools in Sub-Saharan countries. The results indicate that Grid search, Randomized and Bayesian optimization techniques perform better than conventional machine learning models. The average accuracy of the AutoML model using grid search method were DT = 99.9%, RF = 99.9%, LR = 98%, NB = 97%, and SGD = 95%. Results of the Randomized search method is DT = 97%, RF = 97%, LR = 97%, NB = 97%, and SGD = 96%. Again, their study demonstrated students’ performance/marks, age, school distance, mother’s education, number of children in the family, parents’ occupation, father’s education, gender, mother’s tongue language and means of transport used to school have a high impact on student dropouts.
Mduma, Kalegele, and Machuve (Citation2019) improved prediction accuracy after applying grid search parameter tuning to conventional machine learning algorithms. Their results showed LR = 89.7%, MLP = 86.5%, NB = 78.4%, and RF = 88.8% for tuned model, and traditional ML algorithms; LR = 75%, MLP = 76%, RF = 75%, and KNN = 73%, and LR = 78%, MLP = 64%, RF = 50%, and KNN = 55% for under-sampling technique and over-sampling technique, respectively. The AutoML has a significant contribution in improving the prediction results in machine learning and ensemble learning approaches. Moreover, the authors revealed that the main source of household income, boy’s pupil latrines ratio, presence/absence of girls’ privacy room, student gender, a parent who checks his/her child’s exercise book once a week etc., as the factors that lead student to dropout from school. Their research employed the SMOTE technique to address the under-fitting and overfitting issues in machine learning classification and prediction.
Bayesian Hyper-Parameter Optimization
The hyperparameter optimization can be achieved by grid search, random search, and Bayesian optimization (Yang and Shami Citation2020). Grid search suffers from the high dimensional data and is computationally expensive (Bergstra and Bengio Citation2012). Randomized search solves large-scale problems efficiently in a way that is impossible for grid search (Zabinsky Citation2011). On the other hand, random search does not employ a search technique to forecast the subsequent trial and does not use data from trials to choose the next set (Tsiakmaki et al. Citation2020). Therefore, this study selected the Bayesian optimization method due to its superiority over random and grid search (Turner et al. Citation2021). When performing Bayesian optimization, prior information is established for the optimization function, which is gathered from the previous dataset to update the posterior of the optimization function using Bayesian theorem (Wu et al. Citation2019).
The theorem states that the posterior probability of a model M given data D P(M|D) is proportional to the likelihood of D given M P(D|M) multiplied by the prior probability P(M). As for the hyperparameter optimization problem, model M should not be mistaken for the output model of machine learning algorithms (Tsiakmaki et al. Citation2020). The function generates the ideal value deduced from the posterior knowledge. For minimizing or maximizing objective functions that are expensive to analyze for machine learning models, a Bayesian optimization is a useful approach (Wu et al. Citation2019). Due to its controllability for posterior and predictive distributions, Bayesian optimization adapts the Gaussian process method to choose prior information (Rasmussen Citation2004). The Gaussian process has desirable properties such as uncertainty estimates over function values, resistance to overfitting, and principled approaches to hyperparameter optimization (Gal Citation2015). The Gaussian process is efficient and is applied when very little information about the objective function is available, making helpful in optimizing costly black-box functions (Brochu Citation2010). The Gaussian process is specified by its mean function m and covariance function k
. Therefore, Gaussian process is defined in EquationEquations (1)
(1)
(1) and (Equation2
(2)
(2) ).
Given observation, D = (X, f)
where function f is distributed as a with mean function m and covariance function k
Due to the limitations of the previous research on conventional machine learning, ensemble learning methods, and automated machine learning approaches, the study employs the KNORA-AutoML prediction model to address the challenges of conventional ensemble learning models and AutoML approaches to compose the dynamic ensemble of optimized machine learning model.
Methodology
Dataset Processing Methods
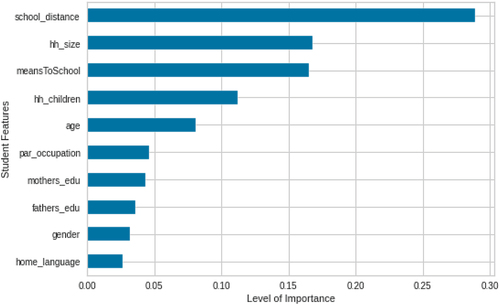
The dataset was obtained from the Twaweza Uwezo data repository. Students who dropped out of school in Tanzania, Uganda, and Kenya were included in these datasets.Footnote1 The datasets were in Stata(.dta) file format, Jupyter Notebook was used to read and merge files, and then converted to CSV file format. Datasets contained 385,634 records with 37 features before Scikit-learn data analysis and classification. The remained dataset was 206,885 samples and 15 features after removing inconsistent rows and features. The univariate feature processing method imputed values in the i-th feature dimension using only non-missing values in that feature dimension (Emmanuel et al. Citation2021). The missing values were handled by imputation technique using the mean of each column in which the missing values were found (Rezaie et al. Citation2010). The mean imputation method is the simplest and most widely used method in generic imputation practice to replace missing data, and it has good robustness (Fu, Liao, and Lv Citation2021). Then, 36723 records with outliers were removed by inter-quartile range (IQR) (Whaley Citation2005). The study adapts features presented by Mnyawami, Maziku, and Mushi (Citation2022) in . Therefore, the study adopted DT and Chi Squared method to select the important features used in classification and prediction (Mengash et al. Citation2022). The chi squared method selects the minimum number of features needed to represent the data accurately (Liu and Setiono Citation1995). shows that each feature has an impact on student dropout prediction, such as school distance (28%), household size (17%), means to school (16%), household children (12%), age (7.5%), parents’ occupation (4.5%), mother’s education (4%), father’s education (3.5%), gender (3%), and mother tongue language (2.5%). A higher feature score indicates a significant contribution to predicting student dropouts.
Figure 1. Feature importance selection.
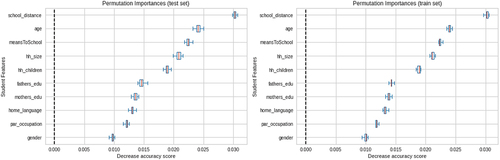
Moreover, presents the permutation method for selecting important features. Important features are selected from the training and testing set of the acquired dataset (Ganz and Konukoglu Citation2017). If the decrease in accuracy scores in training and testing sets are very similar, the model accurately demonstrates important features for prediction; otherwise, the model is overfitting (Ojala and Garriga Citation2010). Therefore, the selected features are appropriate for predicting student dropouts in secondary schools in developing countries.
Figure 2. Permutation feature importance for training and testing set.
AutoML Model Setup
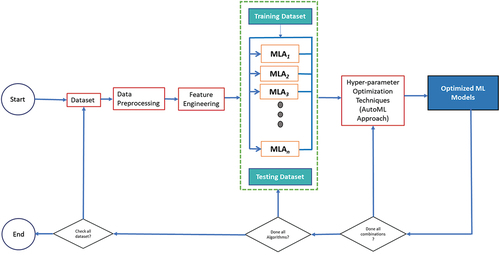
shows the reuse of the prediction model presented by (Mnyawami, Maziku, and Mushi Citation2022). The input dataset is passed to the data preprocessing. Feature engineering technique is selected and applied to the dataset. The list of models is then passed, and the method is run for all of them. The hyper-parameter optimization technique is then chosen, and the optimal hyper-parameters and models are returned. Finally, the models are trained, and the model evaluation metrics are used to determine the best classification models described in pseudocode 1. Again, the static ensemble and KNORA dynamic ensemble selection strategies are used to combine optimized machine learning models to produce a single optimized prediction model, as presented in . The study divided 70% of the training data and 30% of the testing data from 206,885 samples for various experiments. The best results are obtained when 20–30% of the data is used for testing and 70–80% for training (Gholamy, Kreinovich, and Kosheleva Citation2018). The training/testing ratio of 70/30 was the best for training and validating ML models (Saroj et al. Citation2022). Testing set is used to assess the accuracy of the resulting model (Gholamy, Kreinovich, and Kosheleva Citation2018). The 70/30 training/testing ratio aids in avoiding model overfitting and underestimating the obtained prediction accuracy of the model (Nguyen et al. Citation2021).
Figure 3. Automated machine learning prediction model.
Pseudocode 1: Automated Machine Learning Model
Implementation of KNORA-AutoML
This section shows the implementation of a conventional ensemble learning model, a static ensemble of optimized machine models using the AutoML approach, and the KNORA-AutoML prediction model. presents the use of the majority voting method to combine un-optimized machine learning algorithms by traditional ensemble selection strategy.
Figure 4. Conventional ensemble learning model.
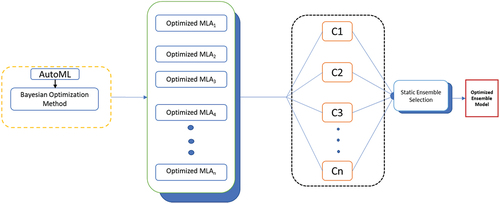
Similarly, demonstrates the ensemble of the optimized MLAs by the traditional ensemble selection strategy. C represents ensemble of optimized machine learning models. Static ensemble selection strategy selects the optimal prediction model from an ensemble of optimized machine learning models (Dos Santos, Sabourin, and Maupin Citation2008). The subset of the ensemble of optimized models is selected for all test samples acquired from the dataset (Ko, Sabourin, and Britto Citation2008) as presented in pseudocode 2. Therefore, selecting a set of optimized models that are less susceptible to resource consumption and response time than all of them significantly improved performance (Zhou, Wu, and Tang Citation2002).
Figure 5. Optimized ensemble selection strategy.
Pseudocode 2: Static Ensemble Optimized Machine Learning Model
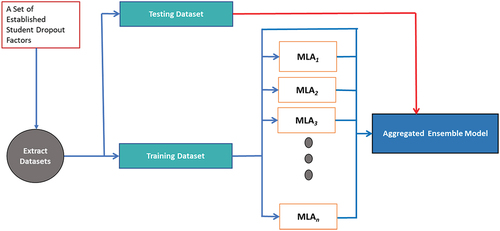
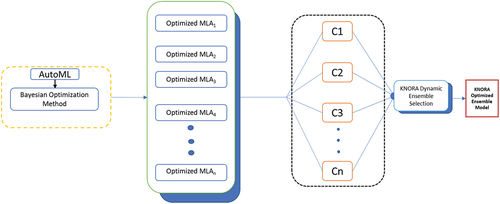
shows the implementation of the KNORA to select the optimal prediction model among the optimized models. The dynamic ensemble strategy automatically selects a competent subset of an ensemble of optimized models for different test sets of training samples (Vriesmann et al. Citation2012). The method chooses an expert ensemble of optimized models and labels each unknown instance The expert is chosen as the ensemble with the highest prediction accuracy up to instance
(Albuquerque et al. Citation2019). The optimized model’s performance depends on a local region defined by k-nearest neighbors in the validation set of test samples (Zhou, Wu, and Tang Citation2002). KNORA applies K hyper-parameters to find the nearest neighbors of the optimized models for a given set of test samples (Oliveira et al. Citation2018) as demonstrated in pseudocode 3.
Figure 6. KNORA optimized dynamic ensemble selection.
Pseudocode 3: KNORAU Optimized Machine Learning Model
describes features in the AutoML method, ensemble learning model, and KNORA-AutoML prediction model. Data was transformed and coded before being used in the compared methods.
Table 1. Features description for AutoML (Bayesian oPTIMIZATION METhod).
Model Evaluation Metrics
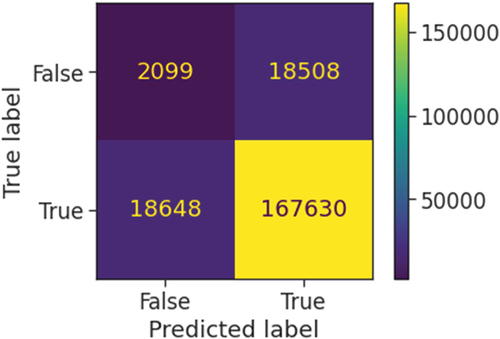
The confusion matrix is an N x N matrix used for evaluating the performance of the classification model, N is the number of target classes. The matrix compares the actual target values with those predicted by the ML model (Novaković et al. Citation2017). Confusion matrix is used to measure the classifier’s accuracy that is the ratio between correctly predicted results and the total number of samples (Hutagaol Citation2019). shows model evaluation metrics determined by True Positive Rate, False Positive Rate, True Negative Rate, and False Negative Rate (Deepa and Bharathi Citation2013). Therefore, the confusion matrix is used to evaluate the precision rate, accuracy rate, recall, f-measure, AUC, and roc curve of the ML prediction models (Hossin and Sulaiman Citation2015). Additionally, the roc curve is a method for evaluating, comparing, and selecting classifiers/models based on their performance in binary classification (Feng et al. Citation2019). ROC Curve visualizes the trade-off between True Positive Rate (TPR) representing the y-axis and False Positive Rate (FPR) for the x-axis (Tharwat Citation2018). TPR is calculated as the number of accurate positive predictions (TP) divided by the total number of positive (P). FPR is calculated as the number of false-positive predictions (FP) divided by the total number of negatives (N) (Hossin and Sulaiman Citation2015).
Figure 7. Confusion matrix with positive and negative values.
Results and Discussions
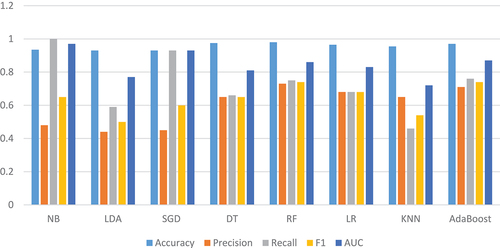
Several machine learning models fail to provide appropriate prediction results due to improper training/testing features selection and corresponding hyperparameter values for the optimal prediction model (Vaccaro, Sansonetti, and Micarelli Citation2021). presents experimental prediction results which used basic/default training and testing of naïve bayes (NB) = 94%, linear discriminant analysis (LDA) = 93%, stochastic gradient descent (SGD) = 93%, decision tree (DT) = 97.5%, random forest (RF) = 98%, logistic regression (LR) = 96.5%, k-nearest neighbors (K-NN) = 95.5% and Adaptive Booting (AdaBoost) = 97%. AdaBoost uses ensemble learning method to learn from the mistakes of weak classifiers to create strong prediction models (Wang Citation2012).
Figure 8. Default classification and prediction of the machine learning algorithms.
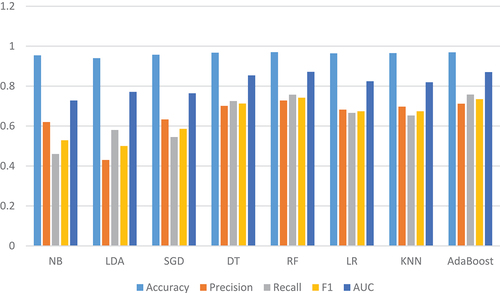
presents a better improvement of the prediction accuracy than . Prediction accuracy results indicate that NB = 95%, LDA = 94%, SGD = 96%, DT = 97%, RF = 97%, LR = 96%, KNN = 97%, and AdaBoost = 97%. Other metrics show slight changes to some machine learning algorithms e.g precision for NB = 62%, SGD = 63%, DT = 70%, LR = 68%, and KNN = 70%. It is proven that there is a trade-off between precision and recall in a given dataset when one increases cause another decrease (Alvarez Citation2002). Thus, increasing precision through optimized methods often results in the decrease of recall and vice versa.
Figure 9. Prediction results of the Bayesian optimization technique.
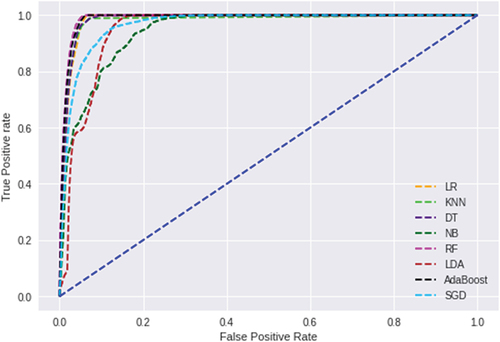
depicts the prediction accuracy of each machine learning algorithm when basic experimentation settings are used to evaluate roc the curve. Results show that SGD = 40%, LDA = 59%, DT = 82%, KNN = 85%, LR = 98%, RF = 97%, NB = 50%, and AdaBoost = 98%.
Figure 10. Default model Roc curve.
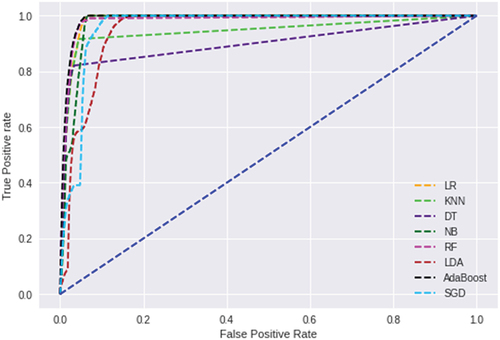
demonstrates the prediction results of various machine learning algorithms using the Bayesian Optimization method. The results show that the machine learning algorithms have improved compared to the basic training and testing of conventional ML algorithms in . The optimized model shows that SGD = 78%, LDA = 60%, DT = 98%, KNN = 85%, LR = 99%, RF = 99%, NB = 60%, and AdaBoost = 99%.
Figure 11. Optimized model Roc curve.
shows the performance of the AutoML and ensemble learning model. The AutoML model using Bayesian search strategy outperformed the ensemble learning model. The AutoML model has an accuracy of LDA = 95%, NB = 97%, and SGD = 97%, and the Ensemble prediction model has an accuracy of 94.7%. Ensemble learning models and traditional training machine learning algorithms suffer from feature processing and corresponding hyperparameters for an optimal machine learning algorithm (Tuggener et al. Citation2019).
Table 2. AutoML and ensemble model evaluation performance.
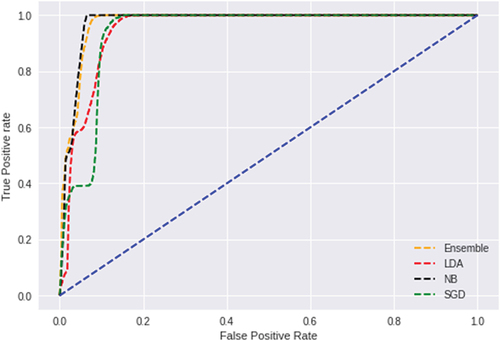
shows the roc curve for the AutoML and Ensemble learning model performed by the same acquired datasets. The classifier that shows curves closer to the left corner indicates better performance, and closer to the 45-degree diagonal leads to poor performance (Zou, O’Malley, and Mauri Citation2007). The results suggest that NB = 100% performed better than the Ensemble prediction model, with approximately 98%, followed by SGD = 96% and LDA = 95%. Furthermore, the accuracy of the roc curve prediction is determined by the diagonal line that separates correctly predicted (true positive) and incorrectly predicted (false negative) values (Vujović Citation2021).
Figure 12. ROC curve for the AutoML and ensemble learning model.
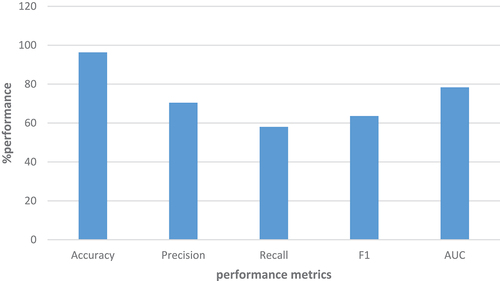
Moreover, shows the prediction results of the optimized machine learning algorithms by Bayesian Optimization Technique. The ensemble of optimized machine learning models applied a traditional selection strategy using the majority-voting rule. The classifiers voted by members to obtain the best performing single classifier for predicting student dropouts in developing countries.
Figure 13. Results for static optimized ensemble model.
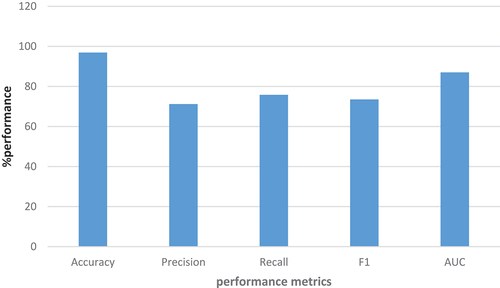
Similarly, shows that the KNORA Optimized model outperforms the static optimized model ensemble. The KNORA-AutoML model scored 97% of accuracy, precision = 71%, recall = 76%, F1 = 74%, and AUC = 87% when compared to the conventional ensemble of optimized ML models with accuracy = 96%, precision = 70%, recall = 58%, F1 = 64%, and AUC = 78%. KNORA-AutoML model performance increased by 0.6% accuracy, 0.8% precision, 17.8% recall, 9.9% F1 and 8.7% AUC. The proposed approach shows better prediction results compared to the traditional ensemble of optimized machine learning algorithms/models.
Figure 14. Results for dynamic optimized ensemble model.
Furthermore, age, gender, attendance, truancy, early marriage, parents’ occupation, class activities, repetition, family size, school cost, distance, disability, extra-curricular activities, and student performance, student grades used in the majority of existing prediction models. Students who drop out are more likely to face difficult situations to meet their basic needs, which drives them to commit crimes by 76.3%, drug abuse by 73.2%, poverty by 66.1%, unemployment by 59.3%, and early marriage by 54.2% (Chuwa Citation2018). depicts significant features influencing student dropouts in secondary schools in Sub-Saharan countries. These were features discovered using statistical and machine learning analysis in various experiments. The Bayesian Optimization model finds better search points with fewer function evaluations and is robust to noisy datasets (Frazier Citation2018). KNORA integrated into AutoML using Bayesian optimization technique to develop a better prediction model for identifying the root causes of student dropouts in Sub-Saharan African countries. In comparison to , the KNORA-AutoML model scored 97% accuracy, 71% precision, 76% recall, 74% F1 and 87% AUC in . Previous research indicates that Mirza and Hassan (Citation2020) improved DT accuracy by 89%, RF accuracy by 96%, SVM accuracy by 93%, and NB accuracy by 94%. Said (Citation2020) achieved an accuracy of 85.5% for RF, 74.1% for MLP, and 78.1% for KNN. Furthermore, Hilmarsson (Citation2019) obtained an Adaboost accuracy of 82.1% and an RF accuracy of 83.1%. Furthermore, Lee and Chung (Citation2019) results revealed 63.4% of RF, 89.4% of DT, and Sansone (Citation2019) results demonstrated the accuracy of 89.1% of SVM, 84.5% of NB, and 90% of SMO. The prediction accuracy of ML algorithms/models is hampered by insufficient data preprocessing, feature engineering, inappropriate machine learning algorithm selection for different test subsets of samples, and their corresponding hyperparameter values for the best prediction model.
shows optimized values for some machine learning algorithms used in different experiments. The optimized algorithms significantly affect prediction results more than traditional machine learning modeling.
Table 3. Demonstration of the Bayesian optimized algorithms.
Additionally, depicts student dropouts’ feature combinations and prediction accuracies. Each feature makes a significant contribution to predicting secondary school dropouts. Home language, age, mother’s education, school distance, and mode of transportation are the most important features influencing student dropouts by 95%. Similarly, household size, gender, school distance, and household children all contribute 94% to student dropout. A combination of five (5) or more features influences student dropouts compared to features less than or equal to four (4). .
Table 4. Prediction results of different combinations of student dropout features.
Conclusion and Future Directions
In many secondary schools in developing countries, children leave school for various reasons that are hard to pinpoint precisely. The severity of the issue has been lessened in developing countries through several programs, including the Big Results Now projects, Free Education for All, No Child Left Behind, Secondary Education Development Programme, and machine learning prediction models. Due to incorrect root cause identification and a lack of formal protocols that may be used to gauge the severity of the problem, dropout rates continue to be a problem, especially in secondary schools. The KNORA-AutoML model outperforms the conventional ensemble learning model and the static ensemble of optimized models using AutoML. The performance of the KNORA-AutoML model is evaluated by the average accuracy, precision, recall, f1, AUC, and roc curve. Performance measures show that KNORA-AutoML model increased by 0.6% accuracy, 0.8% precision, 17.8% recall, 9.9% F1 and 8.7% AUC. Moreover, the findings show that each feature has a significant impact on student dropout prediction; for example, school distance is 28%, household size is 17%, means to school is 16%, household children is 12%, age is 7.5%, parents’ occupation is 4.5%, mother’s education is 4%, father’s education is 3.5%, gender is 3%, and mother tongue language is 2.5%. The various experiments and analyses indicate that the KNORA-AutoML model outperforms the conventional machine learning models/algorithms and static ensemble learning models. The results pertaining to student dropout rates in developing countries receive considerable attention when a well-optimized technique is applied. Furthermore, the study suggests using other dynamic ensemble selection schemes to syndicate the optimized machine learning models by AutoML for predicting student dropouts. Therefore, the proposed prediction model emphasizes closely following up on the suggested features and proper planning for early intervention.
Acknowledgements
The Ministry of Education, Science and Technology (MoEST) is highly acknowledged for sponsoring this study.
Disclosure statement
No potential conflict of interest was reported by the author(s).
Notes
1. Uwezo-Datasets-openAFRICA (africaopendata.org).
References
- Adejo, O. W., and T. Connolly. 2018. Predicting student academic performance using multi-model heterogeneous ensemble approach. Journal of Applied Research in Higher Education 10 (1):61–3695. doi:10.1108/JARHE-09-2017-0113.
- Aguiar, E. 2015. Identifying students at risk and beyond: A machine learning approach (Issue July). University of Notre Dame. https://curate.nd.edu/downloads/w089280479b.
- Albuquerque, R. A. S., A. F. J. Costa, E. Miranda Dos Santos, R. Sabourin, and R. Giusti. 2019. A decision-based dynamic ensemble selection method for concept drift. Proceedings - International Conference on Tools with Artificial Intelligence, ICTAI, 1132–39. 10.1109/ICTAI.2019.00158
- Alvarez, S. A. 2002. An exact analytical relation among recall, precision, and classification accuracy in information retrieval. Boston, Technical Report BCCS-02-01.
- Ayyappan, G., and K. Sivakumar. 2018. A novel approach of ensemble models by using EDM. Indian Journal of Computer Science and Engineering 8 (6):723–29.
- Azad, M., I. Chikalov, S. Hussain, and M. Moshkov. 2021. Entropy-based Greedy algorithm for decision trees using hypotheses. Journal of Entropy 23 (7):1–8. doi:10.3390/e23070808.
- Azizi, N., and N. Farah. 2012. From static to dynamic ensemble of classifiers selection: Application to Arabic handwritten recognition. International Journal of Knowledge-Based and Intelligent Engineering Systems 16 (4):279–88. doi:10.3233/KES-2012-00249.
- Berens, J., K. Schneider, S. Gortz, S. Oster, and J. Burghoff. 2018. Early detection of students at risk: Predicting student dropouts using administrative student data and machine learning methods. Schumpeter School of Business and Economics 6. doi:10.2139/ssrn.3275433.
- Bergstra, J., and Y. Bengio. 2012. Random search for hyper-parameter optimization. Journal of Machine Learning Research 13:281–305.
- Bibi, T. 2018. Factors affecting dropout rate at secondary school level in private schools of Punjab, Pakistan. International Journal of Management Sciences and Business Research 7 (4):1–7.
- Breiman, L. 2001. Random forests. Machine Learning 45 (1): 5–32 doi:10.1023/A:1010933404324.
- Brochu, E. 2010. Interactive Bayesian optimization: Learning user preferences for graphics and animation. University of British Columbia. doi:10.14288/1.0051462.
- Chareonrat, J. 2016. Student dropout factor analysis and trend prediction using decision tree. Journal of Science and Technology 23 (2):187–93.
- Chuwa, P. 2018. Examining causes and effects of rural students dropout in secondary schools in Tanzania: A case of Geita District. Tanzania: University of Dodoma.
- Cruz, R. M. O., L. G. Hafemann, R. Sabourin, and G. D. C. Cavalcanti. 2020. Deslib: A dynamic ensemble selection library in python. Journal of Machine Learning Research 21:1–5.
- Deepa, S., and S. Bharathi. 2013. Textural feature extraction and classification of Mammogram images using CCCM and PNN. IOSR Journal of Computer Engineering 10 (6):7–13. doi:10.9790/0661-1060713.
- Dos Santos, E. M., R. Sabourin, and P. Maupin. 2008. A dynamic overproduce-and-choose strategy for the selection of classifier ensembles. Pattern recognition 41 (10):2993–3009. doi:10.1016/j.patcog.2008.03.027.
- Emmanuel, T., T. Maupong, D. Mpoeleng, T. Semong, B. Mphago, and O. Tabona. 2021. A survey on missing data in machine learning. Journal of Big Data 8 (1). Springer International Publishing. doi:10.1186/s40537-021-00516-9.
- Faruk, B. U. 2015. Assessment of primary and secondary schools education in Katsina State. International Journal of Strategic Research in Education, Technology and Humanities 2 (2):13–27.
- Feng, K., H. Hong, K. Tang, and J. Wang. 2019. Decision making with machine learning and ROC curves. SSRN Electronic Journal 1–52. doi:10.2139/ssrn.3382962.
- Feurer, M., A. Klein, K. Eggensperger, J. T. Springenberg, M. Blum, and F. Hutter. 2015. Efficient and robust automated machine learning. Advances in Neural Information Processing Systems, 2015-Janua December 7-12 2 Hayward St., Cambridge, MA, United States: MIT Press, 2755–2763 doi:10.5555/2969442.2969547.
- Frazier, P. I. 2018. A tutorial on Bayesian optimization. (Issue Section 5, 1–22). http://arxiv.org/abs/1807.02811.
- Fu, Y., H. Liao, and L. Lv. 2021. A comparative study of various methods of handling missing data in unsoda. Agriculture (Switzerland) 11 (8). doi: 10.3390/agriculture11080727.
- Gal, Y. 2015. Dropout as a Bayesian approximation: Insights and applications. International Conference on Machine Learning, Deep Learning Workshop 6-11 July France, ICML, 2015.
- Ganz, M., and E. Konukoglu. 2017. Permutation tests for classification: Revisited. 2017 International Workshop on Pattern Recognition in Neuroimaging, PRNI 2017, 0–21. doi:10.1109/PRNI.2017.7981495
- Gholamy, A., V. Kreinovich, and O. Kosheleva. 2018. Why 70/30 or 80/20 relation between training and testing sets: A pedagogical explanation. Departmental Technical Reports (CS). https://scholarworks.utep.edu/cs_techrep/1209.
- Hilmarsson, H. Æ. 2019. Using machine learning for predicting the likelihood of upper secondary school student dropout.University of Iceland, Reykjavik.
- Hossin, M., and N. Sulaiman. 2015. A review on evaluation metrics for data classification evaluations. International Journal of Data Mining & Knowledge Management Process 5 (2):01–11. doi:10.5121/ijdkp.2015.5201.
- Hutagaol, N. S. 2019. Predictive modelling of student dropout using ensemble classifier method in higher education. Advances in Science, Technology and Engineering Systems 4 (4):206–11. doi:10.25046/aj040425.
- Janardhan, N., and N. Kumaresh. 2022. Improving depression prediction accuracy using fisher score-based feature selection and dynamic ensemble selection approach based on acoustic features of speech. Traitement Du Signal 39 (1):87–107. doi:10.18280/ts.390109.
- Junior, L. M., F. M. Nardini, C. Renso, R. Trani, and J. A. Macedo. 2020. A novel approach to define the local region of dynamic selection techniques in imbalanced credit scoring problems. Expert Systems with Applications 152:113351. doi:10.1016/j.eswa.2020.113351.
- Kalegele, K. 2020. Enabling proactive management of school dropouts using neural network. Journal of Software Engineering and Applications 13 (10):245–57. doi:10.4236/jsea.2020.1310016.
- Karlos, S., G. Kostopoulos, and S. Kotsiantis. 2020. 2020 - a soft-voting ensemble based co-training scheme using static selection for binary classification problems.Pdf. Algorithms 13 (26):1–19. doi:10.3390/a13010026.
- Korkmaz, M., S. Güney, and Ş. Y. Yiğîter. 2012. The importance of logistic regression implementations in the Turkish livestock sector and logistic regression implementations/fields. Journal of the Faculty of Agriculture of Harran University 16 (2):25–36.
- Ko, A. H. R., R. Sabourin, and A. S. Britto. 2008. From dynamic classifier selection to dynamic ensemble selection. Pattern recognition 41 (5):1718–31. doi:10.1016/j.patcog.2007.10.015.
- Kotthof, L., C. Thornton, H. H. Hoos, F. Hutter, and K. Leyton-Brown. 2017. Auto-WEKA 2.0: Automatic model selection and hyperparameter optimization in WEKA. Journal of Machine Learning Research 18:1–5. doi:https://doi.org/10.1007/978-3-030-05318-5_4.
- Krauß, J., B. M. Pacheco, H. M. Zang, and R. H. Schmitt. 2020. Automated machine learning for predictive quality in production. Procedia CIRP Conference on Manufacturing Systems 93:443–48. doi:10.1016/j.procir.2020.04.039.
- Kriesel, D. 2007. A brief introduction to neural networks. http://www.dkriesel.com/en/science/neural_networks.
- Lee, S., and J. Y. Chung. 2019. The machine learning-based dropout early warning system for improving the performance of dropout prediction. Applied Sciences 9 (15):3093. doi:10.3390/app9153093.
- Liu, H., and R. Setiono. 1995. Chi2: Feature selection and discretization of numeric attributes. Proceedings of the International Conference on Tools with Artificial Intelligence, 388–91. doi:10.1109/tai.1995.479783
- Mduma, N., K. Kalegele, and D. Machuve. 2019. Machine learning approach for reducing students dropout rates. International Journal of Advanced Computer Research 9 (42):156–69. doi:10.19101/ijacr.2018.839045.
- Mengash, H. A., L. Hussain, H. Mahgoub, A. Al-Qarafi, M. K. Nour, R. Marzouk, S. A. Qureshi, and A. M. Hilal. 2022. Smart cities-based improving atmospheric particulate matters prediction using chi-square feature selection methods by employing machine learning techniques. Applied Artificial Intelligence 36 (1). Taylor & Francis. doi:10.1080/08839514.2022.2067647.
- Mirza, T., and M. M. Hassan. 2020. Prediction of school drop outs with the help of machine learning algorithms. GIS Science Journal 7 (7):253–63.
- Mnyawami, Y. N., H. H. Maziku, and J. C. Mushi. 2022. Enhanced model for predicting student dropouts in developing countries using automated machine learning approach: A case of Tanzanian’s Secondary Schools. Applied Artificial Intelligence 36 (1):433–51. doi:10.1080/08839514.2022.2071406.
- Mousavi, R., and M. Eftekhari. 2015. A new ensemble learning methodology based on hybridization of classifier ensemble selection approaches. Applied Soft Computing Journal 37:652–66. doi:10.1016/j.asoc.2015.09.009.
- Nguyen, Q. H., H. Ly, L. S. Ho, N. Al-Ansari, H. V. Le, V. Q. Tran, I. Prakash, B. T. Pham, and Y.-S. Shen. 2021. Influence of data splitting on performance of machine learning models in prediction of shear strength of soil. Mathematical Problems in Engineering 2021:1–15. doi:10.1155/2021/4832864.
- Novaković, J. D., A. Veljović, S. S. Ilić, Ž. Papić, and T. Milica. 2017. Evaluation of classification models in machine learning. Theory and Applications of Mathematics & Computer Science 7 (1):39–46. https://uav.ro/applications/se/journal/index.php/TAMCS/article/view/158.
- Ojala, M., and G. C. Garriga. 2010. Permutation tests for studying classifier performance. Journal of Machine Learning Research 11:1833–63.
- Oliveira, D. V. R., G. D. C. Cavalcanti, T. N. Porpino, R. M. O. Cruz, and R. Sabourin. 2018. K-nearest Oracles borderline dynamic classifier ensemble selection. Proceedings of the International Joint Conference on Neural Networks, 2018-July. 10.1109/IJCNN.2018.8489737
- PO-RALG. 2019. Pre-primary, primary, adult and non formal education statistics. United Republic of Tanzania: President's Office Regional Administration and Local Government.
- PO-RALG. 2020. Pre-primary, primary, adult and non formal education statistics United Republic of Tanzania: President's Office Regional Administration and Local Government.
- Prabaharan, S. B., G. Mehta, and H. Chauhan. 2020. A study on recent developments in automated machine learning. Solid State Technology 63 (November):2612–20.
- Rasmussen, C. E. 2004. Gaussian processes in machine learning. Lecture Notes in Artificial Intelligence and Lecture Notes in Bioinformatics 3176:63–71. doi:10.1007/978-3-540-28650-9_4.
- Rezaie, M. G., H. S. Zadeh, H. Ying, and M. Dong. 2010. Selection–fusion approach for classification of datasets with missing values. Pattern recognition 43 (6):1–27. doi:10.1016/j.patcog.2009.12.003.
- Rovira, S., E. Puertas, and L. Igual. 2017. Data-driven system to predict academic grades and dropout. PLoS ONE 12 (2):1–21. doi:10.1371/journal.pone.0171207.
- Said, H. 2020. DevelopIng dropout predictive system for secondary schools, by using classification algorithm: A case study of Tabora region.
- Sansone, D. 2019. Beyond early warning indicators: High school dropout and machine learning. Oxford Bulletin of Economics and Statistics 81 (2):456–85. doi:10.1111/obes.12277.
- Sara, N. B., R. Halland, C. Igel, and S. Alstrup. 2015. High-school dropout prediction using machine learning: A Danish large-scale study. ESANN 2015 Proceedings, European Symposium on Artificial Neural Networks, Computational Intelligence and Machine Learning 22-24 April 2015 Bruges (Belgium).
- Saroj, R. K., P. K. Yadav, R. Singh, and O. N. Chilyabanyama. 2022. Machine learning algorithms for understanding the determinants of under-five mortality. BioData mining 15 (1):1–22. doi:10.1186/s13040-022-00308-8.
- Satyanarayana, A., and M. Nuckowski. 2016. Data mining using ensemble classifiers for improved prediction of student academic performance. ASEE Mid-Atlantic Section Spring 2016 Conference, George Washington University, Washington D.C.
- Shanthini, A., G. Vinodhini, and R. M. Chandrasekaran. 2018. Predicting students’ academic performance in the university using meta decision tree classifiers. Journal of Computer Science 14 (5):654–62. doi:10.3844/jcssp.2018.654.662.
- Soofi, A. A., and A. Awan. 2017. Classification techniques in machine learning: Applications And issues. Journal of Basic & Applied Sciences 13:459–65. doi:10.6000/1927-5129.2017.13.76.
- Statista. 2022. Pupils out of lower secondary school by gender and region.
- Steinki, O., and Z. Mohammad. 2015. Introduction to ensemble learning. SSRN Electronic Journal 1. doi:10.2139/ssrn.2634092.
- Tharwat, A. 2018. Classification assessment methods. Applied Computing and Informatics 17 (1):168–92. doi:10.1016/j.aci.2018.08.003.
- Tsiakmaki, M., G. Kostopoulos, S. Kotsiantis, and O. Ragos. 2020. Implementing autoML in educational data mining for prediction tasks. Applied Sciences (Switzerland) 10 (1):1–27. doi:10.3390/app10010090.
- Tuggener, L., M. Amirian, K. Rombach, S. Lorwald, A. Varlet, C. Westermann, and T. Stadelmann. 2019. Automated machine learning in practice: State of the art and recent results. Proceedings - 6th Swiss Conference on Data Science, SDS 2019, 31–36. 10.1109/SDS.2019.00-11
- Turner, R., D. Eriksson, M. McCourt, J. Kiili, E. Laaksonen, Z. Xu, and I. Guyon. 2021. Bayesian optimization is superior to random search for machine learning hyperparameter tuning: Analysis of the black-box optimization challenge 2020. NeurIPS 2020 Competition and Demonstration Track, 3–26. http://arxiv.org/abs/2104.10201
- UNESCO-Tanzania. 2015. National Commissions for United Nations Educational, Scientific and Cultural Organizations (UNESCO). https://unesdoc.unesco.org/ark:/48223/pf0000244391_eng.
- UNICEF-Tanzania. 2018. Global initiative on out of school children: Tanzania verification of the out of school children study. United Republic of Tanzania: Ministry of Education Science and Technology.
- URT. 2008. The United Republic of Tanzania. Education Sector Development Programme 2008-2017. United Republic of Tanzania: Ministry of Education Science and Technology.
- Vaccaro, L., G. Sansonetti, and A. Micarelli. 2021. An empirical review of automated machine learning. Journal of Computers 10 (1):1–27. doi:10.3390/computers10010011.
- Vriesmann, L. M., A. De Souza Britto, L. E. S. De Oliveira, R. Sabourin, and A. H. R. Ko. 2012. Improving a dynamic ensemble selection method based on oracle information. International Journal of Innovative Computing and Applications 4 (3–4):184–200. doi:10.1504/IJICA.2012.050053.
- Vujović, Ž. 2021. Classification model evaluation metrics. International Journal of Advanced Computer Science and Applications 12 (6):599–606. doi:10.14569/IJACSA.2021.0120670.
- Wang, R. 2012. AdaBoost for feature selection, classification and its relation with SVM, a review. 2012 International Conference on Solid State Devices and Materials Science 25:800–07. doi:10.1016/j.phpro.2012.03.160.
- Waring, J., C. Lindvall, and R. Umeton. 2020. Automated machine learning: Review of the state-of-the-art and opportunities for healthcare. Artificial intelligence in medicine 104 (January):101822. doi:10.1016/j.artmed.2020.101822.
- Webb, G. I. 2011. Naïve Bayes. Springer Science and Business Media. doi:10.1007/978-0-387-30164-8.
- Whaley, D. L. 2005. The Interquartile Range: Theory and Estimation. Electronic Theses and Dissertations. http://dc.etsu.edu/etd%0Ahttp://dc.etsu.edu/etd.
- World Bank. 2014. How Tanzania plans to achieve “big results now” in education. http://www.worldbank.org/en/news/feature/2014/07/10/how-tanzania-plans-to-achieve-big-reforms-now-in-education.
- Wu, J., X. Y. Chen, H. Zhang, L. D. Xiong, H. Lei, and S. H. Deng. 2019. Hyperparameter optimization for machine learning models based on Bayesian optimization. Journal of Electronic Science and Technology 17 (1):26–40. doi:10.11989/JEST.1674-862X.80904120.
- Yang, L., and A. Shami. 2020. On hyperparameter optimization of machine learning algorithms: Theory and practice. Neurocomputing 415:295–316. doi:10.1016/j.neucom.2020.07.061.
- Zabinsky, Z. B. 2011. Random search algorithms. Wiley Encyclopedia of Operations Research and Management Science. doi:10.1002/9780470400531.eorms0704.
- Zeineddine, H., U. Braendle, and A. Farah. 2021. Enhancing prediction of student success: Automated machine learning approach. Computers & Electrical Engineering 89 (November):106903. doi:10.1016/j.compeleceng.2020.106903.
- Zhou, Z. H., J. Wu, and W. Tang. 2002. Ensembling neural networks: Many could be better than all. Artificial intelligence 137 (1–2):239–63. doi:10.1016/S0004-3702(02)00190-X.
- Zhu, X., X. Wu, and Y. Yang. 2004. Dynamic classifier selection for effective mining from noisy data streams. Proceedings - Fourth IEEE International Conference on Data Mining, ICDM 2004, 305–12. 10.1109/icdm.2004.10091
- Zou, K. H., A. J. O’Malley, and L. Mauri. 2007. Receiver-operating characteristic analysis for evaluating diagnostic tests and predictive models. Circulation 115 (5):654–57. doi:10.1161/CIRCULATIONAHA.105.594929.