
ABSTRACT
The economic burden of Type 2 Diabetes (T2D) on society has increased over time. Early prediction of diabetes and prediabetes can reduce treatment cost and improve intervention. The development of (pre)diabetes is associated with various health conditions that can be monitored by routine health checkups. This study aimed to develop amachine learning-based model for predicting (pre)diabetes. Our frameworks were based on 22,722 patient samples collected from 2013 to 2020 in ageneral hospital in Korea. The disease progression was divided into three categories based on fasting blood glucose: normal, prediabetes, and T2D. The risk factors at each stage were identified and compared. Based on the area under the curve, the support vector machine appeared to have optimal performance. At the normal and prediabetes stages, fasting blood glucose and HbA1c are prevalent risk features for the suggested models. Interestingly, HbA1c had the highest odds ratio among the features even in the normal stage (FBG is less than 100). In addition, factors related to liver function, such as gamma-glutamyl transpeptidase can be used to predict progression from normal to prediabetes, while factors related to renal function, such as blood urea nitrogen and creatinine, are prediction factors of T2D development.
Introduction
Type 2 diabetes (T2D) is defined as hyperglycemia caused by abnormal insulin action, resulting in metabolic malfunction in energy generation from ingested glucose (Association Citation2020). T2D is achronic disease that is increasing the levels of mortality, morbidity, severe complications, and health expenditure** (Khan et al. Citation2020; Zhou et al. Citation2016). Unfortunately, despite this growing concern (Khan et al. Citation2020), multiple studies have reported that reducing blood glucose levels is challenging (Adu et al. Citation2019; Carls et al. Citation2017; Schlender et al. Citation2017). The rate of diabetes diagnosis in the Republic of Korea (ROK) is rapidly increasing, similar to global trends. Among people with diabetes, 60% were treated with oral hypoglycemic regimen or insulin therapy, but only 28.3% of patients achieved the glycemic goal (HbA1c < 6.5%) from 2016 to 2018 (Jung et al. Citation2021).
Currently, there is no permanent treatment for T2D. The World Health Organization (WHO) has highlighted the implications of the early detection and screening of noncommunicable diseases (NCDs) as cost-effective interventions (WHO(World Health Organization) Citation2022). Recently, various machine learning (ML) algorithms used to automatically solve prediction or classification problems using past information (Zhou et al. (Citation2016) have been introduced in bioinformatics fields, including diabetes prediction (Sharma and Shah Citation2021; Zhu et al. Citation2021). Despite being arobust risk factor for T2D (Reddy Citation2016; Zand, Ibrahim, and Patham Citation2018), the significance of prediabetes is often disregarded. Prediabetes diagnosis depends on the glycemic status, such as impaired fasting glucose, impaired glucose tolerance, and elevated HbA1c levels. According to the American Diabetes Association, impaired fasting glucose levels range from 100–125 mg/dl (Edwards and Cusi Citation2016). The number of people with prediabetes is rapidly increasing worldwide, and 5–10% of these individuals have this condition progress to diabetes everyyear (Tab Ák et al. Citation2012). However, the risk factors that play acrucial role in the progression from normal status to prediabetes and then to diabetes are unclear. Deberneh and Kim (Citation2021) considered prediabetes when predicting diabetes states; however, they predicted the progress of three diabetic states simultaneously. The lifetime progression from prediabetes to overt T2DM is approximately 70% (Souza et al. Citation2012; Tab Ák et al. Citation2012). Management of prediabetes is essential to mitigating the progression to T2D, which is achronic disease.
In the ROK, the general health checkup of the entire population living in the country is covered by the National Health Insurance Service. Other health checkup programs, such as employment and recruitment physical examinations, are also available. Health checkup data consist of various physical and physiological features, including lifelog, blood test, liver function, lipid panel test, infection, urinalysis for kidney function, drug history, and doctor’s medical examination by interview. In this study, we utilized the health checkup data of the normal, prediabetic, and T2D groups that were produced in ageneral hospital.
This study aimed to develop various ML prediction methods for the future state of prediabetes using current real-world data from Korean medical examination records. Furthermore, we aimed to identify crucial risk factors for prediabetes and diabetes.
Materials and Methods
Ethics Declarations
Clinical and laboratory variables were collected from the clinical data warehouse platform and the electronic medical records in Ulsan University Hospital. This study is categorized under the records-based retrospective research; therefore, informed consent by participants was not required. The study was reviewed and the protocol approved by the Institutional Human Experimentation Committee Review Board of Ulsan University Hospital, Republic of Korea (UUH 2020-09-003). The study was conducted in accordance with the ethical standards set forth in the 1964 Declaration of Helsinki.
Participants
In this study, the dataset contained 133,387 instances collected from 73,767 subjects, and each instance had 218 variables. Variables that included the subjective opinions of the medical staff were excluded. From the total data, 57 variables were ultimately selected, excluding variables with missing values amounting to 20% or more, and variables with suspected multicollinearity.
Study Design
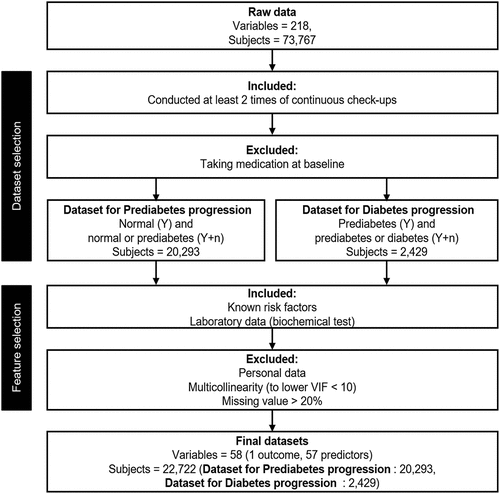
shows the variables used in the study and the process of selecting study subjects, which was as follows. First, 33,784 subjects who had undergone two or more health checkups were selected. Second, fasting blood glucose was considered to be the diabetes screening criterion: when it was >125 mg/dL, the patient was diagnosed as diabetic, and when it was <100 mg/dL, the patient was considered to be normal and borderline, and was classified as prediabetic. Finally, 33,403 participants met the inclusion criteria. In this study, the datasets from normal to prediabetic, and from prediabetic to diabetic were analyzed separately.
Figure 1. Flow chart of study participants.
Data
shows that among the 57 variables, including individual characteristics, spirometry test, vital signs, complete blood count, blood type, inflammatory marker test, liver function test, kidney function test, lipid panel test, diabetes test, mineral/electrolytes, thyroid function test, infection test, urine test, and medical examination by interview.
Table 1. Checkup variables under study.
Data Preprocessing
The research process included data preprocessing, model description, hyperparameter tuning, and model evaluation. Data preprocessing entails various methods for improving data quality, such as outlier detection, missing-value imputation, and data normalization (Alasadi and Bhaya Citation2017). ML models can improve performance through data preprocessing.
Data Split
The data were split at an 8:2 ratio to test the training and performance of the predictive model. In addition, GridSearchCV, which simultaneously performs the parameter optimization algorithm grid search and k-fold cross-validation, was conducted. In this study, k was set to 5, and stratification was set to match the label distribution of each fold to accurately reflect the response variable distribution of the entire dataset.
Outlier and Missing Data Treatment
In this study, outlier detection and missing value imputation methods were considered in the generation of predictive models. For example, when considering outliers as observation values that cannot be obtained by humans, values with a pulse rate of ≥ 300 were excluded, and the k-nearest neighbor (KNN) imputation method was used. KNN is a supervised learning algorithm that, given the sample, checks the distribution of surrounding data and classifies it under the category with the highest frequency (Jadhav, Pramod, and Ramanathan Citation2019). In this study, the hyperparameter k was set to 5 using Grid Search CV. For categorical variables, missing values are replaced by nearest-neighbor modes based on Euclidean distances, and for continuous variables by the mean.
Cost-Sensitive Learning
ML models were appropriately predicted when the ratios of each class were similar. If the class ratio was imbalanced, the algorithm learned to predict most of the classes in a biased manner. Consequently, many studies have been conducted to solve the problem of class imbalance (Haixiang et al. Citation2017; Zhu et al. Citation2018). In this study, we used cost-sensitive learning. Increased cost is the main result of wrong predictions. The goal of cost-sensitive learning is to minimize the cost of the model on the dataset. Therefore, the classifier is set to respond sensitively to the minority class by assigning a low weight to the majority class while setting high weights for the misclassification of the minority class without generating the data to reduce the bias with regard to the majority class.
Feature Importance for Diabetes Prediction
Feature importance is a measure of the degree to which agiven variable in adataset influences diabetes prediction. The feature selection methods include filtering, embedment, and wrapping (Hoque, Bhattacharyya, and Kalita Citation2014). Filtering is a method for selecting variables from properties of statistical data such as mutual information and correlation coefficient without using modeling approaches. Wrapping is a method for selecting the subset with optimal prediction accuracy using only a subset of the variables. The embedded method includes feature selection in its modeling technique. In this study, the results of feature selection were presented using the filtering method-based Select K Best, embedded method-based least absolute shrinkage and selection operator (LASSO), wrapping method-based Boruta, and permutation feature importance techniques. The Select K Best algorithm selects variables using aunivariate statistical test. The chi-square statistic, which is commonly used for classification tasks, was used in this study. The LASSO method is a technique for reducing insignificant variables in the regression model to zero by penalizing the objective function to minimize prediction error (Fonti and Belitser Citation2017). The Boruta algorithm removes variables that are considered less significant than randomized copy variables (Kursa, Jankowski, and Rudnicki Citation2010). Permutation significance is used to determine the importance of each variable through the degree of increase in error when a particular variable is randomly permuted (Altmann et al. Citation2010). High dependence of the ML model on certain variables significantly reduces the prediction accuracy, and non-significant variables do not change the prediction accuracy. The algorithm exhibits the benefits of not re-learning the model, consuming relatively little time and resources, universality, and clarity. The Boruta algorithm is limited to the application of random forest model-based algorithms only. Therefore, we propose a permutation feature importance method that is applicable to all algorithms as a candidate risk factor selection method for the response variable (Fisher, Rudin, and Dominici Citation2019).
Statistical Learning and Machine Learning Algorithms
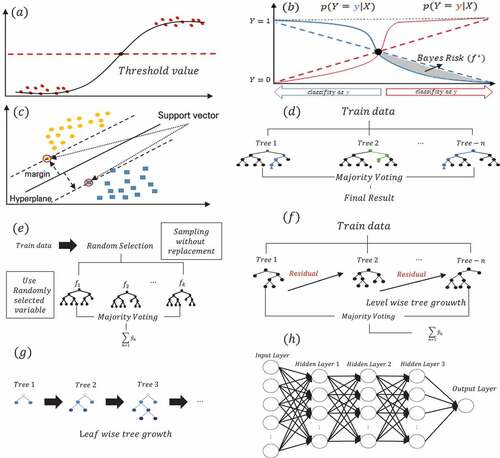
Based on the previous diabetes status, we used logistic regression, naive Bayes, support vector machines, random forests, extremely randomized tree, XG Boost, Light GBM, and multi-layer perceptron to predict the occurrence of prediabetes and diabetes at certain time points, as shown in . The multicollinearity problem was addressed before this study by removing variables that were higher than 10.
Figure 2. Machine learning model architecture: (a) Logistic regression; (b) naïve bayes; (c) support vector machine; (d) random forest; (e) extremely randomized tree (f) extreme gradient boosting; (g) light gradient boosting machine; (h) multilayer perceptron.
Logistic Regression
Logistic regression (LR) is a statistical model used to estimate the relationship between abinary response variable and independent variable. LR is used to determine the model that optimally describes the relationship between the binary response variable and a set of independent predictor variables. LR for predicting diabetes has been studied extensively (Hossain, Uddin, and Khan Citation2021; Khan, Uddin, and Srinivasan Citation2019; Uddin et al. Citation2022). The log odds ratio is expressed as a linear combination of each variable, which eases interpretation.
Naïve Bayes
Naïve Bayes (NB) is based on Bayes’ theory and is extensively researched (Choubey et al. Citation2017). The main characteristic is learning using specific rule-based algorithms rather than assuming independence between independent variables or learning through algorithms. The purpose of NB is to minimize the Bayes risk. The NB algorithm has the advantages of being simple and yielding efficient computation and outstanding classification results.
Support Vector Machine
Classification by the support vector machine (SVM) is based on a support vector that maximizes the margin (Kumari and Chitra Citation2013). The margin is the distance between the hyper plane that separates the classes and the support vector closest to the hyperplane. The parameter indicates the degree to which misclassification is allowed. Because the margin width can be controlled by adjusting the parameter, the trade-off between the bias and variance can be adjusted. The constraint can be solved using the Lagrange multiplier method while minimizing the objective function.
Random Forest
Random forest (RF) combines bootstrap aggregation with the concept of randomly selecting independent variables to ensure ensemble diversity (Qi Citation2012). The overall prediction accuracy can be improved by combining the results predicted by decision trees, which are several individual classifiers. Decision trees have high variance; however, the ensemble creates arobust model, which increases the generalization performance and reduces the risk of over fitting. The prediction result is the value with the highest ratio among the predicted outcomes of each drug classifier with a binomial response variable.
Extremely Randomized Trees
Extremely randomized tree (ET) is atree-based ensemble model with characteristics that are similar to those of the random forest model. The extra tree is distinguished by its use of the entire train data rather than bootstrap samples for construction. In addition, the optimal node for the feature is divided by random selection among all the variables. When raw data is used, the bias is lower than that of the bootstrap sample, and reduces variance by randomly selecting the split point. Furthermore, it reduced the operation speed (Geurts, Ernst, and Wehenkel Citation2006).
Extreme Gradient Boosting
Extreme Gradient Boosting (XG Boost) is a tree-based ensemble ML algorithm that uses a gradient boosting framework (Zhang and Zhan Citation2017), and is characterized by an algorithm that adds aregularization term to the GBM. It has the advantage of being able to be flexibly tuned according to the task by supporting various loss functions. The regularization term also contributes to preventing overfitting by penalizing the model from becoming too complex.
Light Gradient Boosting Machine
Light gradient boosting machine (Light GBM) is atree-based ensemble ML algorithm that uses a gradient boosting framework (Ke et al. Citation2017). The existing framework scans all variables and data objects to estimate the information gain; therefore, it identifies the optimal solution, but is limited by being highly time consuming. However, the Light GBM algorithm was solved by introducing methods of gradient-based one-side sampling and exclusive feature bundling. As aresult, Light GBM has the advantage of fast calculation speed and less memory consumption when handling large data.
Multi-Layer Perceptron
The multi-layer perceptron (MLP) is a form of perceptron that is created by sequentially connecting multiple layers of perceptron to illustrate the operation mechanism of asingle neuron in the human brain. Each perceptron is divided into an input layer, a hidden layer, and an output layer according to the configuration. Because the MLP can be applied to nonlinear data using activation function, it has awide range of applications and yields strong predicted results, thus extensive study is being performed (Qtea and Awad Citation2021). In MLP, the initial weight is set to an arbitrary value, and forward propagation is performed from the input layer to the output layer. Further more, back propagation is performed to continuously update the weight value to minimize the error between the final output value and the actual value. This is implemented using the function provided by scikit-learn.
Results
Basic Characteristics
According to their prior states, the study participants were split into two datasets for this study. The dataset for prediabetes progression shows that 16,544 of the 20,293 formerly normal individuals remained normal, where as 3,749 deteriorated to the prediabetes stage. Out of the 2,429 persons with prediabetes, 2,008 had it during the study, and in 421 people, it progressed to T2D according to the dataset for Diabetes progression. Details on the general traits of those who moved from the study population to the current state are shown in by the previous state.
Table 2. General characteristics of two datasets in the study design.
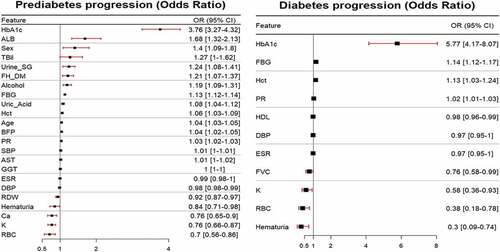
Odds Ratio
shows the results of the odds ratio (OR) plot for statistically significant variables determined using the LR model according to the conditions of the study subjects. shows that increasing the HbA1c feature by 1 unit increased the probability of prediabetes by 3.76 times but increasing the RBC variable by 1 unit decreased the odds of prediabetes by 0.7 times. indicates that the odds of diabetes increase 5.77 times that of HbA1c increases by one unit, whereas the odds of diabetes drop by 0.3 times when hematuria increases by 1 unit. The remaining variables were interpreted in the same way.
Figure 3. Odds ratio plot for statistically significant features. Plot (a) displays the probability of developing prediabetes from normal as one unit of each feature increases and Plot (b) displays the probability of developing diabetes from prediabetes as one unit of each feature increases.
Variable Significance Analysis
The variable significance for the prediction performance was calculated for each algorithm and listed sequentially. presents the top 10 variables obtained by collecting the average ranks of all variables for each algorithm using the permutation feature importance method.
Table 3. The top-10 ranked variables by permutation feature importance for each ML in two datasets.
summarizes the candidate risk factors using the permutation feature importance method of diabetes compared with the normal and prediabetes stages. shows the variables from the dataset for Prediabetes progression, which are the most important in predicting the progression of normal to prediabetes: fasting blood glucose (FBG), HbA1c, body fat percentage (BFP), age, pulse rate (PR), albumin (ALB), K, gamma-glutamyl transferase (GGT), red blood cells (RBC), and thyroid-stimulating hormone (TSH). OR in , and implies that even in individuals with normal glucose levels in the current examination, higher BFP, age, PR, or albumin or lower RBC, K, or TSH levels might be vulnerable to prediabetes in the subsequent checkup. Particularly, we demonstrated that the indicators of liver function, such as ALB and GGT, are implied in the prediction of prediabetes. This is consistent with results from previous studies that investigated the correlation between the incidence of diabetes and metabolic indicators such as abnormal liver or thyroid function and hypokalemia (Chatterjee et al. Citation2011; Haghighi et al. Citation2011; Kalra, Aggarwal, and Khandelwal Citation2019; Sabanayagam et al. Citation2009).
Table 4. Variable ranking for all 8 models by permutation feature importance.
Furthermore, shows the variables from dataset for Diabetes progression, which are the most important in predicting the progression of prediabetes to T2D: fasting blood glucose (FBG), HbA1c, blood urea nitrogen (BUN), creatinine (Cr), diastolic blood pressure (DBP), hematuria, C- reactive protein (CRP), ALB, eosinophil, and moderate-intensity activity (MIA). BUN, Cr, and hematuria might reflect renal function, and CRP and eosinophil have been assessed as inflammation markers. Subjects with prediabetes and whose kidney function or inflammation are abnormal may need corresponding attention to prevent progression to diabetes. This result is supported by previous studies that investigated the correlation between the incidence of diabetes and kidney function, inflammation/infection, or physical activity (Berbudi et al. Citation2020; Echouffo-Tcheugui et al. Citation2016; Freeman and Pennings Citation2022; Kouitcheu Mabeku, Noundjeu Ngamga, and Leundji Citation2020; Xie et al. Citation2018).
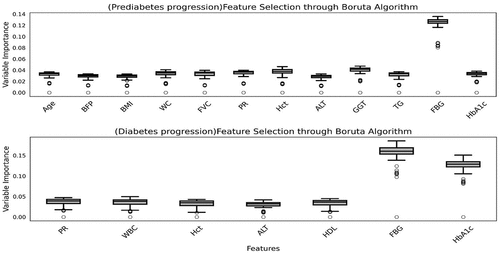
Compared with the permutation feature importance method, variables selected by considering Boruta, SelectKBest, and Lasso methods were also introduced. shows the feature selection through Boruta algorithm. The prediabetes progression boxplot displays the candidate risk factor of developing prediabetes. The selected features are FBG, GGT, Hct, PR, WC, HbA1c, FVC, Age, TG, BFP, BMI and ALT. The diabetes progression boxplot displays the candidate risk factor of developing diabetes from prediabetes. The selected features are FBG, HbA1c, PR, WBC, HDL, Hct and ALT.
Figure 4. Feature selection through Boruta algorithm.
shows the variables selected by Boruta, SelectKBest, and Lasso. In prediabetes, FBG, HbA1c, and Hct showed the most significant results in common, and FBG, HbA1c, Hct, and HDL were selected as significant variables in diabetes progression.
Table 5. The variable selected Boruta, SelectKbest, Lasso method.
Performance of Machine Learning Method
The performance evaluation criteria for prediction in this study were the area under the curve (AUC), accuracy, sensitivity, specificity, positive predictive value (PPV), negative predictive value (NPV), and F1 score. A positive result was defined as an abnormal event. The results of the comparison of the performance of each predictive model according to the condition of the study subject are presented in .
Table 6. The performance measure of each classification algorithm.
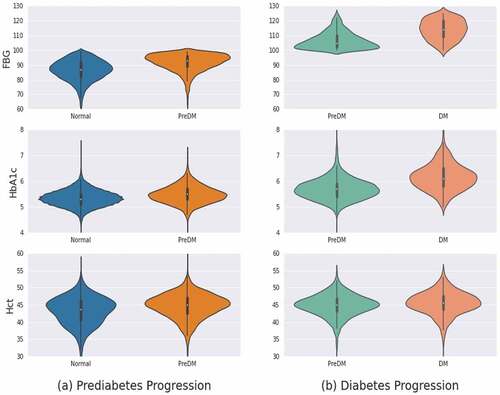
is the result of visualizing the characteristics of each group for aspecific variable as aviolin plot. The selected variables include FBG, HbA1c, and Hct. These variables are commonly selected as candidate risk factors by the permutation feature importance, Boruta, SelectKBest, and Lasso methods. As indicated by the general characteristics in , FBG and HbA1c clearly differ in the distribution of variable values between prediabetes and diabetes progression. However, the Hct does not appear to be clearly visible. Indeed, the mean Hct in the normal to prediabetes progression is 43.2 and is widely distributed between 40 and 48, and intensively distributed between 40 and 50 in prediabetes. Moreover, the prediabetes of diabetes progression tends to be more concentrated around 45 than diabetes.
Figure 5. Violin plot. (a) prediabetes progression (b) diabetes progression associated with FBG, HbA1c, Hct.
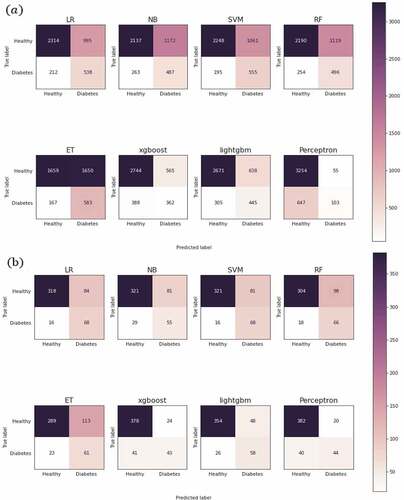
shows the confusion matrix to confirm the concrete prediction results. In , prediabetic progression shows that perceptron has the highest true positive cases. However, the true-negative outcome was the most disastrous. ET also produced numerous false negatives but most of them were true-negatives. The optimal models are LR and SVM as recommended in . Overall, diabetes progression predicted more true-negatives than false-positives. Particularly, LR, SVM, and RF models showed optimal prediction among actual diabetic patients, and the SVM model showed low false-negative results.
Figure 6. Confusion matrix. (a) prediabetes progression; (b) diabetes progression through each machine learning algorithm.
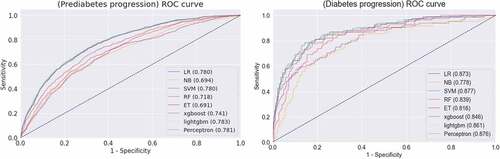
According to the results applied to the test set, there was no significant difference among the performance of the single models (LR, NB, SVM, RF, ET, XG Boost, Light GBM and MLP). AUC values were calculated under the area of the Roc curve plotted using sensitivity and specificity. It is used to evaluate the effectiveness of machine learning or the reliability of astudy. shows the ROC curve that compares the results of the classification model. Following evaluation of the model based on AUC for prediabetes prediction, the Light GBM model yielded the highest result, 0.783. In addition, the AUC result of diabetes progression was found to be the highest in the SVM model: 0.877.
Figure 7. ROC curve (a) prediabetes progression, plot (b) diabetes progression through each machine learning algorithm.
Discussion and Conclusions
The global T2D prevalence was 8.8% in 2017, and the prediabetes population is expected to exceed 500million people by 2045 (Standl et al. Citation2020). Early screening is crucial because prediabetes is arisk factor for life-threatening diseases such as heart failure (Wu, Liang, and Xie Citation2021). In addition, previous studies have evaluated the effects of prediabetes on complications, including neuropathy, nephropathy, retinopathy, and cardiovascular disease. However, the identification of risk groups for prediabetes has not been studied.
Therefore, we developed 8 ML-based models for predicting prediabetes and T2D at future time points. Aprediabetes stage that progressed for along time during the transition from normal to diabetes was considered. For the eleven variables that violated the multicollinearity problem were removed by fitting LR. Furthermore, LR, NB, SVM, RF, ET, XG Boost, Light GBM, and MLP were used for comparison. In addition, cost-sensitive learning was used to solve the problem that occurs when ML classifies imbalanced datasets. Overall, the SVM showed superior prediction performance in terms of AUC, accuracy, and sensitivity. In our study, we utilized big data such as national health insurance health checkup data, which covered more than 10million adults annually in the ROK (Korean Statistical Information Service (KOSIS) Citation2021), to develop an ML platform that is applicable nationwide. We suggest that this national health checkup-based prediction model can contribute to the public healthcare infrastructure.
Furthermore, we identified prediction factors and consolidated them into the physiological status of prediabetes and T2D, respectively. First, FBG and HbA1c levels were the most significant factors for the early prediction of both prediabetes and T2D. These results are expected to be based on the pathophysiology of diabetes mellitus. FBG or HbA1c is also regarded as the top-ranked factor by Boruta, SelectKBest, and Lasso method. These results suggest that all methods in our study showed similar feature selection performance. However, we demonstrated that FBG had the strongest effect on future prediabetes, even in the normal blood glucose range. High BFP, abnormal liver and thyroid function, and electrolyte imbalance are expected to have significant effects on the development of prediabetes in future. These abnormal conditions may be related to metabolic disturbances and endocrine homeostasis. Therefore, high glucose levels within the normal range may be associated with prediabetes development in individuals with the abnormal physiological conditions mentioned above. Similarly, altered kidney function and inflammation/infection are prediction factors for the future development of T2D. Surprisingly, symptoms of kidney malfunction, as evidenced by BUN and creatinine tests, were demonstrated even before T2D development. Generally, poor management of diabetes induces kidney failure due to pathological vascular alterations (Braunwald Citation2019). However, our study showed that kidney dysfunction in prediabetic individuals may develop before T2D. In addition, inflammation, as evidenced by CRP and eosinophil counts within prediabetes, is a prediction factor for future diabetes. According to aprevious report (Tariq et al. Citation2020), eosinophilia is associated with inflammation in kidney diseases. These results suggest that the progression from prediabetes to diabetes can be predicted in individuals with altered kidney function. Odds ratio analysis showed that HbA1c had the highest value for prediabetes and diabetes progression as 3.76 and 5.77, respectively. Particularly, even in the normal stage where the FBG value is less than 100, HbA1c was identified as the most significant risk factor for prediabetes.
This study had certain limitations. First, HbA1c and the oral glucose tolerance test were not considered as criteria for screening diabetes, but only FBG was determined. However, there are cases where FBG alone is determined in the same manner as that used by Dinh et al. (Citation2019) and Wu et al. (Citation2021). Second, cost-sensitive learning was used to solve the problem of ML predicting all the multiple classes when it is an imbalanced dataset. While the performance of predicting normal participants as normal was excellent, errors in predicting normal participants as abnormal occurred. The prediction results are expected to improve if the appropriate weights required for each model are found. Third, because the model development and verification processes were conducted with asingle dataset, it is essential to secure additional data to verify the results derived from this study.
In addition, two future studies are recommended. First, for biomedical data, many studies have compared LR and ML, a statistical model (Lee et al. Citation2018; Nusinovici et al. Citation2020). Unlike the ML algorithm, LR models can interpret according to the contribution of parameters in the form of aparametric function; however, ML is not always possible (Dreiseitl and Ohno-Machado Citation2002). Therefore, we suggest using an explainable AI (×AI) method to explain the results of ML algorithms. Second, the National Health Insurance Corporation provides free health checkups every two years for people over 20 years of age. At this time, health check-ups are conducted every two years for office workers and every year for non-office workers. Therefore, it would be useful to identify the factors that have asignificant effect on diabetes according to the health examination cycle.
Author Contributions Statement
H.Y.analyzed the data and prepared the figures. J.G.prepared the data preprocess and analyzed the data. J.M.provided the data and reviewed the manuscript. T.H.designed the methodology and obtained funding for the study. J.Y.designed, supervised, and reviewed the study.
Data Availability
The datasets generated and/or analyzed during the current study are accessible from the corresponding author upon reasonable request.
Disclosure Statement
No potential conflict of interest was reported by the author (s).
Additional information
Funding
References
- Adu,M.D., U.H.Malabu, A.E.O.Malau-Aduli, and B.S.Malau-Aduli. 2019. Enablers and barriers to effective diabetes self- management: A multi- national investigation. PLOS ONE 14(6):e0217771. doi:10.1371/journal.pone.0217771.
- Alasadi,S.A., and W.S.Bhaya. 2017. Review of data preprocessing techniques in data mining. Journal of Engineering and Applied Sciences 12(16):4102–3772.
- Altmann,A., L.Toloşi, O.Sander, and T.Lengauer. 2010. Permutation importance: Acorrected feature importance measure. Bioinformatics 26(10):1340–47. doi:10.1093/bioinformatics/btq134.
- Association,A.D. 2020. 2. Classification and diagnosis of diabetes: Standards of medical care in diabetes—2021. Diabetes Care 44(Supplement_1):S15–33.
- Berbudi,A., N.Rahmadika, A.I.Tjahjadi, and R.Ruslami. 2020. Type 2 diabetes and its impact on the immune system. Current Diabetes Reviews 16(5):442–49. doi:10.2174/1573399815666191024085838.
- Braunwald,E. 2019. Diabetes, heart failure, and renal dysfunction: The vicious circles. Progress in cardiovascular diseases 62(4):298–302. doi:10.1016/j.pcad.2019.07.003.
- Carls,G.S., E.Tuttle, R.-D.Tan, J.Huynh, J.Yee, S.V.Edelman, and W.H.Polonsky. 2017. Understanding the gap between efficacy in randomized controlled trials and effectiveness in real- world use of GLP- 1 RA and DPP- 4 therapies in patients with type 2 diabetes. Diabetes Care 40(11):1469. doi:10.2337/dc16-2725.
- Chatterjee,R., H.-C.Yeh, D.Edelman, and F.Brancati. 2011. Potassium and risk of Type 2 diabetes. Expert Review of Endocrinology & Metabolism 6(5):665–72. doi:10.1586/eem.11.60.
- Choubey,D.K., S.Paul, S.Kumar, and S.Kumar. (2017). Classification of Pima Indian diabetes dataset using naive bayes with genetic algorithm as an attribute selection. Communication and computing systems: proceedings of the international conference on communication and computing system (ICCCS 2016), 451–455.
- Deberneh,H.M., and I.Kim. 2021. Prediction of type 2 diabetes based on machine learning algorithm. International Journal of Environmental Research and Public Health 18(6):3317. doi:10.3390/ijerph18063317.
- Dinh,A., S.Miertschin, A.Young, and S.D.Mohanty. 2019. A data- driven approach to predicting diabetes and cardiovascular disease with machine learning. BMC Medical Informatics and Decision Making 19(1):1–15. doi:10.1186/s12911-019-0918-5.
- Dreiseitl,S., and L.Ohno-Machado. 2002. Logistic regression and artificial neural network classification models: Amethodology review. Journal of Biomedical Informatics 35(5–6):352–59. doi:10.1016/S1532-0464(03)00034-0.
- Echouffo-Tcheugui,J.B., K.M.Narayan, D.Weisman, S.H.Golden, and B.G.Jaar. 2016. Association between prediabetes and risk of chronic kidney disease: Asystematic review and meta- analysis. Diabetic Medicine 33(12):1615–24. doi:10.1111/dme.13113.
- Edwards,C.M., and K.Cusi. 2016. Prediabetes: Aworldwide epidemic. Endocrinology and Metabolism Clinics of North America 45(4):751–64. doi:10.1016/j.ecl.2016.06.007.
- Fisher,A., C.Rudin, and F.Dominici. 2019. All models are wrong, but many are useful: Learning avariable’s importance by studying an entire class of prediction models simultaneously. Journal of Machine Learning Research : JMLR 20(177):1–81.
- Fonti,V., and Belitser,E. 2017. Feature selection using lasso. VU Amsterdam research paper in business analytics 30:1–25.
- FreemanandPennings. 2022. Insulin Resistance. StatPearls Publishing. https://www.ncbi.nlm.nih.gov/books/NBK507839/
- Geurts, P., D. Ernst, and L. Wehenkel. 2006. Extremely randomized trees. Machine Learning 63 (1):3–42. doi:10.1007/s10994-006-6226-1.
- Haghighi,S., M.Amini, Z.Pournaghshband, P.Amini, and S.Hovsepian. 2011. Relationship between gamma- glutamyl transferase and glucose intolerance in first degree relatives of type 2 diabetics patients. Journal of Research in Medical Sciences : The Official Journal of Isfahan University of Medical Sciences 16(2):123–29.
- Haixiang,G., L.Yijing, J.Shang, G.Mingyun, H.Yuanyue, and G.Bing. 2017. Learning from class- imbalanced data: Review of methods and applications. Expert Systems with Applications 73:220–39. doi:10.1016/j.eswa.2016.12.035.
- Hoque,N., D.K.Bhattacharyya, and J.K.Kalita. 2014. MIFS-ND: Amutual information- based feature selection method. Expert Systems with Applications 41(14):6371–85. doi:10.1016/j.eswa.2014.04.019.
- Hossain,M.E., S.Uddin, and A.Khan. 2021. Network analytics and machine learning for predictive risk modelling of cardiovascular disease in patients with type 2 diabetes. Expert Systems with Applications 164:113918. doi:10.1016/j.eswa.2020.113918.
- Jadhav,A., D.Pramod, and K.Ramanathan. 2019. Comparison of performance of data imputation methods for numeric dataset. Applied Artificial Intelligence 33(10):913–33. doi:10.1080/08839514.2019.1637138.
- Jung,C.-H., J.W.Son, S.Kang, W.J.Kim, H.-S.Kim, H.S.Kim, M.Seo, H.-J.Shin, S.-S.Lee, S.J.Jeong, et al. 2021. Diabetes fact sheets in Korea, 2020: An appraisal of current status. Diabetes & Metabolism Journal 45(1):1–10. doi:10.4093/dmj.2020.0254.
- Kalra,S., S.Aggarwal, and D.Khandelwal. 2019. Thyroid dysfunction and type 2 diabetes mellitus: Screening strategies and implications for management. Diabetes Therapy : Research, Treatment and Education of Diabetes and Related Disorders 10(6):2035–44. doi:10.1007/s13300-019-00700-4.
- Ke,G., Q.Meng, T.Finley, T.Wang, W.Chen, W.Ma, Q.Ye, and T.-Y.Liu. 2017. Lightgbm: Ahighly efficient gradient boosting decision tree. Advances in Neural Information Processing Systems 30:3146–54.
- Khan,M.A.B., M.J.Hashim, J.K.King, R.D.Govender, H.Mustafa, and J.Al Kaabi. 2020. Epidemiology of type 2 diabetes – Global burden of disease and forecasted trends. Journal of Epidemiology and Global Health 10(1):107–11. doi:10.2991/jegh.k.191028.001.
- Khan,A., S.Uddin, and U.Srinivasan. 2019. Chronic disease prediction using administrative data and graph theory: The case of type 2 diabetes. Expert Systems with Applications 136:230–41. doi:10.1016/j.eswa.2019.05.048.
- Korean Statistical Information Service (KOSIS). 2021. Status of general health examination subjects and number of individuals undergoing general health examination by age: All. https://kosis.kr/statHtml/statHtml.do?orgId=350&tblId=DT_35007_N002_1&vw_cd=MT_ZTITLE&list_id=350_35007_A001&scrId=&seqNo=&lang_mode=ko&obj_var_id=&itm_id=&conn_path=MT_ZTITLE&path=%252FstatisticsList%252FstatisticsListIndex.do
- Kouitcheu Mabeku,L.B., M.L.Noundjeu Ngamga, and H.Leundji. 2020. Helicobacter pylori infection, arisk factor for type 2 diabetes mellitus: A hospital-based cross-sectional study among dyspeptic patients in Douala-Cameroon. Scientific Reports 10(1):12141. doi:10.1038/s41598-020-69208-3.
- Kumari,V.A., and R.Chitra. 2013. Classification of diabetes disease using support vector machine. International Journal of Engineering Research and Applications 3(2):1797–801.
- Kursa,M.B., A.Jankowski, and W.R.Rudnicki. 2010. Boruta–a system for feature selection. Fundamenta Informaticae 101(4):271–85. doi:10.3233/FI-2010-288.
- Lee,H.-C., S.B.Yoon, S.-M.Yang, W.H.Kim, H.-G.Ryu, C.-W.Jung, K.-S.Suh, and K.H.Lee. 2018. Prediction of acute kidney injury after liver transplantation: Machine learning approaches vs. logistic regression model. Journal of Clinical Medicine 7(11):428. doi:10.3390/jcm7110428.
- Nusinovici,S., Y.C.Tham, M.Y.Chak Yan, D.S.Wei Ting, J.Li, C.Sabanayagam, T.Y.Wong, and C.-Y.Cheng. 2020. Logistic regression was as good as machine learning for predicting major chronic diseases. Journal of Clinical Epidemiology 122:56–69. doi:10.1016/j.jclinepi.2020.03.002.
- Qi,Y. 2012. Random forest for bioinformatics (Ensemble machine learning), 307–23. Springer.
- Qtea,H., and M.Awad. 2021. Using hybrid model of particle swarm optimization and multi- layer perceptron neural networks for classification of diabete. International Journal of Intelligent Engineering and Systems 14 (3):11–22.
- Reddy,S.S.K. 2016. Diabetes. Endocrinology and Metabolism Clinics of North America 45(4): i. doi:10.1016/S0889-8529(16)30110-4.
- Sabanayagam,C., A.Shankar, J.Li, C.Pollard, and A.Ducatman. 2009. Serum gamma-glutamyl transferase level and diabetes mellitus among US adults. European Journal of Epidemiology 24(7):369–73. doi:10.1007/s10654-009-9346-7.
- Schlender,L., Y.V.Martinez, C.Adeniji, D.Reeves, B.Faller, C.Sommerauer, T.Al Qur’An, A.Woodham, I.Kunnamo, A.Sönnichsen, et al. 2017. Efficacy and safety of metformin in the management of type 2 diabetes mellitus in older adults: Asystematic review for the development of recommendations to reduce potentially inappropriate prescribing. BMC Geriatrics 17(1):227. doi:10.1186/s12877-017-0574-5.
- Sharma,T., and M.Shah. 2021. Acomprehensive review of machine learning techniques on diabetes detection. Visual Computing for Industry, Biomedicine, and Art 4(1):30. doi:10.1186/s42492-021-00097-7.
- Souza,C.F.D., J.L.Gross, F.Gerchman, and C.B.Leitão. 2012. Prediabetes: Diagnosis, evaluation of chronic complications, and treatment. Arquivos Brasileiros de Endocrinologia & Metabologia 56(5):275–84. doi:10.1590/S0004-27302012000500001.
- Standl,E., K.Khunti, T.B.Hansen, and O.Schnell. 2020. The global epidemics of diabetes in the 21st century: Current situation and perspectives. European Journal of Preventive Cardiology 26(2_suppl):7–14. doi:10.1177/2047487319881021.
- Tab Ák,A.G., C.Herder, W.Rathmann, E.J.Brunner, and M.Kivimäki. 2012. Prediabetes: A high- risk state for diabetes development. The Lancet 379(9833):2279–90. doi:10.1016/S0140-6736(12)60283-9.
- Tariq,A., K.Okamato, A.Tariq, A.Z.Rosenberg, K.M.Soliman, D.W.Ploth, M.G.Atta, and B.A.McMahon. 2020. Eosinophilia and risk of incident end stage kidney disease. BMC Nephrology 21(1):14. doi:10.1186/s12882-020-1685-3.
- Uddin,S., T.Imam, M.E.Hossain, E.Gide, O.A.Sianaki, M.A.Moni, A.A.Mohammed, and V.Vandana. 2022. Intelligent type 2 diabetes risk prediction from administrative claim data. Informatics for Health & Social Care 47(3):243–57. doi:10.1080/17538157.2021.1988957.
- WHO (World Health Organization). 2022. Noncommunicable diseases. https://www.who.int/news-room/fact-sheets/detail/noncommunicable-diseases
- Wu, Y., Hu, H., Cai, J., Chen, R., Zuo, X., Cheng, H., Yan, D. 2021 Machine learning for predicting the 3-year risk of incident diabetes in Chinese adults Frontiers in Public Health 9 doi:10.3389/fpubh.2021.626331
- Wu,J.-D., D.-L.Liang, and Y.Xie. 2021. Prediabetes and risk of heart failure: The link grows stronger. Cardiovascular diabetology 20(1):112. doi:10.1186/s12933-021-01302-w.
- Xie,Y., B.Bowe, T.Li, H.Xian, Y.Yan, and Z.Al-Aly. 2018. Higher blood urea nitrogen is associated with increased risk of incident diabetes mellitus. Kidney International 93(3):741–52. doi:10.1016/j.kint.2017.08.033.
- Zand,A., K.Ibrahim, and B.Patham. 2018. Prediabetes: Why should we care? Methodist DeBakey Cardiovascular Journal 14(4):289. doi:10.14797/mdcj-14-4-289.
- Zhang,L., and C.Zhan. (2017). Machine learning in rock facies classification: An application of XGBoost. International Geophysical Conference, Qingdao, China, April 17-20.
- Zhou,B., Y.Lu, K.Hajifathalian, J.Bentham, M.Di Cesare, G.Danaei, H.Bixby, M.J.Cowan, M.K.Ali, C.Taddei, et al. 2016. Worldwide trends in diabetes since 1980: Apooled analysis of 751 population-based studies with 4·4million participants. The Lancet 387(10027):1513–30. doi:10.1016/S0140-6736(16)00618-8.
- Zhu,T., K.Li, P.Herrero, and P.Georgiou. 2021. Deep learning for diabetes: Asystematic review. IEEE Journal of Biomedical and Health Informatics 25(7):2744–57. doi:10.1109/JBHI.2020.3040225.
- Zhu,M., J.Xia, X.Jin, M.Yan, G.Cai, J.Yan, and G.Ning. 2018. Class weights random forest algorithm for processing class imbalanced medical data. IEEE Access 6:4641–52. doi:10.1109/ACCESS.2018.2789428.