
 ?Mathematical formulae have been encoded as MathML and are displayed in this HTML version using MathJax in order to improve their display. Uncheck the box to turn MathJax off. This feature requires Javascript. Click on a formula to zoom.
ABSTRACT
This research paper aims to enhance the operation of visual communication systems by incorporating computer image processing technology. The study investigates the potential applications of visual communication systems by utilizing imaging equipment to capture distorted fringe images of height-modulated objects from different angles. Phase information closely associated with the object is then extracted from the images and utilized to obtain the object’s three-dimensional surface topography following calibration. The paper applies multi-frequency phase-shift profilometry and Fourier transforms profilometry to construct further a visual communication system based on computer graphics processing technology. The article contributes to visual communication systems by proposing a novel approach that incorporates computer image processing technology. This approach enhances the performance of visual communication systems, resulting in a more effective means of communication. The study’s experimental analysis demonstrates computer image processing technology’s superiority and ability to enhance the visual communication system’s application. The study’s key findings indicate that computer image processing technology can effectively enhance the effectiveness of visual communication systems. The incorporation of imaging equipment and phase extraction methods leads to the production of accurate three-dimensional surface topography data. Furthermore, multi-frequency phase-shift profilometry and Fourier transform profilometry aid in constructing a visual communication system based on computer graphics processing technology, which leads to an overall enhancement of the visual communication system’s application.
Introduction
The term “visual communication” is mainly divided into two parts: “visual” and “communication.” “Vision” refers to the formation of a specific symbol system through the construction of visual symbols and the organization of visual language to carry information. With the change of media, visual communication has developed from relying solely on traditional print media to relying mainly on the use of screen-based multimedia media. Moreover, the expression of “Vision” is no longer limited to the visual senses, but takes the visual senses as the main object of perception and uses other senses to express synesthesia perception. “communication” refers to the use of media by communicators to convey information to audiences and the results they produce. Due to the changes in the media, it relies on, the connotation of “reach” in “communication” has changed.
The construction process of visual symbols is a process in which communicators transform information into symbols that are convenient for media communication or understanding and acceptance by audiences through their own way of thinking, which is essentially a process of encoding. The purpose of visual symbol construction is to visualize and symbolize information. The clarification of the meaning of visual symbols is the guarantee for the accurate dissemination of information, and the visual performance of visual symbols is the basis for the information to stimulate the audience to react (Chen et al. Citation2021). When symbols convey information and shape the whole of objective things, attention should be paid to the consideration of context and the establishment of context (Martyshkin Citation2020). The effect of visual communication is inseparable from the recognition of visual symbols by the audience in a certain cultural context. In a specific symbolic situation, the audience can accurately interpret the specific meaning of the symbol (Chaudhury et al. Citation2018). The decoding or encoding of visual language is always based on a certain cultural context and way of thinking. In different cultural contexts or symbolic situations, the audience’s cognition and feeling of visual symbols are different. Cultural differences have formed a special psychological perception in the accumulation of history, which makes the communicator and the audience often misunderstand the visual language to some extent if they are in different cultural contexts. The communicator should ensure that the selected visual symbols are consistent with the time and space background and cultural context of the audience as much as possible. If the visual symbols have special meanings, the corresponding symbolic context must be constructed to ensure the accuracy of information transmission (Wang, Song, and He Citation2017).
With the continuous development of science and technology, in recent years, visual communication design has gradually changed from static to dynamic, from the initial two-dimensional picture to the four-dimensional space-time transformation. Wirtheimer once said: “In the process of visual perception, people will always instinctively pursue the overall structure and shape of the things they see, rather than just pay attention to their local shapes” (Cheng et al. Citation2019). Based on this concept, the innovation of visual thinking plays a very important role in promoting visual communication design (Ganesh et al. Citation2020). Visual thinking is to use words and images to visualize, extract, organize and share core information. Our well-known Apple, Coca-Cola and Davos forums are all explorers and practitioners of visual thinking. Not only that, current visual thinking is also in the workplace. An indispensable way of thinking, while exercising one’s own learning ability and analysis ability, it can also steadily improve work efficiency (Chu and Wang, Citation2017). With the continuous development of the times, visual communication now uses visual media as the carrier. How to correctly and fully convey information is the primary problem that designers should think about. “Innovation is the soul of a nation’s progress, and it is also the inexhaustible driving force for a country’s prosperity.” The innovative concept of visual thinking means that designers break through the traditional fixed thinking frame, and introduce new concepts in the guidance of thinking and emotional expression, so as to achieve Personalize, diversify, and internationalize visual communication design, stand firm under the impact of the new technology revolution era, so as to continuously adapt to the changes and development of the environment, making visual communication design more in line with the audience’s aesthetics requirements (Noguchi Citation2018).
The way people perceive things is constantly changing, and visual communication design has gradually highlighted the characteristics of multi-disciplinary, multi-field and multi-perspective. Innovative visual thinking is an important basis for effectively improving the level of design works. Divergent thinking refers to a diffuse mode of thinking in the brain when people think (Villani et al. Citation2018). Under the traditional thinking mode, the thinking of most designers in the design process is too formatted, only considering the design requirements and design content, ignoring the inherent emotional meaning of the work, resulting in poor communication of the works they create (Huang et al. Citation2018). Based on this situation, designers should jump out of the limitations of the inherent thinking mode in the process of design, analyze from multiple perspectives of style, color, theme and pattern, and construct multiple innovative ideas in the process of design. Life is the best teacher. Designers should pay close attention to life, experience the ups and downs, joys, sorrows, sorrows and joys brought by life, and integrate these emotions into creation, so as to design more emotional works (Zhang et al. Citation2021). Not only that, designers can carry out innovative thinking training in a targeted manner before creating to help them get inspiration in the design, infiltrate their unique artistic style into the works, and strengthen the expressive power of the works, so that the audience can pass The works feel the journey of their own minds. Innovative divergent thinking can provide designers with more ideas and solutions. Designers seek common ground while reserving differences in the selection of solutions and integrate unique inspirations to form new design works and express the design theme efficiently and accurately out (Smys and Ranganathan, Citation2019). Possessing divergent and innovative thinking can help designers create unexpected works, achieve unattainable heights, and complete tasks that are difficult for others. Above, good innovative divergent thinking can enhance the flexibility and fluency of the designer’s creation, enhance the emotional meaning in the works, and make the created works more vitality (Papanastasiou, et al., Citation2019).
A technical means of computer processing graphics images. At present, the application of this technical means has to go through two basic processes. One is to transform the image to be studied, convert it into data that can be clearly identified by the computer, and store it in the computer by means of the data. Second, when processing graphics images in a computer, it is necessary to make relevant transformations and processing, and then different calculation methods are used for processing (Li, Yin, and Deng Citation2021). Ordinary graphic images cannot achieve strong visual effects, and it is difficult to arouse people’s spiritual resonance and attract people’s attention. After the computer graphics image processing technology, the pictures are very rich in color and proportion, and the color saturation is very high. The high-quality images that meet the needs of the human eye have a strong visual impact, making people intuitive, fast and effective. Get picture information, impressive and unforgettable (Onishi et al. Citation2019).
The text processing process in graphic images is relatively simple. You only need to use the tools in the toolbar to edit the text online, including the size, color, font, spacing, etc. of the text. In the application of skills, in order to ensure the restoration degree and authenticity of the picture, the text should not be exaggerated excessively, or the text should not be over-painted, and the original meaning of the text will be lost (Xiong et al. Citation2020). In the computer graphics and image processing technology, only basic tools can be used to modify the text to obtain the corresponding text effect. In the process of image processing, in order to achieve the purpose of quick editing and modification, a certain quick editing bar can be used, and at the same time, the desired fonts and text effects can be added to effectively improve the overall visual effect of the image (Y. Wang, Citation2022).
In the field of visual communication design, dynamic images play a pivotal role and are an important form of expression and means of expression. With the continuous development of digital media, the field of visual communication design has become wider, and the manifestations of visual communication design have become more and more complex and rich. The object of visual communication design is the masses, so its design form should be popular, and designers should use an intuitive and simple way to enhance the affinity of design works (Cho, Jeong, and Kim Citation2018). Dynamic images can express images and graphics vividly and concretely, and can effectively attract the attention of viewers. Therefore, in visual communication design, designers can make full use of dynamic images, which are also an indispensable and important means in visual communication design. In the process of design, designers should follow the humanized design concept and fully consider people’s feelings and emotional changes in order to improve the quality of the work (Pour et al. Citation2018).
This paper analyzes the visual communication system’s application and records the object’s deformed fringe image to be measured using imaging equipment. The phase information from the deformed fringe image is then demodulated to obtain the three-dimensional surface topography of the object after calibration. The paper also applies multi-frequency phase-shift profilometry, and Fourier transforms profilometry to the visual communication system to construct a system based on computer graphics processing technology. The experimental study shows that the application of computer image processing technology in the visual communication system is effective and improves the system’s overall effectiveness.
The motivation behind the paper is to improve the effectiveness of visual communication systems by incorporating computer image processing technology. Traditional visual communication systems may have limitations in accurately capturing and analyzing object data, and computer image processing can help overcome these limitations.
The paper’s contribution is the development of a novel visual communication system that combines computer image processing technology with imaging equipment to record distorted fringe images and obtain three-dimensional surface topography of objects. This new system improves the accuracy and effectiveness of visual communication. The paper also applies multi-frequency phase-shift profilometry and Fourier transform profilometry to construct a visual communication system based on computer graphics processing technology.
The paper’s novelty lies in integrating computer image processing technology into visual communication systems to improve their performance. The combination of imaging equipment, phase information demodulation, calibration, and multi-frequency phase-shift profilometry and Fourier transform profilometry is a novel approach that improves the accuracy and effectiveness of visual communication systems. The experimental study also demonstrates the effectiveness of the proposed approach.
The rest of the article is structured into three main sections:
Computer image processing: In this section, the paper delves into the technical details of the computer image processing methods used to enhance the visual communication system. The authors discuss the use of imaging equipment to capture deformed fringe images and the demodulation of phase information to obtain accurate three-dimensional surface topography data. The section also covers multi-frequency phase-shift profilometry and Fourier transform profilometry.
Visual communication system based on computer image processing technology: This section details the development of a visual communication system based on computer image processing technology. The authors describe how the system utilizes the methods discussed in section 2 to enhance the effectiveness of visual communication. They also provide a detailed explanation of the experimental setup and methodology used to evaluate the system’s performance.
Conclusion: The final section of the paper summarizes the main findings and contributions of the study. The authors reiterate the effectiveness of computer image processing technology in enhancing the visual communication system’s application. They also discuss the potential implications of this research and suggest future directions for further investigation.
Computer Image Processing
Principle of Structured Light Measurement
Structured light measurement technology is a technology that uses auxiliary structured light illumination to obtain the three-dimensional topography of an object.
As shown in , a triangular ADC is similar to a triangular PDI, then
Figure 1. Relationship between height and phase of structured light measurement.
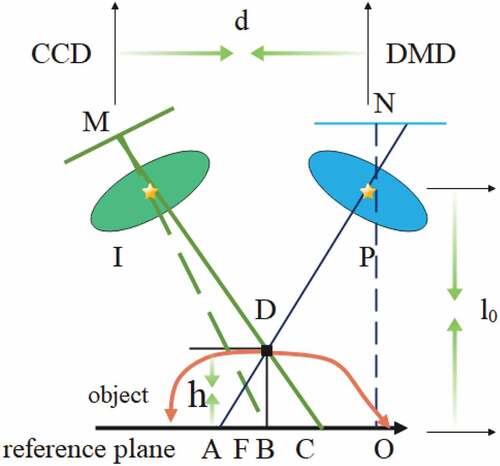
The height distribution h(x,y) is
Because ,
It can be seen from the above formula that the surface topography of the object is closely related to the phase distribution .
The Principle of Multi-Frequency Phase-Shift Profilometry
Phase-shift profilometry projects structured light patterns with a certain phase difference onto the surface of the object to be measured, and obtains the phase value of each point according to the intensity distribution of each structured light pattern captured. The calculation formula of phase-shift profilometry comes from phase-shifting interferometry PSI. Based on the principle of least squares, Morgan deduces the packet phase calculation formula of N-step equidistant phase-shifting interferometry. On the basis of Morgan, Greivenkamp et al. deduced a more general formula for calculating the wrapping phase of N-step phase-shifting interferometry.
For the common N-step phase-shift method with equal phase-shift steps, the expression of the intensity distribution of the nth sinusoidal fringe pattern is as follows:
The above EquationEq (4)(4)
(4) contains three final quantities, which are the background intensity
of the stripes, the modulation intensity
and the wrapping phase
.
is the phase shift amount, and
is the fringe number, and N is the total number of fringes. To obtain the wrapping phase
, at least three equations are required. According to the principle of least squares, the expression of
is:
Commonly used are 3-step phase shift method and 4-step phase shift method. For the 3-step phase-shift method with a phase-shift spacing of , the formula commonly used is:
Its wrapping phase is:
For the 4-step phase shift method with a phase shift interval of , the commonly used formula is:
Its wrapping phase is:
If it is assumed that the fringe spacing of the low-frequency fringes is , the absolute phase is
, the fringe spacing of the high-frequency fringes is
, and the wrapping phase is
, then the order of the high-frequency fringes is:
In the formula, the subscripts L and H represent low frequency and high frequency, respectively, and Round represents rounding. The absolute phase of the high frequency fringes is:
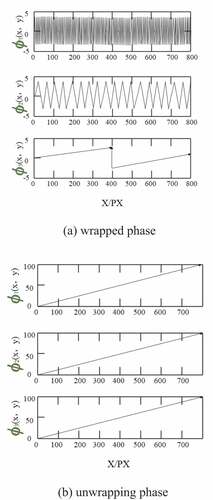
The multi-frequency phase shift method requires that the equivalent frequency of the lowest frequency fringe is less than or equal to 1. If it is assumed that the width of the fringe pattern is 800px and the periods are 12, 100 and 800px, respectively, shows the wrapped phase of the multi-frequency phase-shift profilometry, and shows the corresponding lateral intensity distributions of the wrapped and unwrapped phases. For the fringes with the lowest frequency, since there is only one fringe period, when the wrapping phase is less than 0, the corresponding unwrapping phase can be obtained by directly adding .
Figure 2. Wrapping phase of multi-frequency phase-shift profilometry.
Figure 3. Lateral intensity distribution.
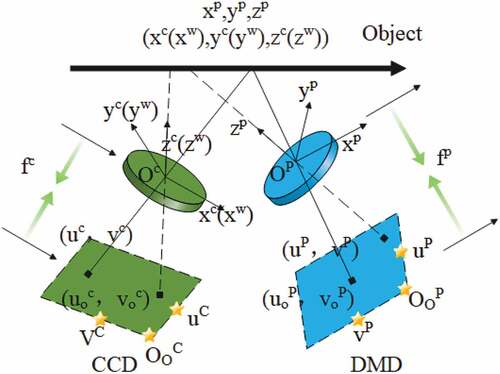
The calibration of traditional structured light measurement is based on the reference plane. By calibrating the phase distribution of the reference plane at different heights, the relationship between height and phase is obtained by fitting. This calibration method can only calibrate the height direction. In order to solve the above problems, the literature proposes a new calibration algorithm. The algorithm regards the projector as an inverse camera, and the pixel coordinates of the camera image. Moreover, it subtly transforms the calibration of the projector into a full-fledged camera calibration, thereby transforming the single-camera structured light measurement system into a classic binocular vision system.
Cameras and projectors use the classic pinhole imaging mode. As shown in , and
are the pixel coordinates of the camera and projector imaging planes, respectively, and
and
are the camera and projector coordinate axes, respectively.
is the world coordinate axis,
and
are the principal point coordinates of the imaging plane of the camera and the projector, respectively, and
and
are the focal lengths of the camera and the projector, respectively.
Figure 4. Imaging model of structured light system.
The imaging models of cameras and projectors can be described as:
Among them, and
are the scaling factors of the camera and the projector, respectively, and
and
are the extrinsic parameter matrices of the camera and the projector, respectively, where
and
are the orthogonal unit rotation matrices of
,
and
are the translation vectors of
,
and
are the internal parameter matrices of the camera and the projector, respectively, and
In the formula, and
are the ratio of the camera focal length
in the x- and y-axis directions to the physical scale of a single pixel of the camera chip, respectively.
and
are the ratio of the projector focal length
in the x and y axis directions to the physical dimension of a single pixel of the projector DMD chip, respectively.
In addition, the actual imaging lens has optical distortion, mainly including radial distortion and tangential distortion. Ignoring the third-order radial distortion, the radial distortion model is
In the formula, (x, y) and represent the image coordinates before and after distortion correction, respectively, and
is the distance from the main point of the imaging system. The tangential distortion model is:
After the phase unwrapping calculation, the absolute phase distributions in the transverse and longitudinal directions can be obtained. According to the absolute phase values of the two directions, the projector image coordinate corresponding to the feature point circle center
of the calibration plate image of the camera chip can be determined.
is the pixel period of the stripes corresponding to the densest stripes, and
is the absolute phase distribution corresponding to the feature point
of the camera calibration plate under the vertical stripes.
is the corresponding absolute phase distribution under the horizontal stripes, the feature point
is the sub-pixel accuracy, and the values of
and
are obtained by bilinear interpolation.
For any viewing angle measurement, when projecting the vertical fringes, the absolute phase of the object is obtained after phase unwrapping and phase correction. There are 7 unknown quantities
and
in the system calibration calculation. According to formulas 12, 13 and 20, 7 equations can be established, and the actual size distribution
of the object can be obtained by solving.
In the formula, is the element of the calibration transformation matrix
of the camera,
is the element of the calibration transformation matrix
of the projector,
. Similarly, when the horizontal stripes are projected, the actual size distribution
of the object is:
Fourier Transform Profilometry Principle
When the projected fringes are sinusoidal fringes, the intensity expression of the fringe image recorded by the camera is:
In the formula, is the spatial frequency of the fringes,
, and the above formula is transformed to obtain:
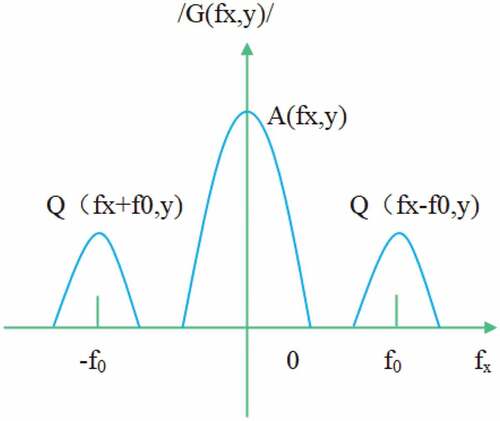
In the formula, , * represents the conjugate complex number, and the Fourier transform is performed on the above formula along the x direction to obtain:
If it is assumed that and
vary slowly compared to frequency
, then ideally under the modulation of
, the spectra
and
will be completely separated. At this time, the schematic diagram of the spectral distribution of
is shown in . The window function is selected to separate out the spectral components
, and
is obtained after inverse transformation. By performing the same operation on the reference plane fringes,
is obtained, and
is the modulation degree of the reference plane fringes,
is the phase distribution of the reference plane fringes, then the phase difference
is:
Figure 5. Spectrum of the sinusoidal fringe plot.
Theoretically, according to formula 3, the phase difference is substituted into the phase-to-height conversion relationship, and the height distribution
of the liquid film can be obtained. However, the structural parameters of the structured light measurement system are difficult to accurately measure, and the fitting relationship between the two is usually obtained by calibrating the relationship between the z-direction height and the phase difference.
and
can be fitted by the following relation:
For the height calibration in the z-direction, the precision stage is first adjusted to a certain height position as the reference plane, and then adjusted to multiple different positions for measurement and calibration. Through the least squares method, the optimal values of the coefficients and
are obtained.
Visual Communication System Based on Computer Image Processing Technology
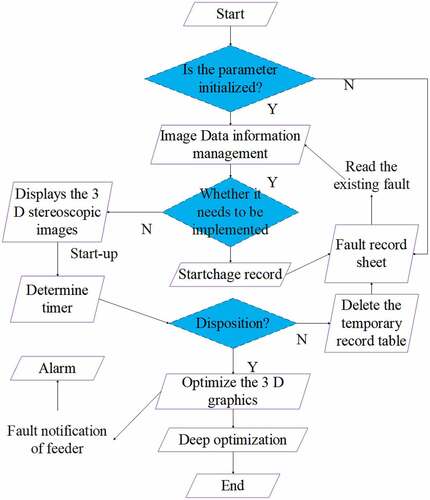
After the image storage module completes the storage of the image, the image control module controls the stored image. The interface of the image control module is shown in .
Figure 6. Visual communication automation digital system software process.
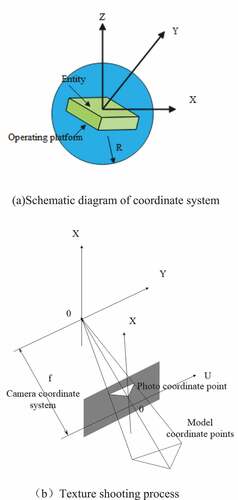
In actual processing, the following three situations occur. The first is that there are a variety of texture texels in the texture space, in which the minimum unit of two-dimensional texture corresponds to a 3D model pixel. The second is that each texel corresponds to a plurality of 3D model pixels. Finally, each texel corresponds to a 3D model pixel. For these three cases, targeted treatment must be implemented separately. The texture is obtained by shooting, so coordinate conversion is an important issue. The texture shooting process and coordinate system are shown in .
Figure 7. Schematic diagram of coordinate system and texture shooting process.
In order to verify the effectiveness of the visual communication automation digital system based on CAD assistance technology designed in this paper, the effectiveness of this system is verified by comparing it with the traditional system. In order to compare the visual communication effect of the system in this paper and the traditional system, a comparative experiment is carried out. In order to make the experimental results prominent and representative, a numerical comparison is used for comparison. The actual visual communication results and the visual communication results of the two systems are shown in .
Figure 8. Experimental simulation results.
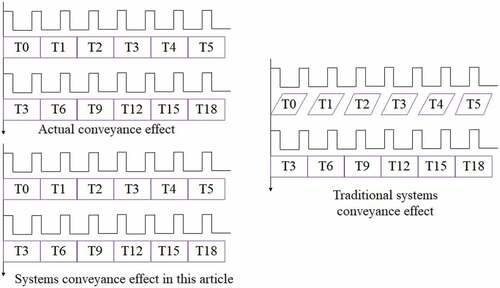
The observation presented in suggests that the visual communication system proposed in this research paper yields an outcome that closely resembles the actual communication effect. This finding highlights the effectiveness of the proposed system in accurately conveying visual information. In contrast, the traditional digital system’s visual communication effect was markedly different from the actual communication effect. This finding highlights the limitations of traditional digital systems in accurately reproducing visual information and emphasizes the need for innovative solutions such as the computer image processing technology proposed in this study. These results have important implications for the development of visual communication systems and underscore the potential benefits of incorporating advanced technologies. Future research could focus on further refining and optimizing the proposed system to enhance its effectiveness and expand its applicability to various visual communication contexts.
On the basis of the above research, the application effect of the computer image processing in this paper in the visual communication system is evaluated, and the evaluation results are shown in .
Table 1. Application effect of computer image processing in visual communication system.
From the above experimental research, it can be seen that the application effect of computer image processing in the visual communication system is good, and the visual communication effect can be effectively improved.
The visual communication effect of the system proposed in the research paper is similar to the actual communication effect, whereas the visual communication effect of the traditional digital system is quite different from the actual communication effect. This observation suggests that the proposed algorithm is more effective in accurately conveying visual information compared to the traditional digital system. As a result, the proposed algorithm can be deemed superior to the traditional method, as it yields an outcome that more closely resembles the actual communication effect. Therefore, the proposed algorithm exceeds the traditional method based on the visual comparison presented in . However, it is important to note that the comparison is limited to the specific context and parameters of the study, and further investigation is necessary to evaluate the proposed algorithm’s effectiveness in various other scenarios.
Conclusion
The graphics in the basic elements of the visual identity system include logo graphics and auxiliary graphics. Among them, because of its particularity, the logo needs to be considered a lot in the design and production. It can only express the concept of a company or brand with simple graphics in a limited space. There are many issues to consider when designing, for example, graphics are usually concise, easy to recognize and remember, suitable for various occasions, and zooming in or out will not affect recognition. Moreover, the colors should not be used too much to avoid clutter, and the graphics should be avoided as much as possible to facilitate future registration and so on. Such restrictions make the sign very symbolic and relatively less variable. This paper combines computer image processing technology to analyze the application of visual communication system.
The findings of this research paper demonstrate the potential of computer image processing technology to improve the application of visual communication systems, leading to enhanced communication quality and better brand promotion outcomes. Future research could explore the implementation of advanced computer image processing techniques to further enhance the visual communication system’s performance, particularly in addressing the challenges associated with logo design in the context of limited space and scalability.
Future research could investigate the incorporation of computer image processing technology in other aspects of visual identity design, such as color selection and typography, to provide a more comprehensive solution for enhancing the effectiveness of visual communication systems. Such research could contribute to advancing the field of visual communication and ultimately lead to the development of more effective branding strategies for businesses and organizations.
Disclosure statement
No potential conflict of interest was reported by the authors.
References
- Chaudhury, A., C. Ward, A. Talasaz, A. G. Ivanov, M. Brophy, B. Grodzinski, J.L. Barron, 2018. Machine vision system for 3D plant phenotyping. IEEE/ACM Transactions on Computational Biology and Bioinformatics 16 (6):2009–1263. doi:10.1109/TCBB.2018.2824814.
- Chen, Y., K. Feng, J. Lu, and Z. Hu. 2021. Machine vision on the positioning accuracy evaluation of poultry viscera in the automatic evisceration robot system. International Journal of Food Properties 24 (1):933–43. doi:10.1080/10942912.2021.1947315.
- Cheng, L., B. Song, Y. Dai, H. Wu, and Y. Chen. 2019. Mobile robot indoor dual Kalman filter localisation based on inertial measurement and stereo vision. CAAI Transactions on Intelligence Technology 2 (4):173–81. doi:10.1049/trit.2017.0025.
- Cho, Y., J. Jeong, and A. Kim. 2018. Model-assisted multiband fusion for single image enhancement and applications to robot vision. IEEE Robotics and Automation Letters 3 (4):2822–29. doi:10.1109/LRA.2018.2843127.
- Chu, H. H., and Z. Y. Wang. 2017. A study on welding quality inspection system for shell-tube heat exchanger based on machine vision. International Journal of Precision Engineering and Manufacturing 18 (6):825–34. doi:10.1007/s12541-017-0098-0.
- Ganesh, V. N., S. G. Acharya, S. Bhat, and S. V. Yashas. 2020. Machine vision robot with real time sensing. Journal of Advancements in Robotics 1 (3):30–34.
- Huang, S., K. Shinya, N. Bergström, Y. Yamakawa, T. Yamazaki, and M. Ishikawa. 2018. Dynamic compensation robot with a new high-speed vision system for flexible manufacturing. International Journal of Advanced Manufacturing Technology 95 (9–12):4523–33. doi:10.1007/s00170-017-1491-7.
- Li, J., J. Yin, and L. Deng. 2021. A robot vision navigation method using deep learning in edge computing environment. EURASIP Journal on Advances in Signal Processing 1 (1):1–20. doi:10.1186/s13634-021-00734-6.
- Martyshkin, A. I. 2020. Motion planning algorithm for a mobile robot with a smart machine vision system. Nexo Revista Científica 33 (02):651–71. doi:10.5377/nexo.v33i02.10800.
- Noguchi, N. 2018. Agricultural vehicle robot. Journal of Robotics and Mechatronics 30 (2):165–72. doi:10.20965/jrm.2018.p0165.
- Onishi, Y., T. Yoshida, H. Kurita, T. Fukao, H. Arihara, and A. Iwai. 2019. An automated fruit harvesting robot by using deep learning. Robomech Journal 6 (1):1–8. doi:10.1186/s40648-019-0141-2.
- Papanastasiou, S., N. Kousi, P. Karagiannis, C. Gkournelos, A. Papavasileiou, S. Dimoulas, K. Makris, S. Koukas, G. Michalos, and S. Makris. 2019. Towards seamless human robot collaboration: Integrating multimodal interaction. International Journal of Advanced Manufacturing Technology 105 (9):3881–97. doi:10.1007/s00170-019-03790-3.
- Pour, A. G., A. Taheri, M. Alemi, and A. Meghdari. 2018. Human–robot facial expression reciprocal interaction platform: Case studies on children with autism. International Journal of Social Robotics 10 (2):179–98. doi:10.1007/s12369-017-0461-4.
- Smys, S., and G. Ranganathan. 2019. Robot assisted sensing control and manufacture in automobile industry. Journal of ISMAC 1 (03):180–87. doi:10.36548/jismac.2019.3.005.
- Villani, V., F. Pini, F. Leali, C. Secchi, and C. Fantuzzi. 2018. Survey on human-robot interaction for robot programming in industrial applications. IFAC-Papersonline 51 (11):66–71. doi:10.1016/j.ifacol.2018.08.236.
- Wang, Y. 2022. On theoretical foundations of human and robot vision. Learning. 4 (1): 61–86.
- Wang, D., H. Song, and D. He. 2017. Research advance on vision system of apple picking robot. Transactions of the Chinese Society of Agricultural Engineering 33 (10):59–69.
- Xiong, Y., Y. Ge, L. Grimstad, and P. J. From. 2020. An autonomous strawberry‐harvesting robot: Design, development, integration, and field evaluation. Journal of Field Robotics 37 (2):202–24. doi:10.1002/rob.21889.
- Zhang, H., M. Li, S. Ma, H. Jiang, and H. Wang. 2021. Recent advances on robot visual servo control methods. Recent Patents on Mechanical Engineering 14 (3):298–312. doi:10.2174/2212797613999201117151801.