
 ?Mathematical formulae have been encoded as MathML and are displayed in this HTML version using MathJax in order to improve their display. Uncheck the box to turn MathJax off. This feature requires Javascript. Click on a formula to zoom.
ABSTRACT
The intricate and unpredictable nature of stock markets underscores the importance of precise forecasting for timely detection of downturns and subsequent rebounds. Various factors, including news, rumors surrounding events or companies, market sentiments, and governmental policies, can significantly impact stock prices. Nevertheless, the precision of current methods remained insufficient until the adoption of artificial neural network architectures like long short-term memory (LSTM). The aim of this study is to create a precise AI-driven platform tailored for both the Indian and international stock markets. This platform is designed to assist retail investors in navigating digital environments by employing various LSTM algorithms. Its primary goals include predicting stock price fluctuations, pinpointing potential investment prospects, and refining trading strategies. The application aims to leverage advanced LSTM algorithms to analyze historical market data, recognize patterns, and provide real-time insights. It will take past price and process it through LSTM algorithms to take a logical decision. In the quest to broaden retail participation in the capital markets, the effort is to develop an application for novice investors who either have no time in research or are the victims of financial mis-selling and enable them to leverage the technology to their advantage.
Introduction
Stocks, also known as shares or equity, represent ownership in a corporation. When anyone buys stocks, the person is essentially buying a small piece of ownership in that company. Investors purchase stocks with the anticipation that the company will expand and accrue greater value over time, enabling them to vend their shares at an elevated price in the future. Stock prices represent the present market worth of a company’s stock and undergo changes during the trading day influenced by factors like company performance, market dynamics, economic indicators, and investor outlook. Stock price prediction involves forecasting the future price. Investors use various techniques and models to predict stock prices, aiming to make informed decisions about buying, selling, or holding stocks. Methods used for stock market prediction are technical analysis, fundamental analysis, quantitative analysis, sentiment analysis, econometric modeling, and event studies. The technical analysis methodology entails the examination of historical market data, focusing on price and volume, to predict forthcoming price fluctuations. Conversely, fundamental analysis delves into evaluating a company’s financial standing, performance, and external influences impacting its operations. Quantitative analysis entails the utilization of mathematical and statistical models to scrutinize past data, aiming to discern patterns or correlations that could aid in forecasting future stock prices. This method includes regression analysis, time-series analysis, and financial modeling. Sentiment analysis involves gauging public sentiment and investor emotions toward a stock or the market as a whole. Econometric models utilize economic principles and statistical methods to predict stock prices, relying on macroeconomic indicators. Traditional methods continue to play a significant role in financial analysis and forecasting. Each method has its strengths and limitations, and combining multiple approaches can provide more robust predictions. Some of the methods suggested for stock market prediction have been discussed in this section.
In recent years, machine-learning methods (both shallow learning and deep learning) have been used for stock price prediction. Several shallow learning models such as ANN, SVM, RF, and Naıve Bayes has been used for stock price prediction and stock price index movement, according to Patel et al. (Citation2015). The study in predicting the direction of stock market index movement using an optimized ANN model has been suggested by Qiu, Song, and Wang (Citation2016) that explores the Japanese stock market index’s daily price prediction. The study proposes using the GA technique to optimize the ANN model’s weights and biases and predict the index’s daily closing price movement. The study by Ticknor (Citation2013) introduces a Bayesian regularized ANN designed for forecasting financial market trends utilizing daily market prices and technical indicators. Empirical analysis stock market prediction via extreme learning machine (ELM) by Li et al. (Citation2016) introduces a trading signal mining platform utilizing ELM to forecast stock price movements based on quantitative market data modeling. The study described by Ren, Wu, and Liu (Citation2018) integrates sentiment analysis into a machine learning framework employing support vector machine. This model aids investors in making informed decisions and can serve as a leading indicator of stock market trends.
Other than shallow learning methods, deep learning methods are also used for stock price prediction. A recurrent neural network called LSTM has been used to predict stock value using market data, according to Pramod and Shastry (Citation2020). Neural networks such as multi-layer perceptron, RNN, LSTM, and CNN for predicting stock prices based on historical data have been proposed by Hiransha et al. (Citation2018). Using data from two stock markets, the study found that CNN outperformed other models. The study by Banerjee and Mukherjee (Citation2022) explores the use of non-parametric paradigms like MLP, LSTM, GRU, BLSTM, and BGRU on three NSE listed banks to predict short-term stock prices. According to Shaban, Ashraf, and Slama (Citation2024), a novel system has been introduced that encompasses two primary stages. The initial stage involves identifying and handling missing values, selecting relevant features, and normalizing the data. The subsequent stage employs a predictive model comprising LSTM combined with bidirectional gated recurrent unit. A study by Qiao, Chen, and Qiao (Citation2022) proposes a method that utilizes LSTM models optimized during in-sample training and tested on out-of-sample periods through a rolling window technique.
The study of short-term stock market price trend prediction using a comprehensive deep learning system by Shen and Shafiq (Citation2020) aims to predict short-term price trends using feature engineering, financial domain knowledge, and prediction algorithms. A stock price prediction method has been suggested by Ji, Wang, and Yan (Citation2021), incorporating the LSTM neural network algorithm alongside the dual moving average crossover algorithm. The approach by Awad, Elkaffas, and Fakhr (Citation2023) presents a method for forecasting stock market trends by combining ANN, LSTM, natural language processing (NLP), and deep Q network (DQN) methodologies. The model can forecast the opening stock value for the following day, demonstrating its predictive prowess. Moghar and Hamiche (Citation2020) explored the utilization of RNN and LSTM for predicting future stock market values, aiming to assess the accuracy of machine learning algorithms and the potential for model enhancement over time. The research detailed by Roondiwala, Patel, and Varma (Citation2017) introduces a recurrent neural network and LSTM methodology for forecasting stock market indices, addressing the challenge of stock price prediction for investors and traders through comprehensive steps.
A study by Zhang et al. (Citation2019) suggested an innovative generative adversarial network (GAN) architecture employing a multi-layer perceptron (MLP) as a discriminator and LSTM as a generator for predicting stock closing prices. Fathali, Kodia, and BenSaid (Citation2022) used deep learning networks to predict stock prices on the Indian National Stock Exchange. RNN, LSTM, and CNN have been used to analyze NIFTY 50 stock prices. Zou et al. (Citation2024) proposed a deep reinforcement learning based stock trading system using cascaded LSTM to capture hidden information in daily stock data. The model uses a cascaded structure with two stages of deep LSTM networks to extract time-series features from daily stock data. To reduce investor risk, Song et al. (Citation2024) searched for more accurate forecasting models. Key forecasting models used include econometrics, machine learning, and deep learning models. Deep learning models, particularly LSTM models, have shown superior performance in processing non-linear data. Botunac, Bosna, and Matetić (Citation2024) explored the use of LSTM neural networks in traditional trading strategies to improve prediction accuracy and trading efficiency in volatile stock markets. It predicts market movements in the S&P 500 market from 1992 to 2015, demonstrating their efficiency and potential in financial forecasting. The finance market is increasingly attracting interest in stock market forecasting due to its ability to provide reliable predictions.
The identified gaps in the above discussed methods of stock market prediction and possible direction of research can be outlined as follows:
Lack of incorporated features: The current investment and trading systems provided by brokers and financial institutions do not incorporate the proposed features and capabilities. With the advent of AI, NLP and the popularity of advanced algorithms, there is an opportunity to fill this void by developing a new application.
Empowerment of retail investors: Novice investors often face challenges due to lack of time for research or falling victim to financial mis-selling. The objective is to empower retail investors by providing a reliable AI-based tool that facilitates informed decision-making, mitigates risks, and assists in making sound trading and investment choices in the dynamic stock market.
Utilization of technology for decision-making: The abstract highlights the need to leverage technology to counter the impact of various factors affecting stock prices, such as news, rumors, market sentiments, and government policies. By utilizing different LSTM algorithms to analyze historical data and make logical investment decisions, the application aims to provide a solution to address the short-term impact of external factors on stock prices.
Bridging the gap in research for novice investors: Novice investors may lack the resources or time for in-depth research, and there is a need for a tool that simplifies the investment process for them. The application aims to bridge this gap by leveraging technology to provide a user-friendly interface and decision-making support for novice investors, ultimately broadening retail participation in the Indian Capital Markets.
Consideration of external factors in decision-making: The the stock market can be influenced by various external factors, such as news, rumors, market sentiments, and government policies. Existing systems may not adequately consider these factors in decision-making. The proposed application seeks to address this gap by processing historical market data through different LSTM algorithms to make logical investment decisions, considering a broader range of factors that impact stock prices in the short term.
Lack of comparison in LSTM models: To reflect the ongoing quest for refining and optimizing LSTM models, comparison of different models needs to be performed to identify the most effective configuration. Performing a comprehensive comparison allows for the enhancement of predictive accuracy and efficiency, which is crucial for effective stock price prediction.
The goal of the work is to empower retail investors with a reliable tool that enhances decision-making, mitigates risks, and facilitates informed trading and investment choices in the dynamic landscape of stock market. The main object of this work is to compare different models of LSTM allowing for finding the optimum architecture and hyper-parameter combination that maximizes performance for a stock price, ultimately enhancing the predictive accuracy and efficiency of LSTM-based models. The paper is organized as follows: section 2 describes the techniques used, section 3 discusses the proposed method, section 4 shows the results, section 5 presents the discussions of the proposed method and section 6 provides the conclusion of the work.
Techniques Used
In this work, a more complex machine learning model over simpler ones has been used. The reason for choosing a complex model is due to the following reasons. If the phenomenon being studied exhibits nonlinear relationships, interactions between multiple variables, or complex temporal patterns, simpler models like linear regression or basic time-series models may not be able to capture these nuances effectively. There are performance limitations of simpler models compared to more complex ones. Complex machine learning models, such as neural networks or ensemble methods, often have the capacity to learn intricate patterns and relationships in the data, leading to superior predictive performance in many cases. More complex models are better equipped to handle nonlinear relationships in the data. Linear regression and basic statistical models assume linear relationships between variables, which may not hold true in many real-world scenarios. More complex models can automatically extract relevant features from the data, whereas simpler models may require manual feature engineering, which can be time-consuming and may not capture all relevant information. While simpler models are often easier to interpret, they may sacrifice predictive accuracy. In some cases, the predictive power of more complex models outweighs the loss of interpretability, especially when the primary goal is accurate prediction. If the goal is to push the boundaries of prediction accuracy or to address a particularly challenging problem, benchmarking against basic models may not adequately reflect the potential of more advanced approaches.
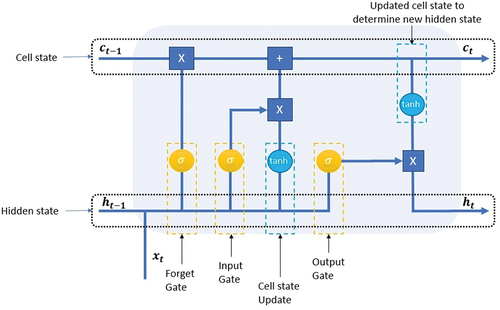
In this work, LSTM network has been used for stock price analysis. LSTM is designed to process sequential data, such as time series, audio, or text. Important components of LSTM include the input gate, forget gate, and output gate. The structure of an LSTM cell, with its components, is illustrated in . The LSTM architecture integrates cell states and gates to filter information within neural networks, with gates identified by an X to signify the retention of pertinent data while discarding extraneous information.
Figure 1. LSTM cell.
Vanilla LSTM
A Vanilla LSTM is the foundational form of an LSTM, belongs to the family of recurrent neural networks (RNNs). LSTMs handle sequential data, managing long-term connections and dealing with the vanishing gradient issue found in older RNNs. In simple terms, “vanilla” refers to the basic, unmodified version of the LSTM architecture. It comprises memory cells and gates, including input, forget, and output gates that control information flow, letting the network remember or forget data selectively. These standard LSTMs are extensively used in various applications requiring sequence processing, such as natural language processing, time-series forecasting, and speech recognition. They are appreciated for their capacity to comprehensively analyze and handle complex dependencies within sequences.
Stacked LSTM
A Stacked LSTM is a neural network setup involving multiple LSTM layers stacked sequentially. Each layer contains LSTM units and works together to process data at varying levels of complexity. This layered structure allows the network to learn hierarchical representations of input information. As data moves through these layers, they capture different levels of detail, from basic patterns in the lower layers to more intricate relationships in the higher ones. This architecture helps the network abstract and comprehends complex features within sequential data, making it useful in tasks like natural language processing, sentiment analysis, and time-series forecasting. However, while stacked LSTMs excel in capturing intricate patterns, creating and training deep architectures like these requires careful management of computational resources, gradient issues, and the risk of over-fitting.
Single Step LSTM
A Single-Step LSTM is a type of LSTM model that predicts or generates output step-by-step, relying on the input provided at each time step. It receives data representing either a single data point or a sequence of features at each specific moment. After processing the input at a given time step, it produces a prediction based on learned patterns and dependencies from the input sequence up to that point. This process iterates for subsequent time steps, using previous predictions (or ground truth in training) as input for the next step. It is widely used in tasks like time-series forecasting, focusing on predicting the next time step’s value from historical data. By minimizing the difference between predicted and actual values through various optimization techniques, these models learn and capture temporal patterns for accurate single-step predictions.
Multi-Step LSTM
A Multi-Step LSTM is a specialized type of LSTM model that predicts multiple future time steps, differing from single-step LSTMs that predict just one future step. Like single-step models, multistep LSTMs take input data at each time step and process it to generate predictions for several consecutive future time steps. These predictions build on learned patterns and dependencies from the input sequence. The model iterates through future steps, generating a sequence of predictions step-by-step, using prior predictions as input for subsequent ones. These models find use in scenarios requiring predictions further into the future, such as multistep time-series forecasting. They aim to capture long-term dependencies in data to produce accurate predictions for multiple future steps and can be trained using diverse optimization techniques to enhance prediction accuracy by learning complex temporal relationships.
Bidirectional LSTM
A Bidirectional LSTM is a recurrent neural network that processes sequential data by using both past and future information from the input sequence. It has two parts: a Forward LSTM that works from start to finish, capturing patterns in a forward direction, and a Backward LSTM that processes the sequence in reverse, capturing future-related details. Combining these components allows the bidirectional LSTM to comprehend context from both past and future perspectives at each step of the sequence. This structure is advantageous for applications such as natural language processing (sentiment analysis, named entity recognition), machine translation, and speech recognition, where comprehending information bidirectionally is essential. By leveraging both past and future information, bidirectional LSTMs create representations that consider the entire sequence, improving the network’s ability to model and predict based on a comprehensive understanding of the data.
Multi-Layer Bidirectional
Multi-layer Bidirectional networks combine multiple layers and bidirectional processing. Layers of bidirectional processing units, such as Bidirectional LSTMs, are stacked to examine data in both forward and backward directions. By doing so, these networks gather information from preceding and subsequent contexts within each layer, establishing a hierarchical comprehension of the data. This stacking enables them to learn complex patterns and relationships within sequences, making them useful in tasks like natural language processing and speech recognition, where understanding intricate sequential patterns is crucial.
Multivariate Multi-Step LSTM
Multivariate Multi-Step LSTM models forecast multiple future points in multivariable time-series data. They handle datasets with multiple interrelated variables and predict several consecutive future time steps rather than just one. These models utilize LSTM networks for their capacity to understand sequences and patterns in multivariate data. Trained on historical multivariable time series, they use past observations to predict future sequences. Valuable in finance, energy, weather forecasting, and similar fields, these models leverage the LSTM’s capabilities to predict multiple future points accurately by capturing complex relationships across variables.
The Encoder-Decoder LSTM
The Encoder-Decoder LSTM, also called Seq2Seq, has two parts: an encoder and a decoder. The encoder condenses input sequences into a fixed-size context vector, capturing essential features. This context vector acts as a summary for generating the output sequence. The decoder uses this context to produce the output step-by-step, and during training, it learns to map inputs to outputs. These models handle tasks with varying input and output lengths, like machine translation, by summarizing input information and generating variable-length outputs based on this summary.
ConvLSTM
ConvLSTM merges CNN with LSTM architecture to process spatiotemporal data effectively. It applies convolutional operations like CNNs to extract spatial features from input sequences and uses LSTM’s memory cells to capture temporal patterns. This combination allows ConvLSTM to process spatiotemporal information efficiently, making it useful for tasks like video analysis, weather prediction, and motion recognition. These networks excel in scenarios requiring both spatial and temporal understanding, enabling them to model intricate patterns in data effectively.
CNN-LSTM
CNN-LSTM is a hybrid neural network combining CNNs and LSTM networks. It is adept at processing data sequences with spatial and temporal dependencies. CNNs focus on spatial hierarchies, extracting patterns from input data, often used in image recognition. LSTMs capture temporal relationships in sequences, preserving long-term dependencies. In CNN-LSTM, CNNs extract spatial features, passing the output to LSTMs for temporal processing. This architecture suits tasks like video analysis, action recognition, and spatiotemporal forecasting (e.g., weather prediction). By leveraging CNNs’ spatial feature extraction and LSTMs’ temporal understanding, CNN-LSTM excels in handling data sequences with both spatial and temporal complexities, proving useful in comprehensive spatio-temporal data analysis.
Proposed Method
The proposed method for predicting stock market trends involves several steps, including acquiring stock price data, preprocessing the data, selecting relevant features, constructing the prediction model, and evaluating its effectiveness as shown in . Each of the steps will be described in the following subsections.
Figure 2. Flow diagram of the proposed method.
Datasets Used
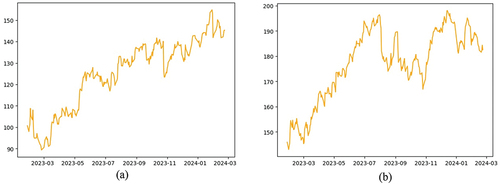
The present study employed the Nifty data-set spanning from January 1 to May 31 (Yahoo Finance Citation2023) for experimentation purposes. NIFTY, short for the National Stock Exchange’s top 50 companies by Market Cap, represents the marketplace for exchanging equities, bonds, and other financial instruments in India. It serves as a benchmark index on the NSE (National Stock Exchange) in India for prominent firms, encompassing 50 stock exchanges across 23 economic sectors. Yahoo Finance is a reliable platform for accessing NIFTY data online, providing a wide range of financial news and data, including stock prices, market indices, and exchange rates. Python, along with the Yahoo Finance API, is employed to retrieve and download NSE data for specific time period intervals by Garita (Citation2021). Predictions regarding price are made based on a time window comprising the preceding 20 days’ prices, where the input consists of the prices of the last 20 days, and the output indicates the price for the subsequent day. Of all the data, 80% of the data is allocated for training purposes, while the remaining 20% is reserved for testing. shows the stock price of Google and Apple for 1 year. From the figure, it can be observed that there are no patterns available in the data to predict the future price of the stock.
Figure 3. Input data considered for the work (a) Google (b) Apple.
Selection of Input
The closing price of a stock is considered important in predicting future stock prices due to several reasons as discussed here. First one is the temporal relationship. The closing price indicates the last traded price of the day, forming a part of the sequential nature of stock price movement. Its historical sequence provides valuable information on how the price has evolved over time. Second one is that it is an indicator of investor sentiment. The closing price is influenced by various factors such as market sentiment, investor behavior, news, and company performance throughout the trading day. As the market approaches closure, the closing price reflects the sentiment of investors and traders for that day, encapsulating their reaction to the day’s events. Third one is that it helps in technical analysis. In technical analysis, the closing price is frequently used to derive various indicators and signals like moving averages, Bollinger Bands, and momentum oscillators. These indicators help identify trends, volatility, and potential entry or exit points in the market.
The model learns from the sequential patterns in the historical closing prices to predict future prices. The past performance often influences future movements. Stock price data is inherently a time series. The closing price, being a part of this time series, aids the method in understanding the temporal relationship between past and future price movements. The closing price also signifies the last traded price of the day, which can influence subsequent trading activities, especially during after-market trading or in pre-market hours. It reflects the final equilibrium between supply and demand for that trading day. In essence, the closing price serves as a crucial piece of information in stock price prediction due to its representation of market sentiment, technical analysis significance, and its role as a temporal input feature that helps the model learn and forecast future price movements.
Design of the Stock Price Prediction Method
In this work, LSTM has been used for stock price prediction. To design the proposed method, factors like pre-processing techniques, feature engineering, model architecture, regularization methods, and the choice of evaluation metrics significantly influence the performance of LSTM models in stock market prediction. Therefore, a holistic approach involving iterative experimentation and optimization of various components of the machine learning pipeline is essential to achieve the best predictive performance. The factors used to design the stock price prediction method has been discussed in detail below.
LSTM Methods Used
To design the proposed stock price prediction method, various types of LSTM networks has been used to such as bidirectional LSTM, multi-step LSTM, single-step LSTM, multi-layer LSTM, etc., as discussed in section 2. shows the optimal parameters used for designing different LSTM methods. It contains all the details used to design of stock price prediction module. Out of all the LSTM methods used, single-step LSTM has shown better performance than any other method. Single-step LSTM methods are crucial in various applications, especially in time-series forecasting and sequential data analysis. Single-step LSTM methods focus on predicting the next step in a sequence based on historical data. This ability to predict one step ahead is vital in many real-time applications like financial forecasting, where immediate predictions are valuable for decision-making. These methods excel in capturing sequential dependencies within the data. They learn from historical sequences to make accurate predictions for the immediate future.
Table 1. Optimal parameters used for designing LSTM modules.
Single-step LSTM forecasting often involves simpler model architectures compared to multi-step forecasting. This simplicity can facilitate faster training, easier interpretation, and reduced computational complexity, making them advantageous in scenarios with limited resources. Their flexibility in handling sequential data makes them adaptable to different types of time-series data, including financial markets. The evaluation of single-step predictions is relatively straightforward, allowing for clear model evaluation and comparison. This simplicity aids in interpreting and validating the model’s performance, making it easier to assess the quality of predictions. While single-step LSTM methods have their advantages, they might not capture long-term dependencies as effectively as multi-step methods in certain scenarios. For long-range predictions or tasks requiring extensive future forecasting, multi-step methods or architectures specifically designed for such purposes might be more appropriate. Overall, the importance of single-step LSTM methods lies in their ability to provide immediate, accurate predictions on sequential data, making them indispensable in numerous real-world applications.
Activation Functions Used
In LSTM networks, activation functions play a crucial role in controlling the flow of information through the network and in modeling the gates that regulate the cell state. The primary activation functions used within LSTM units are sigmoid, Tanh, linear, RELU. The sigmoid activation function is used to regulate the information flow through the gates in an LSTM cell. It squashes input values to the range [0, 1], making it suitable for gating mechanisms, like the input, forget, and output gates in LSTM. The hyperbolic tangent (tanh) function is commonly used to control the cell state within LSTM units. It squashes the input values to the range [−1, 1], allowing for better gradient propagation and capturing a wider range of values compared to the sigmoid function. In some variations of LSTM cells, the identity function (which is essentially a linear function f(x) = x) is used in certain parts of the cell, especially in the candidate cell state computation. While less common in LSTM cells due to potential vanishing gradient issues, the ReLU activation function has been experimented with in some cases, particularly in modifications or variations of LSTM networks. ReLU may encounter an issue known as the “dying ReLU problem,” wherein neurons may cease to be active and halt the learning process. These activation functions are used in different parts of the LSTM cell to control the flow of information, regulate gate behaviors (like input, forget, and output gates) and manage the cell state, thereby enabling the network to capture and process sequential information effectively. The choice of activation functions often depends on specific architectural variations, the problem at hand, and empirical observations regarding their effectiveness in learning meaningful representations from sequential data.
Optimizer Used
Choosing the best optimizer for stock market prediction using LSTM models is not straightforward as it heavily depends on the specific characteristics of the data-set, the architecture of the LSTM network, and various hyper-parameters. However, certain optimizers have shown promise in financial time-series prediction tasks. Different optimizer has been used in this work. Adam is a commonly chosen option due to its adaptive learning rates and momentum. Its capacity to manage sparse gradients and scale learning rates for each parameter can be advantageous when dealing with financial time-series data. This optimizer adapts learning rates based on recent gradient magnitudes and has shown effectiveness in handling non-stationary data, which is common in financial markets. Nadam combines Nesterov accelerated gradient (NAG) with Adam. It aims to leverage the advantages of both algorithms, potentially offering improved convergence and performance. While not as frequently used in financial time-series prediction as Adam or RMSprop, these optimizers might offer benefits in scenarios where adaptive learning rates for specific parameters are crucial. However, the effectiveness of an optimizer is often task-dependent and can vary based on the characteristics of the financial data being used. It is crucial to perform thorough experimentation, including hyperparameter tuning and model validation, to identify the optimizer that performs best for a specific stock market prediction task
Epochs Used
The optimum number of epochs (training iterations over the entire dataset) for training a neural network, including LSTM models, depends on various factors and does not have a fixed, universally applicable value. Determining the ideal number of epochs involves a balance between under-fitting (insufficient learning) and over-fitting (excessive learning) on the training data. Here are some considerations for finding an optimum epoch size as used in this work.
Dataset Size: Larger datasets might require more epochs to capture underlying patterns adequately, whereas smaller datasets might converge faster with fewer epochs. In this case, data from 1 Jan 2023 to 31 Dec 2023 has been taken.
Model Complexity: More complex models (deeper networks, more parameters) may require more epochs to converge compared to simpler models.
Learning Rate and Optimizer: The choice of learning rate and optimizer can influence the convergence speed. A well-tuned learning rate coupled with an appropriate optimizer might require fewer epochs for convergence.
Early Stopping: Utilizing methods such as early stopping, which interrupts training when the model’s performance on a validation set starts declining, aids in mitigating overfitting. This approach identifies an optimal stopping point, minimizing the likelihood of training for excessive epochs. Validation Performance: Monitoring the model’s performance on a validation set during training can help identify when the model starts over-fitting. The epoch where validation performance starts to decline can be a signal to stop training.
Computational Resources: Practical limitations in computational resources might influence the choice of the epoch size. Training for too many epochs might be computationally expensive.
Testing of Stock Price Prediction Module
There is no one-size-fits-all answer for the optimum epoch size. It is often determined through experimentation and validation on a separate validation data-set. Commonly, practitioners perform a grid search or use techniques like cross-validation to explore different epoch sizes and other hyperparameters, selecting the configuration that provides the best balance between model performance and computational efficiency. Using techniques like early stopping, coupled with monitoring validation performance, helps prevent the model from training for more epochs than necessary, thereby mitigating overfitting and optimizing the training process.
Results
The proposed stock market prediction method has been validated using samples that are not used previously. The performance matrices used for checking the effectiveness are MSE, RMSE, MAE and R2. The details of the results obtained for the stock market prediction method are described below.
Analysis of Predicted Output
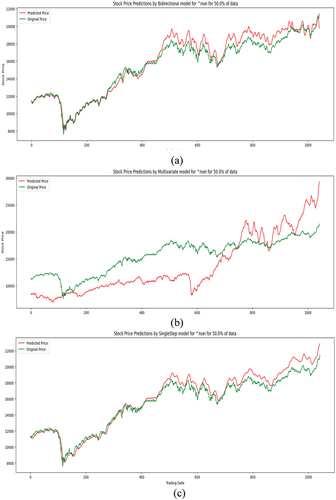
The proposed stock price prediction method has been tested and the predicted price has been compared with the original price. The original stock price and the predicted stock price of the different methods have been shown in . It can be observed from the figure that the predicted price is nearly the same as the actual price.
Figure 4. Actual and predicted stock price for different LSTM module (a) Bidirectional (b) Multivariate (c) Singlestep.
Mean Square Error
The Mean Square Error (MSE) is a prevalent loss function employed in machine learning algorithms, including those utilizing LSTM networks. Within the realm of LSTMs or any neural network, MSE functions as a metric to gauge the disparity between predicted values and actual values. It computes the average of squared differences between predicted and actual values. It is a measure of the model’s performance in approximating the true underlying relationship between input and output. In LSTMs, which are often used for sequence prediction tasks (such as time-series forecasting or natural language processing), MSE helps quantify how well the model predicts the next values in the sequence. The Mean Square Error (MSE) functions as an assessment metric for evaluating the performance of the LSTM model. Reduced MSE values indicate that the model’s predictions closely align with the actual values. It offers a quantitative measure of the LSTM network’s ability to generalize to unseen data. The squaring in MSE amplifies larger errors, making it sensitive to outliers. This means that MSE penalizes larger errors more than smaller ones. In some scenarios, this property might not be desirable, especially if the data-set has outliers or if minimizing large errors is not a primary concern.
Overall, MSE is important in LSTM networks as it provides a clear, quantitative measure of the model’s performance in predicting sequential data, guiding the training process to minimize prediction errors. However, it is essential to consider the context and specific requirements of the problem at hand as MSE might not always be the most suitable loss function depending on the nature of the data and the desired model behavior. The MSE of different method for different stocks has been shown in and . It can be observed that less MSE is in single-step LSTM method. From the result it has been observed that the single-step LSTM method is predicting the stock price more accurately than other methods.
Figure 5. MSE of different stocks for different methods.
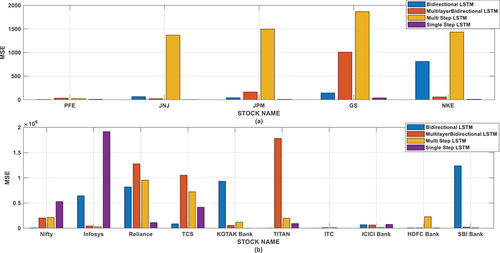
Table 2. Evaluation of mean square error for national stocks.
Table 3. Evaluation of mean square error on international stocks.
Root Mean Square Error
Root mean square error (RMSE) is another common metric used in evaluating the performance of machine learning models, including LSTM networks. It shares similarities with mean square error (MSE) but is rooted in its square root, providing a different perspective on error measurement. Here’s why RMSE is important in the context of LSTM networks. RMSE, being the square root of MSE, shares the same unit as the predicted and actual values. This property makes RMSE particularly useful when the scale of the predicted values is important and needs to be consistent with the original scale of the data. For instance, in financial forecasting or stock price prediction with LSTMs, having an error metric that reflects the same unit as the predicted prices can be crucial for understanding the significance of the errors.
Like MSE, RMSE amplifies larger errors more than smaller ones due to squaring the errors. This characteristic can be helpful in scenarios where the model needs to pay more attention to and effectively reduce larger errors. RMSE is interpretable and easy to compare across different models or different datasets. It gives a clear idea of the typical magnitude of errors the model is making, allowing for straightforward comparison between models and facilitating model selection. Similar to MSE, using RMSE as a loss function during training LSTM networks guides the optimization process by minimizing the root mean squared error. This optimization pathway may lead to different learning behaviors compared to other loss functions like MAE, impacting how the model generalizes from the data. RMSE is particularly valuable in scenarios where understanding the magnitude of errors in the original scale of the data is crucial, and it is often used in fields such as finance, engineering, or any domain where the units of measurement are significant. However, like other error metrics, its applicability depends on the specific requirements and characteristics of the problem at hand. The RMSE of different method for different stocks has been shown in and . It can be observed that the stock has less RMSE in single-step LSTM method. From the result it has been observed that the single-step LSTM method is predicting the stock price more accurately than other methods.
Figure 6. Evaluation of root mean square error for national stock.
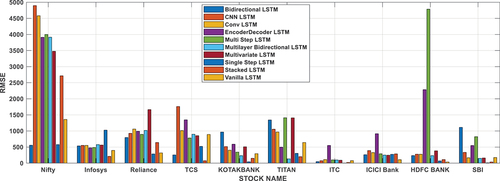
Table 4. Evaluation of root mean square error on international stocks.
Mean Absolute Error
Mean absolute error (MAE) is an alternative loss function to MSE and serves a distinct purpose in the context of LSTM networks. Unlike MSE, which squares the errors and thus heavily penalizes larger errors, MAE, or Mean Absolute Error calculates the average absolute discrepancy between predicted and actual values. This characteristic renders MAE less affected by outliers in the data. In scenarios where the data-set contains outliers or instances where large errors should not be disproportionately penalized, MAE can provide a more robust measure of performance for LSTM models. MAE gives a more intuitive understanding of the average prediction error. The errors are not squared, so the resulting value directly represents the average magnitude of errors between predictions and actual values. This can be particularly helpful when explaining the model’s performance to stakeholders who might prefer a more easily interpretable metric. Using MAE as a loss function in training LSTM models encourages the model to make predictions that minimize the mean absolute disparity between predictions and the true values. It leads to a different optimization path during training compared to MSE, potentially affecting how the model learns and generalizes from the data.
MAE is less affected by extreme values compared to MSE, making it a stable choice when dealing with noisy data or situations where extreme values might be present but are not necessarily indicative of poor model performance. In summary, MAE is important in LSTM networks as an alternative loss function that provides a different perspective on error measurement compared to MSE. Its focus on absolute differences rather than squared differences makes it valuable in scenarios where outliers need to be handled more gracefully or when a more interpretable and stable error metric is preferred. Depending on the specific characteristics of the dataset and the objectives of the modeling task, the selection between MSE and MAE may vary (or other loss functions) should be based on what best aligns with the problem’s requirements. The MAE of different method for different stocks has been shown in and . It can be observed that the some stock has less MAE in single-step LSTM method. From the result it has been observed that the single-step LSTM method is predicting the stock price more accurately than other methods.
Figure 7. Evaluation of mean absolute error on international stocks.
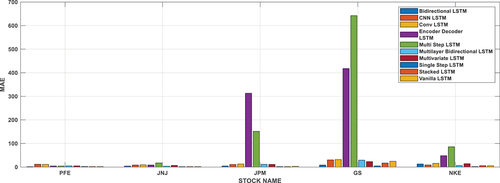
Table 5. Evaluation of mean absolute error for national stocks.
R2 Error
R-squared (R2) is a statistical measure utilized for assessing the performance of regression models, including LSTM networks, in predicting continuous values. R2 measures the goodness-of-fit of the LSTM model to the data. Compared to a basic model, indicating the proportion of variance in predicted values that the model captures. It measures how much of the target variable’s variability is explained by the model’s predictions. R2 allows comparison between different LSTM models or variations. It assists in selecting the model that best explains the variance in the target variable, aiding in choosing the most suitable model. A higher R2 value (closer to 1) indicates that the LSTM model can effectively explain a significant portion of the variability in the target variable, signifying strong predictive power. Conversely, lower R2 values (closer to 0) suggest that the model’s predictions do not explain much of the data’s variability.
R2 is easily interpretable and widely recognized. It is useful for explaining how well the model captures the variance in the data to stakeholders unfamiliar with complex machine learning models. Overall, R2 serves as a valuable tool for assessing the performance of LSTM models in regression tasks, offering insights into their ability to explain data variability and aiding in model selection for specific problems. The R2 of different methods for different stocks has been shown in and . From the result it has been observed that the single-step LSTM method is predicting the stock price more accurately than other methods.
Figure 8. R2 error for different stock.
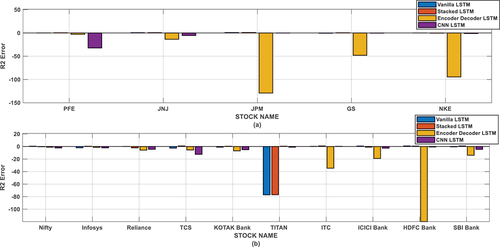
Table 6. Evaluation of R2 error on national stocks.
Table 7. Evaluation of R2 error on international stocks.
Discussions
The proposed stock market prediction method has implemented various types of LSTM method. shows the comparison of evaluation matrices for different implemented methods for an international stock. It can be observed from that the errors are less for single-step method than any other method. Hence, from the result analysis it can be recommended that the single-step LSTM method can more accurately predict the stock price than other LSTM method.
Table 8. Comparison of evaluation matrices for different LSTM method for national stock.
The proposed single-step LSTM-based stock price prediction method has been compared with linear regression method. Some of the results for both the methods are shown in for international stocks. The MSE of the stocks for single-step LSTM method are very less compared to the linear regression method. The RMSE of the stocks for single-step LSTM method is also very less compared to the linear regression method. Similarly, the MAE and R2 of the stocks for single-step LSTM method are also very less compared to the linear regression method.
Table 9. Comparison of single-step LSTM method with linear regression method for international stocks.
The proposed LSTM-based stock price prediction method has been compared with other existing methods. shows the comparison of existing methods with proposed stock market prediction method based on the advantages and disadvantages of each method. The existing methods have drawbacks like time complexity problem, issue of exposure bias, early convergence problem, may not be assessed on a novel database, method may be more complex etc. The proposed single-step LSTM method is less complex and more accurate compared to other existing method described in the literature. The contribution of the study can be summarized with the following points:
By leveraging LSTM, the stock market can become more efficient, transparent, and accessible, transforming traditional trading practices and enabling smarter, data-driven decisions.
A new technique have been developed for evaluating and comparing predictive models, using novel metrics like risk-adjusted return and prediction stability, facilitating better model selection and deployment.
A model has been proposed that use deep neural networks capturing both linear and nonlinear patterns in financial data for enhanced flexibility and adaptability.
It focuses on improving the scalability and efficiency of prediction models, to reduce computational burdens, making them more practical for real-time applications.
It aims to enhance the field of stock market prediction and machine learning, providing valuable advancements for both the financial industry and broader AI research contexts.
Table 10. Comparison with other methods.
Conclusion
The study substantiates this claim through a meticulous examination of 10 distinct machine learning models, establishing the most effective in predicting stock prices. Within this work, the 10 deep neural networks emphasized (Bidirectional, CNN, Conv, Encoder Decoder, Multi-Step, Multi-layer Bidirectional, Multivariate, Single-Step, Stacked, Vanilla) have been introduced alongside their respective attributes and applications. Both single and multi-layer LSTM architectures are deployed, with their performances assessed using diverse evaluation metrics to determine the optimal model. Results from the experiments indicate that a single-layer LSTM model featuring approximately 100 hidden neurons delivers superior fitting and enhanced prediction accuracy compared to its multi-layer counterpart. Moreover, the proposed model can be readily customized for application in other broad market indexes exhibiting similar data behavior. This model offers valuable insights to stakeholders seeking to enhance their understanding of market conditions prior to making investment decisions. The collective findings of the work underscore the significance of embracing LSTM deep learning model and its potential to revolutionize investment dynamics. Deep learning methodologies employed for forecasting stock prices offer increased accuracy and reliability for corporations. However, it’s important to note that deep learning techniques, including LSTM, demand significant computational resources. The current study utilized Google Colab, leveraging its provision of eight tensor processing units (TPUs). With dedicated computational resources, additional experiments could be conducted with larger datasets and higher epochs, potentially offering deeper insights into hyper-parameter tuning. The current study focuses solely on optimizing the fundamental LSTM architecture. Similar optimization techniques can be applied to various types of LSTM models. Future research aims to enhance the model by integrating hybrid prediction-based models for more accurate stock price predictions, investigating existing portfolio models, and refining the proposed model through the lens of genetic algorithms and particle swarm optimization. This avenue holds significance for future research endeavors. The current approach focused primarily on univariate analysis. In the future work, additional dimensions or features will be considered to enhance the richness and informativeness of the model.
Disclosure Statement
No potential conflict of interest was reported by the author(s).
Data Availability Statement
The data that support the findings of this study are openly available in [Yahoo Finance] at https://finance.yahoo.com.
References
- Agarwal, V., P. R. Kumar, S. Shankar, S. Praveena, V. Dubey, and A. Chauhan. 2023. A deep convolutional kernel neural network based approach for stock market prediction using social media data. International Conference on Intelligent Computing and Control Systems, 78–28, Madurai.
- Albahli, S., T. Nazir, A. Mehmood, A. Irtaza, A. Alkhalifah, and W. Albattah. 2022. AEI-DNET: A novel DenseNet model with an autoencoder for the stock market predictions using stock technical indicators. Electronics 11:611.
- Awad, A. L., S. M. Elkaffas, and M. W. Fakhr. 2023. Stock market prediction using deep reinforcement learning. Applied System Innovation 6 (6):106. doi:10.3390/asi6060106.
- Banerjee, S., and D. Mukherjee. 2022. Short term stock price prediction in Indian market: A neural network perspective. Studies in Microeconomics 10 (1):23–49. doi:10.1177/2321022220980537.
- Botunac, I., J. Bosna, and M. Matetić. 2024. Optimization of traditional stock market strategies using the LSTM hybrid approach. Information 15 (3):136. doi:10.3390/info15030136.
- Fathali, Z., Z. Kodia, and L. BenSaid. 2022. Stock market prediction of NIFTY 50 index applying machine learning techniques. Applied Artificial Intelligence 36 (1):1. doi:10.1080/08839514.2022.2111134.
- Finance Yahoo. 2023. Data from: Accessed March 11, 2023. https://finance.yahoo.com.
- Garita, M. 2021. Using stock market data in python. In Applied quantitative finance: Using python for financial analysis, ed. M. Garita, 71–83. Palgrave Pivot Cham: Springer International Publishing.
- Hiransha, M., E. A. Gopalakrishnan, M. Vijay-Krishna, and K. P. Soman. 2018. NSE stock market prediction using deep-learning models. Procedia Computer Science 132:1351–62. doi:10.1016/j.procs.2018.05.050.
- Ji, X., J. Wang, and Z. Yan. 2021. A stock price prediction method based on deep learning technology. International Journal of Crowd Science 5 (1):55–72. doi:10.1108/IJCS-05-2020-0012.
- Ji, Y., A. W.-C. Liew, and L. Yang. 2021. A novel improved particle swarm optimization with long-short term memory hybrid model for stock indices forecast. Institute of Electrical and Electronics Engineers Access 9:23660–71. doi:10.1109/ACCESS.2021.3056713.
- Li, X., H. Xie, R. Wang, Y. Cai, J. Cao, F. Wang, H. Min, and X. Deng. 2016. Empirical analysis: Stock market prediction via extreme learning machine. Neural Computing and Applications 27 (1):67–78. doi:10.1007/s00521-014-1550-z.
- Lu, W., J. Li, J. Wang, and L. Qin. 2021. A CNN-BiLSTM-AM method for stock price prediction. Neural Computing and Applications 33 (10):4741–53. doi:10.1007/s00521-020-05532-z.
- Moghar, A., and M. Hamiche. 2020. Stock market prediction using LSTM recurrent neural network. Procedia Computer Science 170:1168–73. doi:10.1016/j.procs.2020.03.049.
- Patel, J., S. Shah, P. Thakkar, and K. Kotecha. 2015. Predicting stock and stock price index movement using trend deterministic data preparation and machine learning techniques. Expert Systems with Applications 42 (1):259–68. doi:10.1016/j.eswa.2014.07.040.
- Pramod, B. S., and P. M. Shastry. 2020. Stock price prediction using LSTM. TEST Engineering & Management 83:5246–51.
- Qiao, R., W. Chen, and Y. Qiao. 2022. Prediction of stock return by LSTM neural network. International Journal Applied Artificial Intelligence 36 (1). doi:10.1080/08839514.2022.2151159.
- Qiu, M., Y. Song, and Z. Wang. 2016. Predicting the direction of stock market index movement using an optimized artificial neural network model. Public Library of Science One 11 (5):e0155133. doi:10.1371/journal.pone.0155133.
- Ren, R., D. D. Wu, and T. Liu. 2018. Forecasting stock market movement direction using sentiment analysis and support vector machine. IEEE Systems Journal 13 (1):760–70. doi:10.1109/JSYST.2018.2794462.
- Roondiwala, M., H. Patel, and S. Varma. 2017. Predicting stock prices using LSTM. International Journal of Science and Research 6 (4):1754–56.
- Shaban, W. M., E. Ashraf, and A. E. Slama. 2024. SMP-DL: A novel stock market prediction approach based on deep learning for effective trend forecasting. Neural Computing and Applications 36 (4):1849–73. doi:10.1007/s00521-023-09179-4.
- Shen, J., and M. O. Shafiq. 2020. Short-term stock market price trend prediction using a comprehensive deep learning system. Journal of Big Data 7 (66). doi:10.1186/s40537-020-00333-6.
- Song, Y., C. Cai, D. Ma, and C. Li. 2024. Modelling and forecasting high-frequency data with jumps based on a hybrid nonparametric regression and LSTM model. Expert Systems with Applications 237:121527. doi:10.1016/j.eswa.2023.121527.
- Ticknor, J. L. 2013. A Bayesian regularized artificial neural network for stock market forecasting. Expert Systems with Applications 40 (14):5501–06. doi:10.1016/j.eswa.2013.04.013.
- Zhang, K., G. Zhong, J. Dong, S. Wang, and Y. Wang. 2019. Stock market prediction based on generative adversarial network. Procedia Computer Science 147:400–06. doi:10.1016/j.procs.2019.01.256.
- Zou, J., J. Lou, B. Wang, and S. Liu. 2024. A novel deep reinforcement learning based automated stock trading system using cascaded LSTM networks. Expert Systems with Applications 242:122801. doi:10.1016/j.eswa.2023.122801.