Abstract
The remnant kidney rat model has been extensively used for the evaluation of bone changes due to uremia. The present study aimed to assess the effect of the dietary phosphorus availability and of the severity of renal failure on bone histomorphometric changes and various biochemical markers over time in this model. Chronic renal failure (CRF) was induced in male Wistar rats by 5/6th nephrectomy. Half of the number of animals received a standard rat diet (STD) (0.67% P, containing low bioavailable phosphorus of plant origin); the other animals were fed a high phosphorus diet (HPD) (0.93% P, containing inorganic phosphorus with high bioavailability). Every two weeks, blood and urine samples were collected. At sacrifice after 6 or 12 weeks, bone samples were taken for the measurement of histological and histodynamic parameters. Serum creatinine measurements indicated the development of mild to moderate renal failure in both diet groups. Phosphaturia was unexpectedly low in all animals that received the STD, indicating relative phosphorus depletion despite the normal dietary phosphorus content. In the HPD CRF group, a decrease in calcemia and a rise in phosphatemia were seen after 12 weeks of CRF, which were more pronounced in animals with higher serum creatinine. Serum iPTH levels were distinctly increased in CRF rats fed a HPD, especially those with more pronounced renal failure. Serum osteocalcin and to a lesser extend tartrate-resistant acid phosphatase and urinary pyridinoline and deoxypyridinoline crosslinks were higher in the CRF animals compared to the shams, particularly in the animals of the HPD group with more pronounced CRF. In both diet groups, the CRF animals had significantly higher amounts of osteoid compared to shams. Only the animals that received a HPD developed distinct histological signs of secondary hyperparathyroidism (sHPTH), that is, an increased bone formation rate, mineral apposition rate, osteoblast perimeter, and eroded perimeter. Again, this effect was most prominent in rats with more severe CRF. In conclusion, data of the present study indicate that in experimental studies using the remnant kidney rat model, both the dietary phosphorus bioavailability and the degree of renal failure in the development of hyperparathyroidism should be considered.
INTRODUCTION
The changes in mineral metabolism as a consequence of renal failure inevitably lead to the development of metabolic bone disease. Renal osteodystrophy is a general term encompassing both high and low turnover forms of renal bone disease.Citation[1–4] Secondary hyperparathyroidism (sHPTH) and osteitis fibrosa belong to the former group, while osteomalacia and adynamic bone disease are characterized by a low bone turnover state. In between these two groups, patients may present with either a normal histology or a mixed lesion showing the characteristics of both osteomalacia and hyperparathyroidism.
The availability of appropriate animal models for human diseases is essential to study the causes and therapeutic and preventive measures of renal osteodystrophy, as well as to develop new drugs for the treatment of the various bone lesions. Diverse experimental models have been developed to induce CRF in laboratory animals.Citation[5] The most widely used methods are based on the resection of varying amounts of renal parenchyma. The procedure known as the 5/6th nephrectomy model in the rat, also referred to as the “rat remnant kidney” model, was developed by Chanutin and Ferris.Citation[6] This model has been extensively used to assess pathophysiological aspects of CRF,Citation[7–11] but is also the most frequently used model for the examination of bone changes due to uremia.Citation[12–19] Strikingly, literature data indicate that with this model, varying degrees of secondary hyperparathyroidism are achieved, making comparisons between various studies and extrapolation to the human situation often difficult. The main reasons for this are the absence of standardization in duration and degree of renal failure and dietary phosphorus content/bioavailability between different studies.
For the study of the development of sHPTH in animals with CRF, not only the dietary phosphorus content, but also the phosphorus bioavailability is very important. The bioavailability of dietary phosphorus greatly depends on the form in which the element occurs in the diet. Due to recent regulations of the EC authorities, bone meal may no longer be used as the phosphorus source of rat chow. Therefore, most suppliers changed the recipe of rats and mice diets and switched to vegetarian phosphorus sources (e.g., wheat). However, these may contain relatively high amounts of phytic acid, which represents a poorly to almost non-bioavailable source of phosphorus and is known to form very stable complexes with mineral ions, among them phosphate, rendering them unavailable for intestinal uptake.Citation[20–22] The chemical analysis of the diet thus may yield phosphorus concentrations that perfectly correspond with those reported by the manufacturer but does not give any information regarding its bioavailability. This important issue does not seem to have been taken into consideration in the great majority of experimental studies dealing with mineral metabolism and bone diseases.
The experiment described in this paper was designed to evaluate the effect of the use of a different phosphorus source in the diet of CRF rats on the development of sHPTH, as well as the effect of variations in the uremic state on the development of this bone disorder in the remnant kidney rat model.
MATERIALS AND METHODS
Experimental Design
Fifty-eight Male Wistar rats (200–225g) were included in this experiment. The animals were randomly divided into two groups upon arrival. The first group was fed a standard commercial diet (STD) (Carfil Quality, Oud-Turnhout, Belgium) with a calcium content of 0.8% and a phosphorus content of 0.67%. In this diet, vegetarian phosphorus sources (low bioavailability) are used. The second group received a “high phosphorus diet” (HPD) (Sniff Spezialdiäten, Soest, Germany), with a calcium content of 0.8% and a phosphorus content of 0.93%. In this diet, inorganic Ca/P sources with a high absorption rate (e.g., monocalcium-phosphorus) are added (high bioavailability). The animals had free access to food and water. After an adaptation period of three weeks, the animals were either sham-operated or subjected to two-stage 5/6th nephrectomy (remnant kidney model) as previously described.Citation[23] Briefly, under sodium pentobarbital anaesthesia, two branches of the renal artery of the left kidney were ligated, and two weeks later, the right kidney was removed. The sham-operated rats were treated identically, but both of their kidneys were exteriorized only, and replaced intact. Blood and urine collections were performed and water as well as food consumption were recorded every two weeks. For urine collection, the animals were housed individually in metabolic cages, and 24‐hour urine samples were collected. One group of rats was sacrificed after 6 weeks and another group 12 weeks post-operation. Blood was taken from the tail vein during the study period and by aortic puncture at sacrifice. Serum and urine samples were frozen at –80˚C until analysis. At seven and three days before sacrifice, rats were labeled with tetracycline (30mg/kg) and demeclocycline (25mg/kg), respectively. At sacrifice, one tibia was removed from each rat for histomorphometric analysis.
Biochemical and Chemical Analyses
Creatinine, calcium, and phosphorus concentrations in the serum were measured using a Vitros 950 AT AutoAnalyzer System (Ortho Clinical Diagnostics, Johnson & Johnson, Raritan, New Jersey, USA). Creatinine concentration in urine was determined according to the Jaffé method. The method of Bradford was applied to measure proteinuria. Urinary phosphorus concentration was determined using a photometric method (Ecoline®S Phosphate kit, Diasys, Holzheim, Germany). Calcium determinations in urine were performed by flame-AAS (Perkin-Elmer) after diluting the samples in RO-water, to which 1g/L lanthanum nitrate was added to avoid chemical and ionization interferences. Pyridinoline (PYD) and deoxypyridinoline (DPYD) concentrations in urine were measured with a locally developed HPLC-based method using the reagents of the Biorad crosslinks kit (Bio-Rad Laboratories GmbH, Munich, Germany). Intact parathyroid hormone (iPTH) was determined using the rat PTH IRMA kit (Immutopics, Inc., San Clemente, California, USA), and osteocalcin was measured by a similar method (rat osteocalcin IRMA kit, Immutopics, Inc., San Clemente, California, USA). Alkaline phosphatase (ALP) activity was quantified spectrophotometrically by measurement of the release of p-nitrophenol from p-nitrophenylphosphate, reflected by the change in absorbance at 405 nm over a five-minute period. This procedure is based on the kinetic method for measuring total alkaline phosphatase acknowledged by the International Federation of Clinical Chemistry (IFCC).Citation[24] Serum tartrate-resistant acid phosphatase (TRAP) activity was determined using a solid phase immunofixed enzyme activity assay (RatTRAP Assay, Medac Diagnostica, Meux, Belgium).
Bone Histology
At sacrifice, femurs and tibiae were freed from soft tissue. The right tibia was used for histological examination after 24 hours fixation in Burkhardt's solution and subsequent transfer to 70% ethanol until further processing. Bone samples were then embedded in 100% methylmetacrylate. Longitudinal sections (5μm) of the proximal tibia were cut with a JUNG K microtome and stained according to Goldner for descriptive histology. Bone histological data, as well as dynamic parameters, are reported using standardized nomenclature and definitionsCitation[25] and were measured using a semi-automatic image processing system (Kontron KS400). The parameters measured include total bone area (BAR), osteoid area (OAR), osteoid width (OWI), osteoid perimeter (OPM), eroded perimeter (EPM), osteoblast perimeter (OBPM), osteoclast perimeter (OCPM), double-labeled perimeter (DLPM), mineral apposition rate (MAR), mineralization lag time (MLT), and bone formation rate (BFR).
Statistics
Statistical analysis of the data was done using the Kruskal-Wallis test and the Mann-Whitney test for unpaired comparisons, followed by Bonferroni correction when more than two groups were compared. The relationship between two values was assessed by Pearson's linear correlation. A p value < 0.05 was considered to be significant at a two-tailed level. Results are expressed as mean ± standard error.
RESULTS
Body Weight, Food and Water Consumption, and Urinary Volume
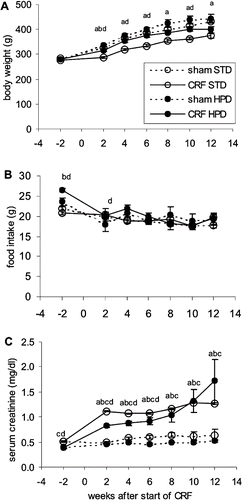
Body weights steadily increased during the observation period and were significantly lower in the CRF animals compared to the sham-operated animals during the whole study period (see ). The body weight of CRF rats was significantly lower in the STD group compared to the HPD group. The weight of the sham-operated animals did not differ between the STD and HPD groups. Daily food consumption was the same in all study groups (see ). Water intake and urinary output were higher after initiation of renal failure in the CRF animals as compared to the sham-operated rats, but did not differ between the two diet groups (data not shown).
Figure 1. Evolution over time of (A) body weight, (B) food intake, and (C) serum creatinine over time in renal failure (CRF) and control (SHAM) animals that were fed either a standard diet (STD) or a high phosphorus diet (HPD). a: p < 0.05 sham-STD vs. CRF-STD; b: p < 0.05 sham-HPD vs. CRF-HPD; c: p < 0.05 sham-STD vs. sham-HPS; d: p < 0.05 CRF-STD vs. CRF-HPD.
Effect of Dietary Phosphorus on Development of sHPTH
Serum and Urine Biochemistry
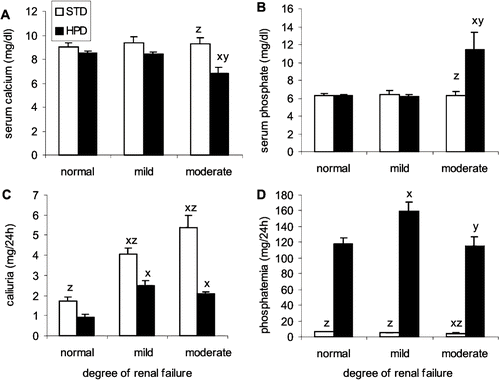
Serum creatinine measurement in animals before and after initiation of the 5/6th nephrectomy indicates that a moderate degree of renal failure was induced, which was comparable between the STD and HPD groups (see ). During the course of the 12-week study period, serum levels of creatinine were elevated 1.8-fold in the STD group and 2.1-fold in the HPD group. The presence of renal failure was further evidenced by the time-dependent rise in proteinuria from 9.6 ± 3.1 mg/24h before CRF to 126.4 ± 63.8 mg/24h after 12 weeks of uremia (in all CRF animals taken as one group).
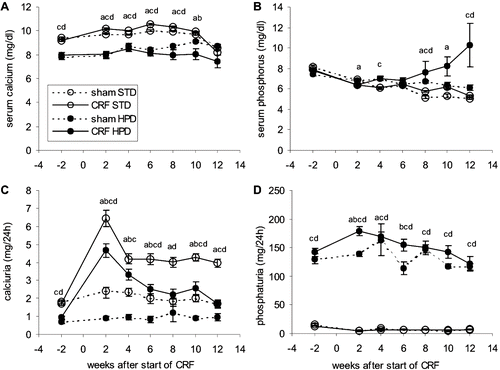
A significantly lower amount of calcemia and calciuria was noted in both the CRF and sham-operated animals that received the HPD compared to those that were fed the STD (see and ). At the end of the study period, the CRF animals from the HPD group had significantly higher phosphatemia compared to the NP group (see ). Phosphaturia was remarkably low in all rats that were fed the STD during the whole 12 weeks study period (see ).
Figure 2. Evolution over time of (A) serum calcium, (B) serum phosphorus, (C) calciuria, and (D) phosphaturia in renal failure (CRF) and control (SHAM) animals that were fed either a standard diet (STD) or a high phosphorus diet (HPD). a: p < 0.05 sham-STD vs. CRF-STD; b: p < 0.05 sham-HPD vs. CRF-HPD; c: p < 0.05 sham-STD vs. sham-HPS; d: p < 0.05 CRF-STD vs. CRF-HPD.
Markers for Bone Turnover
In the STD group, no significant rise in serum iPTH concentration was found 6 or 12 weeks after initiation of renal failure (see ). Rats that received a HPD, however, showed significantly increased serum iPTH levels compared to the shams, which continued to rise from week 6 till week 12 post-surgery (see ). In the CRF animals, significantly higher serum osteocalcin levels were noted compared to controls in both diet groups. Although there was no significant difference between the two diets, a tendency toward higher osteocalcin levels in the CRF rats of the HPD group vs. the STD group was noted (see ). Serum ALP activity decreased during the course of the experiment, from 133.8 ± 31.3 U/L before the installation of CRF, to 63.8 ± 12.4 U/L in the CRF rats and 65.5 ± 13.6 in the sham-operated animals at week 12 post-surgery in the STD group. There was no significant difference in ALP activity between the CRF animals and the shams or between the HPD and STD groups at any time point (data not shown).
Figure 3. Evolution over time of (A) serum PTH, (B) serum osteocalcin, (C) serum TRAP, and (D) deoxypyridinoline concentration in renal failure (CRF) and control (SHAM) animals that were fed either a standard diet (STD) or a high phosphorus diet (HPD). a: p < 0.05 sham-STD vs. CRF-STD; b: p < 0.05 sham-HPD vs. CRF-HPD; c: p < 0.05 sham-STD vs. sham-HPS; d: p < 0.05 CRF-STD vs. CRF-HPD.
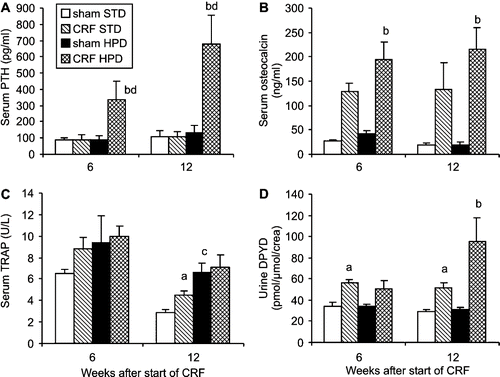
Serum TRAP tended to be higher in the CRF compared to sham-operated rats, which was significant in the STD group after 12 weeks of uremia. The animals that received a HPD had higher serum TRAP activity, which was statistically significant in the sham-operated animals at week 12 (see ). PYD and DPYD crosslinks closely correlated with each other (r = 0.933; p < 0.001) and were significantly increased in CRF rats compared to controls in both diet groups. There was no significant difference in PYD and DPYD excretion rates between the two diets, although a tendency towards higher PYD and DPYD crosslinks in the HPD CRF group was noted after 12 weeks (see ). DPYD excretion was also higher in CRF-STD compared to SHAM-STD.
Bone Histomorphometry
The development of renal failure went along with an increase in the amount of osteoid after 6 and 12 weeks of uremia in both diet groups, as evidenced by a significantly higher osteoid perimeter, area, and width compared to the shams at these time points (see ). In the CRF animals, both the degree of erosion and number of active cuboidal osteoblasts were increased compared to the shams both after 6 and 12 weeks post-operation. These differences became significant in the HPD group.
Table 1 Bone histomorphometric and histodynamic parameters of the various study groups at sacrifice 6 and 12 weeks post-surgery
Feeding a HPD caused an increase in bone turnover, both in control and in CRF animals. Sham-operated animals that received a HPD had higher BFR, MAR, and DLPM and lower MLT and OMT compared to the shams that received a STD, especially at week 12 (see ). A similar, though more pronounced trend was seen in the CRF animals.
Distinct histological signs of secondary hyperparathyroidism (i.e., higher bone formation—increased BFR, MAR, DLPM, OBPM) in combination with higher bone resorption parameters (i.e., higher EPM) (see ) were only seen in the CRF animals receiving the HPD. The effect was markedly more pronounced after 12 weeks of uremia. At this time point, the bone area was significantly increased as well, which indicates that at this time BFR must have exceeded the bone resorption rate (see ). In the HPD group, marrow fibrosis was seen in 26% of the animals (data not shown).
Effect of Degree of Renal Failure
As animal models of CRF, including the “remnant kidney” rat model, are prone to substantial variations in renal function, the extent to which the degree of renal failure affected the development of sHPTH in rats receiving the two different diets was also examined. Based on the serum creatinine concentrations, all rats were assigned to one of three groups: normal renal function (i.e., serum creatinine ≤ 0.6 mg/dL), mild renal failure (i.e., serum creatinine >0.6 and ≤ 1.0 mg/dL), and moderate renal failure (i.e., serum creatinine >1.0 mg/dL). Of the CRF rats that were sacrificed after six weeks of uremia, 58% had mild and 42% had moderate renal failure. Of the CRF animals that were sacrificed after 12 weeks, 42% had mild and 58% had moderate renal failure (for the number of animals in each group, see ).
Table 2 Effect of renal function on bone histomorphometric and histodynamic parameters of the various study groups
Serum and Urine Biochemistry
Animals with moderate renal failure receiving the HPD had significantly lower calcemia (see ) and higher phosphatemia () compared to rats with normal renal function or mild renal failure. The uremic status had no effect on these parameters in the rats of the STD group. In the HPD group, urinary Ca excretion increased with more pronounced renal impairment, however, was significantly lower compared to the STD group (see ). Phosphaturia was significantly higher in all the animals receiving the HPD, independent of the severity of renal failure (see ).
Markers for Bone Turnover
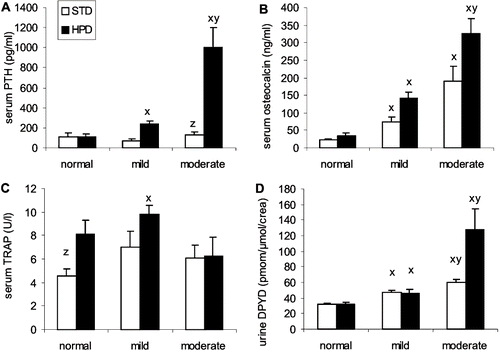
Only in the HPD group was a distinct increase in the serum iPTH level seen, particularly in rats with moderate renal failure (see ). Within the HPD group, serum iPTH levels were increased two-fold and nine-fold in animals with mild and moderate renal failure, respectively, compared to normal rats. Serum osteocalcin concomitantly increased with the development of more pronounced renal failure and tended to be higher in the rats receiving a HPD (see ). Serum TRAP activity also tended to be higher in the animals receiving a HPD, though it was not influenced by uremic status (see ). Urinary PYD and DPYD concentrations steadily increased according to the degree of renal failure in both diet groups. This increase was most pronounced in the CRF rats receiving a HPD (see ).
Figure 5. Effect of renal function on (A) serum PTH, (B) serum osteocalcin, (C) serum TRAP, and (D) deoxypyridinoline concentration in animals that were fed either a standard diet (STD) or a high phosphorus diet (HPD). x: p < 0.05 vs. normal renal function; y: p < 0.05 vs. mild renal failure; z: p < 0.05 vs. HPD.
Bone Histomorphometry
Rats with normal renal function (i.e., the sham-operated animals of week 6 and week 12 taken together as one group) that were fed a HPD had higher BFR, MAR, and DLPM and lower MLT and OMT compared to the shams that received a STD (see ), which indicates again that the HPD induces a higher bone formation, even in control animals, despite unchanged serum PTH levels.
The development of more pronounced renal failure was accompanied by an increase in the amount of osteoid (OPM, OAR, and OWI) compared to animals with normal renal function and mild renal failure, independent of the dietary phosphorus content (see and ). In the STD group, the increased osteoid deposition in rats with moderate renal failure went along with a higher MLT and a lower MAR compared to the rats that received a HPD, indicating the presence of an impaired mineralization in the rats receiving a STD.
Figure 6. Effect of renal function on (A) osteoid area, (B) osteoblast perimeter, (C) bone formation rate, and (D) mineral apposition rate in animals that were fed either a standard diet (STD) or a high phosphorus diet (HPD). x: p < 0.05 vs. normal renal function; y: p < 0.05 vs. mild renal failure; z: p < 0.05 vs. HPD.
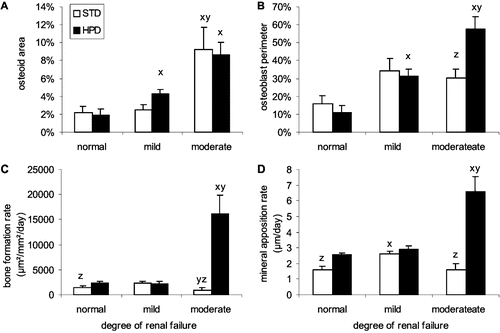
Only the rats with moderate renal failure receiving a HPD developed clear histological signs of secondary hyperparathyroidism, as evidenced by an increased BFR, MAR, and DLPM in combination with an increased OBPM and increased EPM, as compared to animals with normal renal function and mild renal failure (see and ) and all groups of the STD group.
DISCUSSION
Although the remnant kidney rat model has been extensively used for the study of uremic bone disease, no clear-cut data are currently available that describe the temporal development of renal osteodystrophy in the uremic rat or deal with the influence of factors such as the dietary phosphorus content/bioavailability and the degree of the uremic state on the various biochemical and histomorphometric parameters relevant to the development of renal bone disease in this model. In the current study, rats were fed two different diets: a standard diet with a normal phosphorus content based on vegetarian phosphorus sources and a diet to which inorganic Ca/P sources with a high bioavailability are added. The degree of renal failure was comparable between the two diets, and food intake did not differ between the groups.
Surprisingly, CRF rats that received a standard diet (0.67% P and 0.8% Ca) did not show an increase in serum iPTH and did not develop sHPTH after 6 or 12 weeks, even in the presence of moderate renal failure. At first glance, this seems to be in disagreement with existing literature data. Indeed, in the study of Bover et al.Citation[26] of rats with only a mild degree of renal failure (serum creatinine 0.75–1 mg/dL) receiving a diet with comparable phosphorus content (0.6% P; 0.6% Ca), PTH levels almost doubled after 20 days of uremia. The reason for this discrepancy may be due to a difference in biological availability of the phosphorus in their diet versus that in the present study. Although the commercial diet used in this study contains 0.67% P according to the chemical analysis, a reduced bioavailability of phosphorus due to the use of vegetarian phosphorus sources is suspected.Citation[20–22] Evidence for the presence of a phosphorus depletion in rats receiving this diet is provided by the fact that in this study, rats with normal renal function fed the STD had urinary phosphorus concentrations of only 7.9 ± 3.6 mg/24h, compared to 20 ± 3 mg/24h in the study of Bover et al. Therefore, measuring phosphaturia in addition to the dietary phosphorus content should be recommended as an index of phosphorus bioavailability, particularly when using animal models to study renal bone disease. The significantly higher calciuria and calcemia that were noted in the STD group compared to the HPD group may be due to the low bioavailability of phosphorus, causing a reduced calcium-phosphorus product and thus reduced incorporation of calcium into bone and/or an increased mobilisation of calcium out of bone. Moreover, the relative phosphorus depletion must also be the cause of the impaired bone mineralization seen in the uremic STD group, as evidenced by bone histomorphometric measurements showing a significant accumulation of osteoid tissue in combination with an increased MLT after 12 weeks of uremia. The higher number of osteoblasts compared to rats with normal renal function, though not significant, could at least in part have been responsible for the increased osteoid deposition that in the absence of a sufficient phosphorus load is not mineralized readily. A tendency toward a higher level of erosion in the CRF rats compared to the sham-operated rats of the STD group was noted, together with significantly higher concentration of urinary PYD and DPYD crosslinks and serum TRAP activity, reflecting an increased bone resorption in these animals. Overall, these data, together with the bone histomorphometry results, indicate that the CRF animals receiving a STD developed a mixed bone lesion, characterized by the presence of a high turnover component (increased osteoblast and osteoclast activity) that in combination with an impaired mineralization results in an increased osteoid accumulation.
In the HPD provided by Sniff, inorganic phosphorus sources with a high absorption rate (e.g., monocalcium-phosphorus) are added to the diet. The good bioavailability of phosphorus in this diet is evidenced by the fact that animals receiving this food had distinctly higher urinary phosphorus concentrations compared to the rats receiving the STD. Although a high phosphorus diet has previously been used for the induction of secondary hyperparathyroidism in renal failure rats,Citation[26] this is the first study in which bone histological parameters in animals fed a diet with low vs. high bioavailable phosphorus are compared. The development of sHPTH after phosphorus-loading may be attributed to the cumulative effect of various factors:
a direct effect of hyperphosphatemia on PTH synthesis and secretion,Citation[27–29]
hypocalcemia,Citation[30–32]
a reduction in calcitriol,Citation[33],Citation[34] and
a decreased calcemia response to PTH.Citation[31],Citation[34–36]
It has been shown that dietary P restriction totally prevents uremia-induced parathyroid cell growth and ameliorates secondary hyperparathyroidism in uremic dogsCitation[37] and rats.Citation[38]
Feeding the HPD resulted in hyperphosphatemia and hypocalcemia 12 weeks post-surgery in CRF rats compared to sham-operated controls receiving the same diet. Both these factors are known stimulators of PTH production, which is in agreement with the significantly elevated serum iPTH levels already after 6 weeks and the further increase seen after 12 weeks of uremia. Although not significant, biochemical parameters for bone turnover (serum osteocalcin, TRAP, urine PYD and DPYD crosslinks) tended to be higher in the HPD group. Because some of these parameters (serum osteocalcin, urine PYD and DPYD crosslinks) are cleared by the kidney, a higher concentration of these markers after renal failure could be caused by a decrease in renal clearance. However, as the degree of renal failure did not differ between the two diet groups, the higher concentrations found in the HPD group can be attributed to a real increase in bone turnover in the CRF animals receiving this diet. Serum total alkaline phosphatase activity was not increased after induction of renal failure, which is in agreement with other rat studies.Citation[12],Citation[39] In contrast to the situation in humans,Citation[40],Citation[41] serum total alkaline phosphatase may not be considered a reliable indicator of osteoblastic activity in this rat model. The decrease of alkaline phosphatase observed over time, in both sham-operated and CRF rats, is due to an age-related decrease of the concentration of the enzyme.Citation[42]
The development of sHPTH was further evidenced histologically by an increased bone turnover (both higher bone formation and bone resorption parameters) in these animals. As opposed to the rats of the STD group, the increased amount of osteoid in the CRF rats compared to the controls of the HPD group should not be ascribed to the development of a mineralization defect. Rather, in the presence of an increased osteoblastic activity, the higher MAR and the lower MLT in the HPD CRF group in combination with a normal OMT are indicative for an intact mineralization. Rats receiving a HPD thus have an accelerated osteoid deposition caused by an increased osteoblastic activity that gets readily mature and mineralized. After 12 weeks of uremia, this results in a significantly increased bone area (osteoid area + mineralized area) compared to rats that are fed a STD (see and ).
To study the effect of the severity of renal impairment on the development of sHPTH, the animals were divided in three groups: rats with normal renal function, mild renal failure, and moderate renal failure. Only the rats with moderate renal failure receiving a HPD developed pronounced sHPTH. Indeed, only these animals had an increased iPTH concentration, bone formation rate, osteoblastic activity, bone resorption, and the presence of fibrosis. It seems that the degree of renal failure rather than the duration of uremia must be considered an important factor in the development of sHPTH.
Interestingly, feeding the HPD to rats with normal renal function also caused an increase in bone formation: the sham-operated animals that were fed a HPD had higher BFR, DLPM, and MAR and lower MLT compared to the shams that received a STD, despite the absence of any difference in PTH concentrations. This might indicate that phosphorus could acts as an independent stimulus of bone turnover.Citation[43]
In conclusion, data of this study present evidence that the remnant kidney rat may be considered a suitable model for the development of sHPTH provided that both the degree of renal failure and phosphorus load are sufficient. With regard to the latter, not only the phosphorus content of the diet but also its bioavailability, reflected by the phosphaturia, has to be considered in order to obtain reliable and reproducible results.
ACKNOWLEDGMENTS
L. Oste is a recipient of a postgraduate research grant of the Flemish Institute for the promotion of Scientific Technological Research in Industry (IWT).
REFERENCES
- Hruska KA, Teitelbaum SL. Renal osteodystrophy. N Engl J Med 1995; 333: 166–174
- Dabbagh S. Renal osteodystrophy. Curr Opin Pediatr 1998; 10: 190–196
- Hamdy NA. The spectrum of renal bone disease. Nephrol Dial Transplant 1995; 10(Suppl. 4)14–18
- Hruska K. New concepts in renal osteodystrophy. Nephrol Dial Transplant 1998; 13: 2755–2760
- Strauch M, Gretz N. Animal models to induce renal failure: a historical survey. Contrib Nephrol 1988; 60: 1–8
- Chanutin A, Ferris EB. Experimental renal insufficiency produced by partial nephrectomy. Arch Int Med 1932; 49: 767–787
- Faraj AH, Morley AR. Remnant kidney pathology after five-sixth nephrectomy in rat. I. A biochemical and morphological study. APMIS 1992; 100: 1097–1105
- Faraj AH, Morley AR. Remnant kidney pathology after five-sixth nephrectomy in rat. II. Electron microscopy study. APMIS 1993; 101: 83–90
- Kleinknecht C, Laouari D, Burtin M. Uremic rat model: experience with young rats. Contrib Nephrol 1988; 60: 27–38
- Sterner G, Wennberg A. Partial nephrectomy and chronic renal failure: the ‘adult’ rat model. Contrib Nephrol 1988; 60: 39–45
- Ormrod D, Miller T. Experimental uremia. Description of a model producing varying degrees of stable uremia. Nephron 1980; 26: 249–254
- Sancho JJ, Duh QY, Oms L, Sitges-Serra A, Hammond ME, Arnaud CD, Clark OH. A new experimental model for secondary hyperparathyroidism. Surgery 1989; 106: 1002–1008
- Kimmel D, Ritz E, Krempien B, Mehls O. Bone cell kinetics and function during experimental uremia. Metab Bone Dis Relat Res 1981; 3: 191–198
- Mehls O, Ritz E, Gilli G, Wingen AM. Osteodystrophy in experimental uremia. Contrib Nephrol 1988; 60: 207–213
- Kraft K, Barsotti G, Giovannetti S, Wetzel E, Gretz N, Strauch M. Renal bone disease in chronic uremic rats. Contrib Nephrol 1988; 60: 214–219
- Jablonski G, Klem KH, Attramadal A, Dahl E, Ronningen H, Gautvik KM, Haug E, Gordeladze JO. Surgically induced uremia in rats. I: Effect on bone strength and metabolism. Biosci Rep 1993; 13: 275–287
- Jablonski G, Danielsen CC, Mosekilde L, Gordeladze JO. Surgically induced uremia in rats. II: Osseous PTH-susceptible signaling systems as predictors of bone resorption. Calcif Tissue Int 1994; 55: 281–287
- Jablonski G, Mortensen BM, Klem KH, Mosekilde L, Danielsen CC, Gordeladze JO. Vitamin D3 analogs and salmon calcitonin partially reverse the development of renal osteodystrophy in rats. Calcif Tissue Int 1995; 57: 385–391
- Moscovici A, Bernheim J, Popovtzer MM, Rubinger D. Renal osteodystrophy in rats with reduced renal mass. Nephrol Dial Transplant 1996; 11(Suppl. 3)146–152
- Lopez HW, Leenhardt F, Coudray C, Remesy C. Minerals and phytic acid interactions: is it a real problem for human nutrition?. International Journal for Food Science and Technology 2002; 37: 727–739
- Rimbach G, Pallauf J, Brandt K, Most E. Effect of phytic acid and microbial phytase on Cd accumulation, Zn status, and apparent absorption of Ca, P, Mg, Fe, Zn, Cu, and Mn in growing rats. Ann Nutr Metab 1995; 39: 361–370
- Pallauf J, Rimbach G. Nutritional significance of phytic acid and phytase. Arch Tierernahr 1997; 50: 301–319
- Schrooten I, Cabrera W, Goodman WG, Dauwe S, Lamberts LV, Marynissen R, Dorrine W, De Broe ME, D'Haese PC. Strontium causes osteomalacia in chronic renal failure rats. Kidney Int 1998; 54: 448–456
- Tietz NW, Rinker AD, Shaw LM. IFCC methods for the measurement of catalytic concentration of enzymes Part 5. IFCC method for alkaline phosphatase (orthophosphoric-monoester phosphohydrolase, alkaline optimum, EC 3.1.3.1). J Clin Chem Clin Biochem 1983; 21: 731–748
- Parfitt AM, Drezner MK, Glorieux FH, Kanis JA, Malluche H, Meunier PJ, Ott SM, Recker RR. Bone histomorphometry: standardization of nomenclature, symbols, and units. Report of the ASBMR Histomorphometry Nomenclature Committee. J Bone Miner Res 1987; 2: 595–610
- Bover J, Rodriguez M, Trinidad P, Jara A, Martinez ME, Machado L, Llach F, Felsenfeld AJ. Factors in the development of secondary hyperparathyroidism during graded renal failure in the rat. Kidney Int 1994; 45: 953–961
- Hernandez A, Concepcion MT, Rodriguez M, Salido E, Torres A. High phosphorus diet increases preproPTH mRNA independent of calcium and calcitriol in normal rats. Kidney Int 1996; 50: 1872–1878
- Slatopolsky E, Brown A, Dusso A. Role of phosphorus in the pathogenesis of secondary hyperparathyroidism. Am J Kidney Dis 2001; 37: S54–S57
- Moallem E, Kilav R, Silver J, Naveh-Many T. RNA-protein binding and post-transcriptional regulation of parathyroid hormone gene expression by calcium and phosphate. J Biol Chem 1998; 273: 5253–5259
- Slatopolsky E, Caglar S, Pennell JP, Taggart DD, Canterbury JM, Reiss E, Bricker NS. On the pathogenesis of hyperparathyroidism in chronic experimental renal insufficiency in the dog. J Clin Invest 1971; 50: 492–499
- Somerville PJ, Kaye M. Evidence that resistance to the calcemic action of parathyroid hormone in rats with acute uremia is caused by phosphate retention. Kidney Int 1979; 16: 552–560
- Naveh-Many T, Silver J. Regulation of parathyroid hormone gene expression by hypocalcemia, hypercalcemia, and vitamin D in the rat. J Clin Invest 1990; 86: 1313–1319
- Portale AA, Booth BE, Halloran BP, Morris RC, Jr. Effect of dietary phosphorus on circulating concentrations of 1,25-dihydroxyvitamin D and immunoreactive parathyroid hormone in children with moderate renal insufficiency. J Clin Invest 1984; 73: 1580–1589
- Silver J, Naveh-Many T, Mayer H, Schmelzer HJ, Popovtzer MM. Regulation by vitamin D metabolites of parathyroid hormone gene transcription in vivo in the rat. J Clin Invest 1986; 78: 1296–1301
- Bover J, Jara A, Trinidad P, Rodriguez M, Felsenfeld AJ. Dynamics of skeletal resistance to parathyroid hormone in the rat: effect of renal failure and dietary phosphorus. Bone 1999; 25: 279–285
- Brown AJ, Ritter CS, Finch JL, Slatopolsky EA. Decreased calcium-sensing receptor expression in hyperplastic parathyroid glands of uremic rats: role of dietary phosphate. Kidney Int 1999; 55: 1284–1292
- Lopez-Hilker S, Dusso AS, Rapp NS, Martin KJ, Slatopolsky E. Phosphorus restriction reverses hyperparathyroidism in uremia independent of changes in calcium and calcitriol. Am J Physiol 1990; 259: F432–F437
- Naveh-Many T, Rahamimov R, Livni N, Silver J. Parathyroid cell proliferation in normal and chronic renal failure rats. The effects of calcium, phosphate, and vitamin D. J Clin Invest 1995; 96: 1786–1793
- Mehls O, Ritz E, Gilli G, Schmidt-Gayk H, Krempien B, Kourist B, Wesch H, Prager P. Skeletal changes and growth in experimental uremia. Nephron 1977; 18: 288–300
- Couttenye MM, D'Haese PC, Van Hoof VO, Lemoniatou E, Goodman W, Verpooten GA, De Broe ME. Low serum levels of alkaline phosphatase of bone origin: a good marker of adynamic bone disease in haemodialysis patients. Nephrol Dial Transplant 1996; 11: 1065–1072
- Bervoets AR, Spasovski GB, Behets GJ, Dams G, Polenakovic MH, Zafirovska K, Van Hoof VO, De Broe ME, D'Haese PC. Useful biochemical markers for diagnosing renal osteodystrophy in predialysis end-stage renal failure patients. Am J Kidney Dis 2003; 41: 997–1007
- Loeb WF, Carakostas MC. Changes in serum biochemistry. Pathobiology of the Aging Rat, U Mohr, DL Dungworth, CC Capen. ILSI Press, Washington, DC 1992; 7–13
- Neves KR, Graciolli FG, dos Reis LM, Pasqualucci CA, Moyses RM, Jorgetti V. Adverse effects of hyperphosphatemia on myocardial hypertrophy, renal function, and bone in rats with renal failure. Kidney Int 2004; 66: 2237–2244
