
Abstract
The purpose of this study is to investigate the changing spectrum and clinicopathologic correlation of biopsy-proven renal diseases in central China. We retrospectively analyzed data of 4931 patients who underwent renal biopsy in ten hospitals between September 1994 and December 2014. Among them, 81.55% were primary glomerular diseases (GD), and 13.02% were secondary GD. IgA nephropathy (IgAN) was the most common primary GD (43.45%), followed by focal glomerulonephritis (16.79%), mesangial proliferative glomerulonephritis (MsPGN, 14.35%), and membranous nephropathy (MN, 13.28%). IgAN was leading primary GD in patients under 60 years old, while MN was the leading one over 60 years old. The most frequent secondary GD was lupus nephritis (LN) (47.35%). The prevalence of IgAN, MN and minimal change disease was found to increase significantly (p < 0.001, p < 0.001, and p < 0.01, respectively), while that of MsPGN, membranoproliferative glomerulonephritis and LN decreased significantly (p < 0.001, p < 0.001, and p < 0.05, respectively). The main indication for renal biopsy was proteinuria and hematuria (49.03%), followed by nephrotic syndrome (NS, 20.36%). IgAN was the most common cause in patients with proteinuria and hematuria, chronic-progressive kidney injury, hematuria and acute kidney injury; and MN was the leading cause of NS. Primary GD remained the predominant renal disease in central China. IgAN and LN were the most prevalent histopathologic lesions of primary and secondary GD, respectively. The spectrum of biopsy-proven renal disease had a great change in the past two decades. Proteinuria and hematuria was the main indication for renal biopsy.
Introduction
Chronic kidney disease (CKD) has become a worldwide public health problem, which cannot be too much emphasized, for its increasing incidence and prevalence, poor outcomes, and high associated cost. The prevalence of CKD is 10.8% in China and 14.2% in central China.Citation1 Chronic glomerulonephritis remain the most common cause of end-stage renal disease (ESRD) in China, in spite of the increasing prevalence of diabetic nephropathy and hypertensive nephropathy.Citation2,Citation3 Data from renal biopsy also demonstrates that glomerulonephritis, primary glomerular disease (GD) in particular, is the leading cause of CKD.Citation4,Citation5
It is known that the distribution patterns of renal diseases with renal biopsy differ in the world, and primary GD remain the leading renal diseases. IgA nephropathy (IgAN) is the most common primary GD in AsiaCitation4–8 and Europe,Citation9,Citation10 while the most frequent primary GD is focal segmental glomerulosclerosis (FSGS) in USACitation11 and Brazil.Citation12,Citation13 Recently, an increasing number of studies demonstrate that the spectrum of biopsy-proven renal diseases has changed over the past three decades in other countiesCitation7,Citation11,Citation13–23 and in northern and southern China.Citation4,Citation8,Citation24,Citation25 Nephrotic syndrome (NS) is reported to be the main indication for renal biopsy in other countriesCitation10,Citation12,Citation14,Citation22 and northern China,Citation4,Citation24,Citation26 except Japan,Citation6 where the leading indication is asymptomatic proteinuria and/or hematuria. However, limited information is available on changing spectrum and clinicopathologic correlation of biopsy-proven renal diseases in central China. Therefore, we retrospectively analyzed the data collected from all the patients with renal biopsy in ten hospitals in central China over the last 20 years, in order to investigate the renal disease spectrum composition and evolution trend, and the clinicopathologic features as well.
Patients and methods
Patients
4931 patients with native renal biopsies performed in ten hospitals in central China (Tongji Hospital Affiliated to Huazhong University of Science and Technology, Puai Hospital Affiliated to Huazhong University of Science and Technology, Zhongnan Hospital of Wuhan University, Puren Hospital Affiliated to Wuhan University of Science and Technology, Hubei Provincial Traditional Chinese Medical Hospital, Central Hospital of Wuhan, Fourth Hospital of Wuhan, Fifth Hospital of Wuhan, Wuhan General Hospital of Guangzhou Military Region, the 161 Hospital of PLA, Qianjiang City Central Hospital and Enshi Central Hospital) were retrospectively analyzed during the period from September 1994 and December 2014. Clinical and laboratory data were collected by reviewing clinical records, including demographic information (age and sex), physical presentation (presence of edema and hypertension), and laboratory data (urinalysis, serum creatinine, serum albumin and 24-h urinary protein excretion).
Indications for renal biopsy were as follows:Citation27 (1) NS: proteinuria >3.5 g/d, with edema and/or hypoalbuminemia (serum albumin <35 g/L), with or without hematuria, and without AKI. (2) Acute kidney injury (AKI): the clinical presentation described was AKI, acute renal failure, rapidly progressive glomerulonephritis, acute or chronic renal failure; or AKI was presumed: (1) serum creatinine (SCr) doubled in patients whose renal function was normal before, (2) SCr increased to 150% over one year in patients who had chronic kidney disease, and (3) SCr >2 mg/dL, with baseline renal function unknown; with or without proteinuria and/or hematuria. (4) AKI and NS: AKI plus NS. (5) Chronic-progressive kidney injury (CKI): the degree of decline in renal function did not reach that of AKI, with or without proteinuria and/or hematuria. Patients with NS and CKI were classified as NS. (6) Proteinuria (without NS): Proteinuria <3.5 g/d, or proteinuria >3.5 g/d without edema or hypoalbuminemia, without hematuria, and without significant decline in renal function. (7) Hematuria: The number of erythrocytes per high-power field on microscopic examination of the urine >5, or urinary occult blood test was positive, without hematuria, and without significant decline in renal function. (8) Proteinuria and Hematuria: proteinuria plus hematuria, and without significant decline in renal function.
All renal biopsy specimens were prepared by the same group of technicians in Department of Nephrology in Tongji Hospital Affiliated to Huazhong University of Science and Technology. Light microscopy, immunofluorescence (using fluorescence-labeled mouse anti-human IgG, IgM, IgA, C3, C4, and C1q antibodies) and electron microscopy (EM) were performed routinely for pathological examinations of biopsy specimen. The pathologic diagnostic criteria have remained consistent over the whole 20 years. When new entities were recognized or new diagnostic criteria appeared, previous diagnosis was updated one by one according to the new criteria. According to histologic classification of renal diseases used the 1995 World Health Organization recommendations in combination with clinic manifestation and laboratory examination, renal diseases were divided into eight groups: (1) primary GD including IgAN, minimal change disease (MCD), FSGS, membranous nephropathy (MN), mesangial proliferative glomerulonephritis (MsPGN), membranoproliferative glomerulonephritis (MPGN), endocapillary proliferative glomerulonephritis (EnPGN), crescentic glomerulonephritis (CreGN), glomerular minor lesion (GML), and focal glomerulonephritis (FGN); (2) Secondary GD including lupus nephritis (LN), Henoch-Schönlein purpura nephritis (HSPN), hepatitis B virus associated nephritis (HBV-GN), diabetic nephropathy (DN), amyloidosis nephropathy (AN), obesity-related glomerulopathy (ORG), ischemic nephropathy (IN), systemic vasculitis-associated renal damage (SVARD), and so on; (3) Tubular-interstitial diseases including acute and chronic tubulointerstitial nephritis and acute tubular necrosis; (4) Hereditary and congenital renal diseases including Alport syndrome (AS), thin basement membrane nephropathy (TBMN), Fabry disease and so on; (5) Rare renal disease including fibrillary glomerulopathy, collagen III glomerulopathy, glomerulocystic kidney disease, lipoprotein nephropathy and so on; (6) Sclerosing glomerulonephritis (SGN); (7) Transplantation-associated renal disease; (8) Other nephropathies were defined as unqualified morphological changes for WHO classification.
The patients were grouped according to a 5-year interval, 1994–1999 (period 1), 2000–2004 (period 2), 2005–2009 (period 3) and 2010–2014 (period 4), and divided into four age groups for stratified analysis: ≤14 years, 15–44 years, 45–59 years and ≥60 years.
Statistical analysis
Data were stored on a database file, and analyzed by using IBM SPSS (SPSS version 19.0; IBM Corp, Armonk, NY). Continuous variables were reported as mean ± SD, and analyzed using the Student’s t-test. Categorical variables were analyzed using the χ2 test and Fisher’s exact test. p < 0.05 was considered to be statistically significant.
Results
Demographic feature of patients with renal biopsy
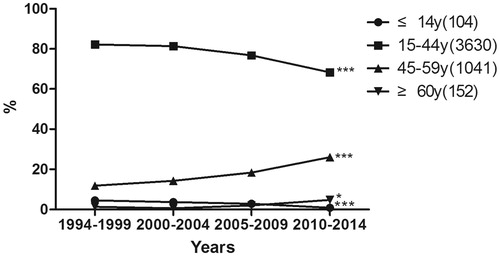
From September 1994 to December 2014, 4931 renal biopsy specimens from 10 different hospitals were collected into analysis. As shown in , the number of patients receiving renal biopsy during the four periods increased significantly, from 219 cases in period 1 to 2360 cases in period 4. Among them, 2254 patients (45.7%) were men. The gender distribution among primary GD was almost balanced (male in 46.5%), but male sex was more prevalent in MN, FSGS, MPGN and EnPGN, except IgAN; while secondary GD were frequent among females (61.2%), LN in particular. The average age of patients when they underwent renal biopsy was 35.2 (12.5) years (ranged 10–76 years), and it increased progressively along the periods, that is, 31.4 ± 11.4, 32.1 ± 11.3, 34.1 ± 12.0, and 37.3 ± 13.0 years in period 1, 2, 3, and 4, respectively (p < 0.001), and the percentage of elderly patients (≥ 60 years old) increased from 1.37% in period 1 to 4.75% in the in the period 4 (p < 0.05) ().
Figure 1. Number of renal biopsy cases (1994–2014).
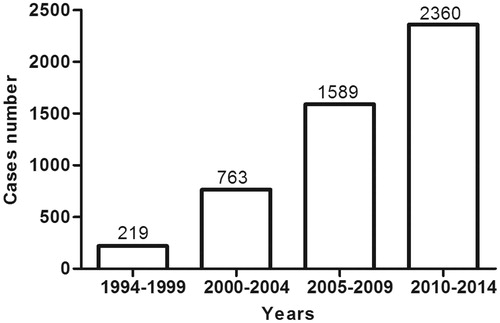
Figure 2. Proportion of patients with renal biopsy at different ages in different periods. *p < 0.05 and ***p < 0.001.
Distribution of biopsy-proven renal diseases
As shown in , primary GD were the most predominant renal diseases and accounted for 81.55% of the patients who had renal biopsy in our study, followed by secondary GD (13.02%), sclerosing glomerulonephritis (SGN, 2.09%), tubular-interstitial nephropathies (1.09%). Hereditary renal disease, rare renal disease, transplantation-associated renal disease and unclassified renal disease contributed only a small part, that is, 0.85%, 0.32%, 0.43% and 0.69%, respectively. The prevalence of primary glomerular disease, 82.25% in the period 4, did not change, as compared with 78.54% in period 1 (p = 0.173). However, the diagnosis of secondary GD increased from 9.13% in period 1 to 14.15% in period 4 (p < 0.05). On the contrary, the proportion of SGN and unclassified renal disease decreased from 4.11% and 5.48% in period 1 to 0.47% and 0.21% in period 4 (p < 0.001, p < 0001, respectively).
Table 1. Classification of renal diseases based on 4931 renal biopsies.
Prevalence of primary and secondary GD
Among 4021 cases of primary GD, IgAN was the most prevalent histopathologic lesion accounting for 43.45%. FGN was the second one (16.79%), followed by MsPGN (14.35%), MN (13.28%), GML (3.88%), FSGS (3.63%), MCD (1.82%), MPGN (1.22%), EnPGN (0.77%) and CreGN (0.72%), as shown in .
Table 2. Prevalence of primary GD.
shows the distribution of 642 cases of secondary GD. LN was the most common pathological type diagnosed as secondary GD (47.35%), and the second and third one were HSPN (18.85%) and HBV-GN (10.59%), followed by DN (4.83%), ischemic nephropathy (IN, 4.05%), ORG (3.89%), Benign/malignant hypertension associated renal damage (B/MHTARD, 3.43%), amyloidosis nephropathy (AN, 2.65%) and so on.
Table 3. Prevalence of secondary GD.
Changing spectrum of primary and secondary GD in different periods
As indicated in , the frequency of IgAN, the most common primary GD, increased significantly along the periods (7.56%, 35.52%, 44.65% and 48.17% in period 1, 2, 3 and 4, respectively, p < 0.001), while that of MsPGN and MPGN decreased significantly (p < 0.001, p < 0.001, respectively). The frequency of MN remained stable during period 1 and 2 (5.23% and 6.21%) and increased to 8.89% in period 3 and 19.11% in period 4 (p < 0.05, p < 0.001, respectively). Additionally, the frequency of MCD increased from 0.34% in period 2 to 1.36% in period 3 and 2.68% in period 4 (p < 0.05, p < 0.001, respectively). FGN had a significant proportion decrease in period 4, when compared with that in period 2 and period 3 (p < 0.001). The proportion of FSGS and GML did not show any trends along the periods, in another word, the proportion of FSGS increased from 1.74% in period 1 and 1.55% in period 2 to 5.57% in period 3 (p < 0.05, p < 0.001, respectively), but then it decreased to 3.09% in period 4 (p < 0.001); while that of GML decreased from 9.88% in period 1 to 0.86% in period 2 (p < 0.001), and then increased to 2.26% in period 3 and 5.36% in period 4 (p < 0.05, p < 0.001, respectively). There was no significant variation in the proportion of CreGN and EnPGN along the periods (p > 0.05).
Figure 3. Prevalence of various primary and secondary GD according to periods. Panel A shows the changing spectrum of primary GD between 1994 and 2014, and panel B shows that of secondary GD. *p < 0.05, **p < 0.01, and ***p < 0.001.
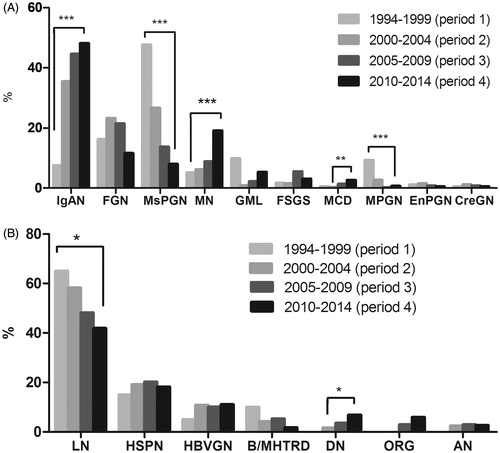
LN was the most prevalent secondary glomerular disease, and its frequency decreased from 65.00% in period 1 to 41.92% in period 2 (p < 0.05). There were no patients receiving renal biopsy during period 1 diagnosed as DN, so did AN. The proportion of DN increased from 1.67% in period 2 to 6.89% in period 4 (p < 0.05), while that of AN remained stable during the last three periods, that is, 2.50%, 2.98%, and 2.69%, respectively. Moreover, no patients were diagnosed as ORG, IN, or thrombotic microangiopathy (TMA) during period 1 and 2. The proportion of ORG was 2.98% and 5.99% in period 3 and 4. There was no significant change in the proportion of HSPN, SVARD, B/MHTARD and HBV-GN, however, the proportion of B/MHTARD decreased from 10.00% in period 1 to 1.80% in period 4 and that of HBV-GN increased from 5.00% in period 1 to 11.08% in period 4 (p > 0.05, p > 0.05, respectively) ().
Spectrum of primary and secondary GD after age stratification
As shown in , in patients ≤14 years old, the common form of primary GD was IgAN (32.91%), followed by MsPGN (29.11%), EnPGN (10.13%), FGN (8.86%), and GML (7.59%). In the 15–45-year-old group, IgAN was still the most prevalent type of primary GD, accounting for 48.12%, followed by FGN (15.55%), MsPGN (14.88%) and MN (8.99%). Furthermore, in the 45–59-year-old group, IgAN remained the leading primary GD (31.48%), and MN was the second one (25.81%), followed by FGN (21.71%) and MsPGN (11.82%). In elderly patients aged ≥60 years, MN was the most common PGD (39.83%), followed by FGN (18.64%), IgAN (14.41%) and MsPGN (8.47%).
Figure 4. Prevalence of various primary and secondary GD according to age. Panel A shows the spectrum of primary GD after age stratification, and panel B shows that of secondary GD.
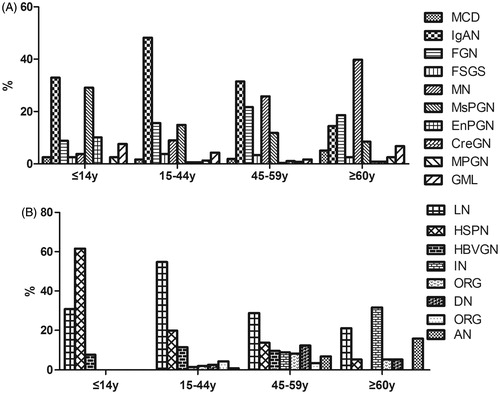
In patients ≤14 years old, HSPN was the most predominant secondary GD (61.54%), followed by LN (30.77%) and HBV-GN (7.69%). In the 15–45-year-old group, LN was the main secondary GD (54.74%), followed by HSPN (19.83%) and HBV-GN (11.42%). In the 45–59-year-old group, LN remained the most common secondary GD (28.77%), followed by HSPN (13.70%), DN (12.33%) and HBV-GN (9.59%). However, in elderly patients aged ≥60 years, the most prevalent secondary GD was IN (31.58%), followed by LN (21.05%) and AN (15.79%) ().
Clinical and pathologic correlation of biopsy-proven renal disease
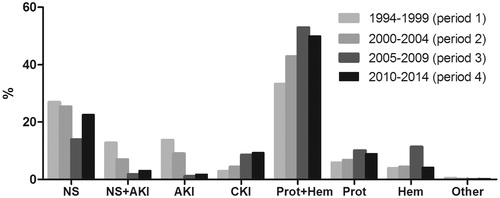
Proteinuria and hematuria was the main indication for renal biopsy, making up almost half of the cause of renal biopsy (49.03%), and NS was the second common indications (20.36%), followed by isolated proteinuria (8.82%), CKI (7.94%), isolated hematuria (6.64%), NS coexisted AKI (3.76%) and AKI (3.31%). Otherwise, 0.16% was due to other reasons. showed the clinical indications for renal biopsy according to periods.
Figure 5. The clinical indications for renal biopsy according to periods.
The clinic and pathologic correlation of major types of biopsy-proven renal disease was shown in . MN, GML, MCD and AN were mainly manifested as NS, whether AKI coexisted or not (61.2%, 54.9%, 82.9% and 56.3%, respectively). IgAN, FGN and EnPGN presented predominantly as proteinuria and hematuria (67.4%, 50.2% and 53.9%, respectively), so did LN (44.9%), HSPN (73.9%), HBV-GN (49.2%), DN (54.4%) and AS (52.9%). FSGS and MsPGN mainly presented as proteinuria and hematuria (40.0% and 39.0%, respectively) and NS (38.6% and 33.7%, respectively). ORG frequently manifested as isolated proteinuria (47.8%), TBMN as isolated hematuria (50.0%), and SGN as CKI (72.7%).
Table 4. The clinicopathologic correlation of biopsy-proven renal diseases.
On the other hand, MN was the most frequent diagnose with patients presented with NS (32.71%), followed by MsPGN (15.80%) and IgAN (9.28%). In patients biopsied for NS and AKI, the most common diagnose were MsPGN (18.56%), IgAN (17.37%), FGN (11.38%) and LN (8.38%). In addition, LN was common cause for patients with AKI (12.24%) and CKI (11.05%).
EM tests for pathological diagnosis of renal biopsies
The EM was routinely performed in all 4931 patients with renal biopsies, and EM was essential for making the diagnosis in 138 cases (2.80%). Among them, MCD was the most common renal diseases in which electron microscopy was essential for diagnosis, accounting for 52.90% (73/138), followed by Alport syndrome (AS, 17.39%), AN (12.32%), TBMN (12.32%), dense deposit disease (1.45%), fibrillary glomerulopathy (1.45%), collagen III glomerulopathy (0.72%), Fabry disease(0.72%) and immunotactoid glomerulopathy (0.72%).
Discussion
In this study, clinical and pathological data of 4931 patients performed renal biopsy from several hospitals in central China between 1994 and 2014 was analyzed. Due to the improvement in economic conditions, enhancement of health consciousness and advancement in technology level and safety of renal biopsy, the number of patients receiving renal biopsy was increased dramatically during the four periods, as well as the average age when renal biopsy performed and the number of patients over 60 years old (p < 0.05), consistent with the reports from Beijing and Shanghai.Citation4,Citation25 Interestingly, the patients with renal biopsy in our study was female dominated (54.3%), that was different from others in ChinaCitation4,Citation8,Citation25,Citation26 except Harbin,Citation24 and regional differences may be the main reason.
It has been reported that NS was the main indication for renal biopsy in other countriesCitation10,Citation12,Citation14,Citation22 and northern China.Citation4,Citation24,Citation26 However, in our study, we found that proteinuria and hematuria rather than NS was the most frequent cause for renal biopsy, making up almost half of the patients (49.03%), and NS ranked the second (20.36%).
There was no doubt that primary GD was the most common renal diseases, accounting for 81.55% in our study, and it was within the range of 61.7–82.7% reported from other centers in China.Citation4,Citation5,Citation8,Citation25,Citation26 No significant change in the prevalence of primary GD was found in our study, while the prevalence of secondary GD increased (9.13% in period 1 versus 14.15% in period 4) (p < 0.05), probably because of the improvement in the recognition of these diseases and diagnostic technology, and its substantial change as well.
The frequency of IgAN was markedly different because of regional differences, with the highest in Asian countries (36.7–54.3%),Citation4–8 modest in the USACitation19 and European,Citation9,Citation10 and lower in Tunisia,Citation28 explained by not only the different policies in renal biopsy policyCitation6 but also racial or ethnic difference.Citation29 Gharavi AG et alCitation30 identified five susceptibility loci of IgAN and found that the protective allele frequencies were lowest in Asians, intermediate in Europeans and highest in Africans, while that of risk alleles were opposite, closely paralleling the frequency of IgAN. The current result showed that IgAN was the leading histopathologic lesion of primary GD (43.45%). The frequency of IgA nephropathy significantly increased along the periods (7.56%, 35.52%, 44.65% and 48.17% in period 1, period 2, period 3 and period 4, respectively, p < 0.001), and this finding was consistent with that from ChinaCitation4,Citation8 and other countries such as USA,Citation20,Citation23 TunisiaCitation28 and Singapore.Citation7 The race differences as well as the environmental factors were thought to underlie the changing trend. The highest frequency of IgAN was observed in 15–45-year-old group, accounting for 48.12%, while that of the elderly patients over 60 years old was only 14.41%. Due to the remarkable number of patients diagnosed as IgAN, it was the most prevalent cause in patients with AKI (17.01%), CKI (43.91%), proteinuria and hematuria (48.81%), and isolated hematuria (39.32%).
Idiopathic membranous nephropathy (IMN), a common type of primary GD, was an antibody-mediated GD, and renal biopsy was still the golden standard. Beck LHCitation31 found that M-Type Phospholipase A2 Receptor (PLA2R) was the main target antigen in IMN and approximately 70% of the patients with IMN were seropositive for anti-PLA2R antibodies, and Tomas NMCitation32 revealed that thrombospondin type-1 domain-containing 7A (THSD7A) was another target antigen in IMN and serum antibody against THSD7A was positive in the rest 2.5 to 5% of the patients with IMN. A meta-analysis showed that the diagnostic sensitivity and specificity of serum anti-PLA2R antibodies for IMN were 78% and 99% and made it a potentially effective tool for the diagnosis of IMN, which was less invasive and easier to take and detect than renal biopsy.Citation33 The frequency of MN was 13.28% in our study, within the range (9.89–16.7%) in China;Citation4,Citation5,Citation8,Citation25,Citation26 moreover, it instead of IgAN became the most frequent primary GD in patients over 60 years old (39.83%). With changes in the environment, the spectrum of renal diseases, drug use, and aging of the population receiving renal biopsy, an increasing prevalence of MN was found in our study, from 5.23% in period 1 to 19.11% in period 4, and this trend had also been reported from other centers in China,Citation8,Citation25 Singapore,Citation7 TunisiaCitation28 and Spain.Citation22 MN was the most frequent diagnoses in patients presented with NS.
Furthermore, MCD, one of the most frequent types of primary GD in western countries, contributed only 1.82% in our study, similar to that in Nanjing (0.93%),Citation5 but it was significantly lower than that in other China areas (9.3–30.7%)Citation4,Citation5,Citation24–26 and other countries.Citation7,Citation10–12,Citation14,Citation15 Nevertheless, we found that there was a gradual increase in MCD, from 0.34% in period 2 to 2.68% in period 4 (p < 0.001), and this phenomenon could be observed in other study of China.Citation4,Citation8,Citation24,Citation25 MCD mainly manifested as NS (68.57%), while the most frequent cause of patients presented with NS coexisted AKI was MsPGN (18.56%). With the improvement in diagnostic level, some histopathologic lesion presenting as mesangial proliferation was given a clear diagnosis, and as a result, the proportion of MsPGN was confirmed to decline significantly along the periods (47.67% in period 1 versus 8.09% in period 4) (p < 0.001), consistent with others in China.Citation8,Citation25 MPGN was also found to decrease significantly (9.30% in period 1 versus 0.72% in period 4) (p < 0.001), which had been reported since 1985,Citation14–17,Citation20,Citation28 because of the improvement in standards of living and public health, as well as the early effective treatment of infections. Changing trend of FSGS that was reported to increase in other countries,Citation11,Citation13,Citation14,Citation18–21,Citation23 was controversial in our study, for the proportion of FSGS increased from 1.74% in period 1 and 1.55% in period 2 to 5.57% in period 3 (p < 0.05, p < 0.001, respectively) and then decreased to 3.09% in period 4 (p < 0.001). Additionally, there was no significant variation in the proportion of EnPGN and CreGN along the periods (p > 0.05)
The most common pathological type of secondary GD type was LN (47.35%), and LN was the mainly secondary GD in the 15–45-year-old group (54.74%) and the 45–59-year-old group (28.77%), moreover, LN was common cause in patients with AKI (12.24%) and CKI (11.05%). However, its proportion decreased from 65.00% in period 1 to 41.92% in period 4 (p < 0.05). HSPN was the second most common secondary GD without statistically significant difference along the periods. In patients ≤14 years old, HSPN was the most predominant secondary GD (61.54%). Due to the high incidence of hepatitis B virus infection and the fact that ∼20% of patients with HBV infection develop extrahepatic manifestations, HBV-GN was also a common secondary GD, accounting for 10.59%. With the rapid development in economy, improvement in living standard and change in life style, more and more people suffered from diabetes and obesity in China. The prevalence of diabetes was 2.5% and that of impaired glucose tolerance was 3.2% in 1994,Citation34 while by 2008, the prevalence of total diabetes and prediabetes were 9.7% and 15.5%.Citation35 The combined prevalence of overweight and obesity in adults increased from 20% in 1992 to 29.9% in 2002.Citation36 Meanwhile, the frequency of DN and ORG showed an increasing trend, and this trend was observed in our study.
In summary, primary GD remained the leading real disease in central China, and proteinuria and hematuria rather than NS was the main indication for renal biopsy. IgAN and LN were the most common primary and secondary GD, respectively. The spectrum of renal disease had a great change in the last two decades. The frequency of IgAN, MN and MCD has increased significantly; on the contrary, that of MsPGN, MPGN and LN has decreased significantly.
Funding information
This work was supported by the National Natural Science Foundation of China (NSFC) (Nos. 8120053, 81470948 and 81270770).
Disclosure statement
The authors report no conflicts of interest. The authors alone are responsible for the content and writing of the paper.
References
- Zhang L, Wang F, Wang L, et al. Prevalence of chronic kidney disease in China: A cross-sectional survey. Lancet. 2012;379:815–822.
- Yao Q, Zhang W, Qian J. Dialysis status in China: A report from the Shanghai Dialysis Registry (2000–2005). Ethn Dis. 2009;19:S1–S23.
- Zuo L, Wang M. Current status of hemodialysis treatment in Beijing, China. Ethn Dis. 2006;16:S2–S31.
- Zhou FD, Zhao MH, Zou WZ, et al. The changing spectrum of primary glomerular diseases within 15 years: A survey of 3331 patients in a single Chinese centre. Nephrol Dial Transplant. 2009;24:870–876.
- Li LS, Liu ZH. Epidemiologic data of renal diseases from a single unit in China: Analysis based on 13,519 renal biopsies. Kidney Int. 2004;66:920–923.
- Disease RGoPCR. Nationwide and long-term survey of primary glomerulonephritis in Japan as observed in 1,850 biopsied cases. Research group on progressive chronic renal disease. Nephron. 1999;82:205–213.
- Woo KT, Chiang GS, Pall A, et al. The changing pattern of glomerulonephritis in Singapore over the past two decades. Clin Nephrol. 1999;52:96–102.
- Zhang X, Liu S, Tang L, et al. Analysis of pathological data of renal biopsy at one single center in China from 1987 to 2012. Chin Med J (Engl). 2014;127:1715–1720.
- Schena FP. Survey of the Italian registry of renal biopsies. Frequency of the renal diseases for 7 consecutive years. The Italian group of renal immunopathology. Nephrol Dial Transplant. 1997;12:418–426.
- Rychlik I, Jancova E, Tesar V, et al. The Czech registry of renal biopsies. Occurrence of renal diseases in the years 1994-2000. Nephrol Dial Transplant. 2004;19:3040–3049.
- Braden GL, Mulhern JG, O'Shea MH, et al. Changing incidence of glomerular diseases in adults. Am J Kidney Dis. 2000;35:878–883.
- Polito MG, de Moura LA, Kirsztajn GM. An overview on frequency of renal biopsy diagnosis in Brazil: Clinical and pathological patterns based on 9,617 native kidney biopsies. Nephrol Dial Transplant. 2010;25:490–496.
- Bahiense-Oliveira M, Saldanha LB, Mota EL, et al. Primary glomerular diseases in Brazil (1979-1999): Is the frequency of focal and segmental glomerulosclerosis increasing? Clin Nephrol. 2004;61:90–97.
- Narasimhan B, Chacko B, John GT, et al. Characterization of kidney lesions in Indian adults: Towards a renal biopsy registry. J Nephrol. 2006;19:205–210.
- Simon P, Ramee MP, Autuly V, et al. Epidemiology of primary glomerulopathies in a French region. Variations as a function of age in patients. Nephrologie. 1995;16:191–201.
- Progressively decreasing incidence of membranoproliferative glomerulonephritis in Spanish adult population. A multicentre study of 8,545 cases of primary glomerulonephritis. Study group of the Spanish society of nephrology. Nephron. 1989;52:370–371.
- Barbiano di Belgiojoso G, Baroni M, Pagliari B, et al. Is membranoproliferative glomerulonephritis really decreasing? A multicentre study of 1,548 cases of primary glomerulonephritis. Nephron. 1985;40:380–381.
- D'Agati V. The many masks of focal segmental glomerulosclerosis. Kidney Int. 1994;46:1223–1241.
- Dragovic D, Rosenstock JL, Wahl SJ, et al. Increasing incidence of focal segmental glomerulosclerosis and an examination of demographic patterns. Clin Nephrol. 2005;63:1–7.
- Haas M, Meehan SM, Karrison TG, et al. Changing etiologies of unexplained adult nephrotic syndrome: A comparison of renal biopsy findings from 1976-1979 and 1995-1997. Am J Kidney Dis. 1997;30:621–631.
- Haas M, Spargo BH, Coventry S. Increasing incidence of focal-segmental glomerulosclerosis among adult nephropathies: A 20-year renal biopsy study. Am J Kidney Dis. 1995;26:740–750.
- Rivera F, Lopez-Gomez JM, Perez-Garcia R. Frequency of renal pathology in Spain 1994-1999. Nephrol Dial Transplant. 2002;17:1594–1602.
- Swaminathan S, Leung N, Lager DJ, et al. Changing incidence of glomerular disease in Olmsted County, Minnesota: A 30-year renal biopsy study. Clin J Am Soc Nephrol. 2006;1:483–487.
- Wu YQ, Wang Z, Xu HF, et al. Frequency of primary glomerular disease in northeastern China. Braz J Med Biol Res. 2011;44:810–813.
- Pan X, Xu J, Ren H, et al. Changing spectrum of biopsy-proven primary glomerular diseases over the past 15 years: A single-center study in China. Contrib Nephrol. 2013;181:22–30.
- Wang YT, Zhou CY, Zhu TC, et al. Analysis of kidney biopsy data from a single center in the midland rural area of china, 1996-2010. Curr Ther Res Clin Exp. 2013;74:22–25.
- Moutzouris DA, Herlitz L, Appel GB, et al. Renal biopsy in the very elderly. Clin J Am Soc Nephrol. 2009;4:1073–1082.
- Ben Maiz H, Abderrahim E, Ben Moussa F, et al. Epidemiology of glomerular diseases in Tunisia from 1975 to 2005. Influence of changes in healthcare and society. Bull Acad Natl Med. 2006;190:403–416.
- Simon P, Ramee MP, Boulahrouz R, et al. Epidemiologic data of primary glomerular diseases in western France. Kidney Int. 2004;66:905–908.
- Gharavi AG, Kiryluk K, Choi M, et al. Genome-wide association study identifies susceptibility loci for IgA nephropathy. Nat Genet 2011;43:321–327.
- Beck LH Jr, Bonegio RG, Lambeau G, et al. M-type phospholipase A2 receptor as target antigen in idiopathic membranous nephropathy. N Engl J Med. 2009;361:11–21.
- Tomas NM, Beck LH Jr, Meyer-Schwesinger C, et al. Thrombospondin type-1 domain-containing 7A in idiopathic membranous nephropathy. N Engl J Med 2014;371:2277–2287.
- Du Y, Li J, He F, et al. The Diagnosis accuracy of PLA2R-AB in the diagnosis of idiopathic membranous nephropathy: A meta-analysis. PLoS One. 2014;9:1–7.
- Pan XR, Y W, Li GW, Liu J. Prevalence of diabetes and its risk factors in China, 1994. National diabetes prevention and control cooperative group. Diabetes Care. 1997;20:1664–1669.
- Yang W, Lu J, The China National Diabetes and Metabolic Disorders Study Group, et al. Prevalence of diabetes among men and women in China. N Engl J Med. 2010;362:1090–1101.
- Wang Y, Mi J, Shan XY, et al. Is China facing an obesity epidemic and the consequences? The trends in obesity and chronic disease in China. Int J Obes (Lond). 2007;31:177–188.