
Abstract
The kidney is particularly susceptible to ischemia/hypoxia insult while dysfunction of proximal tubular epithelial cells (PTEC) is a primary pathologic hallmark in acute kidney injury. Hypoxia-inducible factor-1 (HIF-1) is a key regulator responsible for cellular hypoxic responses. Therefore, we investigated the effects of HIF-1 suppression, using small interference RNA (siRNA), upon the cell fate of PTEC under hypoxia, and explored the underlying possible molecular mechanism. Hypoxia was induced with hypoxia mimetic cobalt chloride. Our data showed that, in HIF-1α siRNA group, the HK-2 cells growth inhibition and necrosis became worse than those in hypoxia group. However, for apoptosis, no significant difference was observed between them. Consistent with the downregulation of HIF-1α in HIF-1α siRNA group, both mRNA and protein expression of glucose transporter-1 (Glut-1) and vascular endothelial growth factor (VEGF) also reduced more significantly than those in hypoxia group. In conclusion, silencing HIF-1α gene could aggravate growth inhibition and necrosis of PTEC under hypoxia. We provide evidence, from the opposite direction, that HIF-1 activation under hypoxia may facilitate adaptation and survival of proximal renal tubular cells, and the beneficial effects may be related to its downstream genes, such as Glut-1 and VEGF.
Introduction
Renal proximal tubule cell in the outer medulla, which normally exists in a borderline hypoxic environment because of countercurrent circulation and the high metabolic demands, is particularly susceptible to acute ischemic insult.Citation1 Proximal tubular epithelial cell dysfunction is a primary pathological hallmark of ischemic acute renal failure.Citation2 Although hypoxia induces a situation unfavorable for cell growth, cells may undergo a series of genetic and metabolic changes that allow them to survive and even proliferate.Citation3,Citation4 Previous study showed that 89% of genes upregulation induced by hypoxia was hypoxia-inducible factor-1 (HIF-1) dependent.Citation5 The transcription factor HIF-1 including two subunits, HIF-1α and HIF-1β, which is activated under hypoxia and promotes expression of genes involved in cell fate, angiogenesis, and glucose metabolism.Citation6 HIF-1α is subject to ubiquitination and proteosomal degradation under normoxic conditions, whereas HIF-1β protein levels are relatively constant. During hypoxia, HIF-1α accumulates, migrates to the nucleus, associates with HIF-1β, and the complex binds to a hypoxia-response element of target genes. Some studies have demonstrated that activating HIF-1 could protect cells from hypoxia or ischemia-induced death.Citation7,Citation8 However, other studies existing showed that HIF-1 could enhance cell death by upregulation of BH3-only pro-death proteins.Citation9,Citation10 Therefore, the roles of HIF-1 in mediating pro-death or pro-survival are controversial, and may depend on the duration of hypoxic stimuli as well as the cell type.Citation11–13
Ribonucleic acid (RNA) interference (RNAi) recently emerged as an exciting method to knock down the expression of HIF-1α gene specifically and potently.Citation8,Citation14,Citation15 In this study, we aimed at investigating the effects of HIF-1 on cell fate in a human renal proximal tubular epithelial cell under hypoxia using small interference RNA (siRNA) to silence the HIF-1α gene, and explored the possible underlying molecular mechanism.
Materials and methods
Renal proximal tubular epithelial cells culture
HK-2 cells, which were human renal proximal tubular epithelial cells immortalized by transduction with human papilloma virus 16 E6/E7 genes, were obtained from the American Type Culture Collection (ATCC, Manassas, VA). Cells were cultured in Dulbecco’s modified Eagle’s medium (DMEM, Gibco)/Nutrient Mixture F-12 (F-12, Gibco) (1:1) supplemented with 10% fetal bovine serum (FBS, Gibco), 1% antibiotics (100U/mL penicillin and 100 μg/mL streptomycin, Gibco), and L-glutamine (Gibco). Cells were grown at 37 °C in a humidified atmosphere with 5% CO2, and changed with fresh growth medium every 2 days until confluence. Cells were subcultivated by trypsinization when near confluence. Before the stimulation experiments, cells were growth-arrested in DMEM/F12 without FBS for 24 h. We added CoCl2 to the culture medium to mimic hypoxic conditions.
SiRNA duplexes preparation and transfection
siGENOME SMARTpool siRNA containing a mixture of 4 SMART selection designed siRNA targeting human HIF-1α gene (GenBank accession number: NM_001530; HIF-1α siRNA) was purchased from Dharmacon (USA). The forward sequences of DNA corresponding to HIF-1α siRNAs were as follows:
GGACACAGAUUUAGACUUG,
GAUGGAAGCACUAGACAAA,
CGUGUUAUCUGUCGCUUUG,
GAUGAAAGAAUUACCGAAU.
Groups
HK-2 cells were divided into five groups. Control normoxic cells were maintained in normal atmosphere (normoxia group). Serum-free medium with 150 μM CoCl2 was added for a 24 h-incubation after normoxic culture (hypoxia-like group). HK-2 cells were transfected with negative control siRNA (negative control group) and HIF-1α siRNA (HIF-1α siRNA group), then cells suffered hypoxia for 24 h. As an additional control, some cells were treated only with DharmaFect 1 transfection reagent (transfection reagent group).
Real-time RT-PCR
Total RNA was extracted from HK-2 cells with Trizol reagent (Invitrogen, USA) according to the manufacturer’s instructions. RNA samples were quantified by measurement of optical absorbance at 260 and 280 nm in a spectrophotometer. The concentration of total RNA was calculated according to A260. 1 μg of total RNA from each sample was used for reverse transcription (RT) using a Fermentas RT kit. Real-time PCR was performed with Bio-Rad iQ™5 Real-Time PCR Detection System (Bio-Rad, USA) using SYBR Premix Ex Taq Kit (Takara, Shiga, Japan) according to the manufacturer’s instructions. The amplification program included an initial denaturation step at 94 °C for 30 s and a total of 40 cycles of denaturation at 94 °C for 5 s, annealing at 60 °C for 20 s and extension at 72 °C for 30 s. SYBR fluorescence was measured after each extension step, and the specificity of amplification was evaluated by a melting curve analysis.
Primers used to amplify specific gene products from the cDNA of HK-2 cells were as follows:
ß-actin sense, 5′-TGGCACCCAGCACAATGAA-3′;
ß-actin antisense, 5′-CTAAGTCATAGTCCGCCTAGAAGCA-3′;
HIF-1α sense, 5′-AGCCAGACGATCATGCAGCTACTA-3′;
HIF-1α antisense, 5′-TGTGGTAATC CACTTTCATCCATTG-3′;
VEGF sense, 5′-TCAC AGGTACAGGGATGAGGACAC-3′;
VEGF antisense, 5′-TCCTGGGCAACTCAG AAGCA-3′;
Glut-1 sense, 5′-GCCTTTGGCACTCTCAACCAG-3′;
Glut-1 antisense, 5′-GCTGCACTTTGTAGGATAGCAGGAA-3′.
The relative gene expression levels were calculated using the comparative Ct (ΔΔCt) method (according to Applied Biosystems), where the relative expression was calculated as 2−ΔΔCt, and Ct represented the threshold cycle.
Western blot analysis
Protein expression in cultured cells was analyzed by Western blot, which was performed with equal amounts of whole-cell extracts obtained by RIPA (Beyotime, China) and nuclear proteins obtained by a nuclear extract kit (Activemotif, CA). For whole-cell extracts, cells were washed with ice-cold phosphate-buffered saline (PBS) and collected by scraping. Protein extraction from cells was carried out. Protein levels in the extracts were quantified using the BCA protein assay (Beyotime, China). Western blots were generated and probed with specific primary antibody Caspase-3, 1:1000 (Abcam, MA); HIF-1α, 1:250 (Abcam, USA); Glut-1, 1:1000 (Thermo, MA); and VEGF, 1:800 (Abcam, USA), then with horseradish peroxidase-labeled secondary antibody (Santa Cruz Biotechnology). Blots were developed using the enhanced chemiluminescence (ECL) detection system. Optical densities were measured and compared using image analysis software.
Cell proliferation assay
The cell proliferation assay was assessed by MTT assay. Briefly, HK-2 cells were seeded at an initial density of 5 × 10⁴ cells/mL in a 96-well plate. Then, cells were treated by siRNA and/or hypoxic incubation. 100 μL of 3–(4, 5-dimethylthiazol-2-yl)-2, 5-diphenyl tetrazolium bromide (MTT) (Sigma, MO) was added into each well and cells were incubated for 4 h. The formazan crystals formed were dissolved in 150 μL dimethyl sulfoxide (DMSO) (Sigma, MO) after media were aspirated. The solution was measured with an ELISA reader (Bio-Rad, CA) at a wavelength of 490 nm and the optical density value was recorded.
Apoptosis studies
Apoptosis was determined by flow cytometry and terminal deoxynucleotidyl transferase (TdT)-mediated dUTP-biotin nick-end labeling (TUNEL) (Beyotime, China). Flow cytometry used the Annexin V-FITC and propidium iodide (PI) apoptosis detection kit (BD PharMingen, CA) according to the manufacturer’s instructions. The percentage of apoptotic cells was determined by a flow cytometer (Beckham Coulter, CA). Apoptotic cells were identified as the portion of cells with Annexin V-FITC-positive and PI-negative staining by two observers unaware of experimental conditions. Also, TUNEL was performed to determine cell apoptosis in situ according to the manufacturer’s protocol. Cells in each group were triplicated. The apoptotic index (AI) was calculated by counting the proportion of positive cells in total cells under 200-fold visual fields.
Lactate dehydrogenase assay
The HK-2 cells were seeded in 6-well plates at a similar cell density. After treatments, the cell necrosis was evaluated as a function of the amount of cytoplasmic lactate dehydrogenase (LDH) released into the medium, using an assay (Jiancheng, China) based on reduction of nicotinamide adenine dinucleotide (NAD) by the action of LDH. The reduced NAD was utilized in the stoichiometric conversion of a tetrazolium dye into a color compound, which was measured by spectrophotometer at a wavelength of 440 nm.
Statistical analysis
All data were expressed as means ± SD unless indicated otherwise. Differences among groups were determined using one-way ANOVA followed by Dunnett’s test. Statistical significance was defined as p < .05. SPSS 17.0 (SPSS Inc, Chicago, IL) was used to perform the statistical analysis.
Results
Optimized conditions of HIF-1α siRNA transfecting and silencing
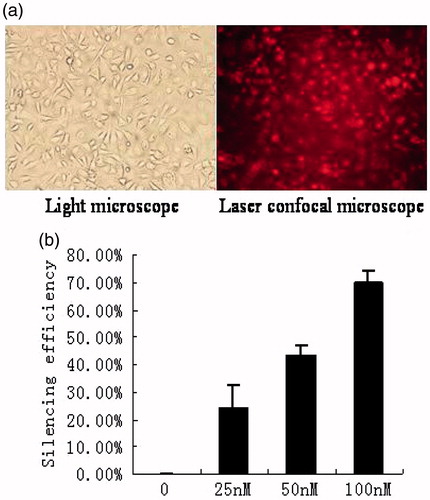
As shown in , the efficiency of HK-2 cells grown on 6-well plate transfected with siGLO red transfection indicators (100 nM) complexed with DharmaFECT 1 transfection reagent (4 μL/well) reached to 95%–100%. As shown in , the silencing efficiencies of different HIF-1α siRNA concentrations (0, 25, 50, and 100 nM) to HK-2 cells under normoxic conditions were 0%, 24.0 ± 8.6%, 43.0 ± 4.2%, and 70.0 ± 4.2%, respectively.
Figure 1. Assessments of transfection efficiency and silencing efficiency of siRNA. (a) Under normoxia, HK-2 cells were transfected with siGLO red transfection indicators for 24 h. HK-2 cells were observed under bright field and confocal microscope in the same field (magnification 200×), respectively. (b) Under normoxia, HK-2 cells were transfected with HIF-1α siRNA at different concentrations (0, 25 nM, 50 nM, and 100 nM). Real-time PCR was used to quantify the mRNA expression of HIF-1α. Silencing efficiency of HIF-1α siRNA at 0 nM was defined as 0%. Silencing efficiency of HIF-1α siRNA = amount of HIF-1α mRNA at some concentration/amount of HIF-1α mRNA at 0 nM (%). Results (means ± SD) are from 3 sets of experiments.
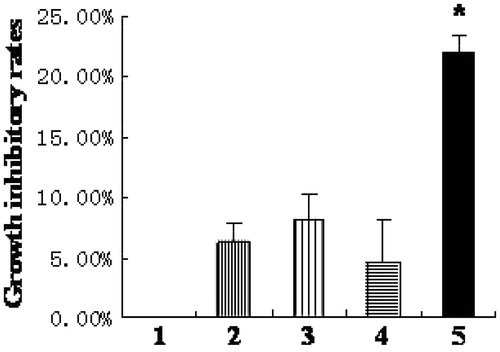
Silencing HIF-1α gene aggravates cell growth inhibition
Cell proliferation assay analysis demonstrated that the growth inhibitory rate of HK-2 cells in HIF-1α siRNA group was 22.1 ± 1.2%, which increased significantly compared to those in the hypoxia-like group (6.2 ± 1.7%), the transfection reagent group (8.1 ± 2.0%), and the negative control group (4.6 ± 3.5%) (p < .05) (.
Figure 2. Silencing HIF-1α gene aggravates cell growth inhibition. (1) normoxia group; (2) hypoxia-like group; (3) transfection reagent group; (4) negative control group; (5) HIF-1α siRNA group. The growth inhibitory rate of HK-2 cells in HIF-1α siRNA group increased significantly compared to those in hypoxia-like group, transfection reagent group, and negative control group (*p < .05). Results (means ± SD) are from 6 sets of experiments.
Silencing HIF-1α gene has no effect on apoptosis
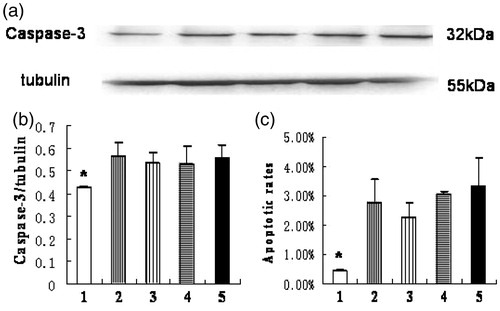
To determine whether HIF-1α affected apoptosis of HK-2 cells under hypoxia, we used TUNEL, caspase-3 quantitation and flow cytometry to detect and quantify apoptosis ( and ). The TUNEL assay showed that the apoptotic indexes of each group were 2.8 ± 0.6%, 6.3 ± 0.6%, 5.8 ± 0.6%, 6.3 ± 0.6%, and 7.1 ± 0.4% in order. And the apoptotic index of the normoxia group was significantly lower than that of the other four groups, among which no significant difference was observed (. The caspase-3 protein level and flow cytometry analysis showed similar results ()).
Figure 3. Apoptosis of HK-2 cells examined by TUNEL assay (magnification 200×). (1) normoxia group; (2) hypoxia-like group; (3) transfection reagent group; (4) negative control group; (5) HIF-1α siRNA group. Apoptotic index of normoxia group was significantly lower than the other four groups (*p < .05). Results (means ± SD) are from 6 sets of experiments.
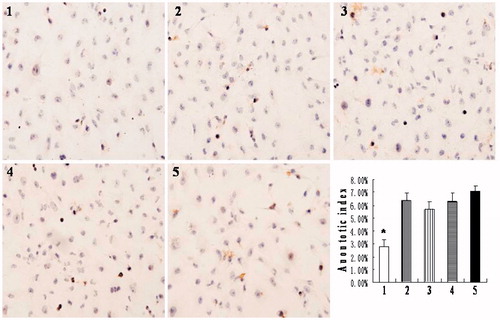
Figure 4. Apoptosis of HK-2 cells examined by expression of caspase-3 protein and flow cytometry. (1) normoxia group; (2) hypoxia-like group; (3) transfection reagent group; (4) negative control group; (5) HIF-1α siRNA group. (a) Expression of caspase-3 and tubulin protein by Western blot. (b) The ratio of caspase-3 to tubulin protein. The caspase-3 protein level of normoxia group was significantly lower than the other four groups (*p < .05). The apoptotic rates (c) of each group were obtained by flow cytometry. Apoptotic rate of normoxia group was significantly lower than the other four groups (*p < .05). Results (means ± SD) are from 6 sets of experiments.
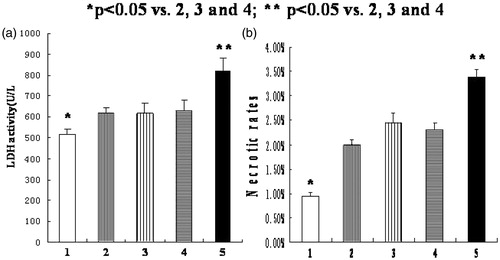
Silencing HIF-1α gene aggravates cell necrosis
As shown in , the LDH activity in normoxia group (516.7 ± 23.6U/L) was significantly lower than the other four groups (p < .05); the LDH activity in HIF-1α siRNA group (822.6 ± 62.3U/L) was significantly higher than the other four groups (p < .05), but no significant difference was observed among hypoxia group (618.5 ± 26.2U/L), transfection reagent group (618.8 ± 46.8U/L), and negative control group (629.8 ± 52.2U/L). Moreover, the necrotic rates evaluated by flow cytometry analysis showed similar results ().
Figure 5. Silencing HIF-1α gene aggravates cell necrosis. (1) normoxia group; (2) hypoxia-like group; (3) transfection reagent group; (4) negative control group; (5) HIF-1α siRNA group. (a) The LDH activity in normoxia group was significantly lower than the other four groups (*p < .05). And the LDH activity in HIF-1α siRNA group was significantly higher than the other four groups (**p < .05). (b) The necrotic rates of each group were obtained by flow cytometry. Results (means ± SD) are from 6 sets of experiments.
Silencing HIF-1α gene reduces Glut-1 and VEGF expression in HK-2 cells
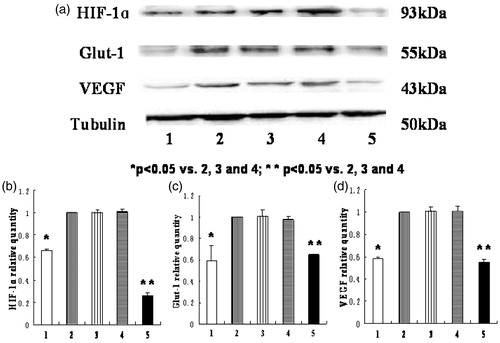
As shown in , the mRNA levels of HIF-1α, Glut-1, and VEGF in normoxia group and HIF-1α siRNA group were significantly lower than the other three groups (p < .05). The ratios of the HIF-1α, Glut-1, and VEGF mRNA levels in HIF-1α siRNA group to those in hypoxia-like group were 3.3%, 25.6%, and 27.2%, respectively. As shown in , the protein expression of HIF-1α, Glut-1, VEGF in normoxia group, and HIF-1α siRNA group were significantly lower than the other three groups (p < .05).
Figure 6. The mRNA expression of HIF-1α, Glut-1, and VEGF in HK-2 cells in different groups. (1) normoxia group; (2) hypoxia-like group; (3) transfection reagent group; (4) negative control group; (5) HIF-1α siRNA group. (a) The mRNA expression of HIF-1α. (b) The mRNA expression of Glut-1. (c) The mRNA expression of VEGF. The mRNA expression of HIF-1α, Glut-1 and VEGF in normoxia group was significantly lower than those in hypoxia-like group, transfection reagent group, and negative control group (*p < .05). And the mRNA expression of HIF-1α, Glut-1, and VEGF in HIF-1α siRNA group was also significantly lower than those in hypoxia-like group, transfection reagent group, and negative control group (**p < .05). Results (means ± SD) are from 6 sets of experiments.
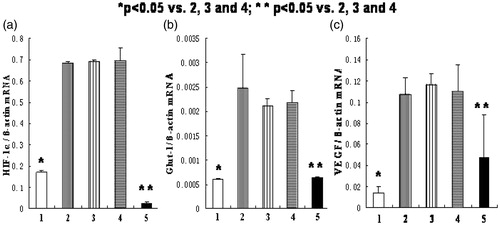
Figure 7. The protein levels of HIF-1α, Glut-1, and VEGF in HK-2 cells in different groups. (1) normoxia group; (2) hypoxia-like group; (3) transfection reagent group; (4) negative control group; (5) HIF-1α siRNA group. (a) The expression of HIF-1α, Glut-1, VEGF, and tubulin protein by Western blot. (b), (c), (d) The relative protein quantity of HIF-1α, Glut-1, and VEGF in different groups. The expression of target proteins in hypoxia-like group was defined as one, and the ratios of target proteins in other groups to those in hypoxia-like group were the relative quantity. The protein levels of HIF-1α, Glut-1, and VEGF in normoxia group were significantly lower than those in hypoxia-like group, transfection reagent group, and negative control group (*p < .05). And the protein levels of HIF-1α, Glut-1, and VEGF in HIF-1α siRNA group were also significantly lower than those in hypoxia-like group, transfection reagent group, and negative control group (**p < .05). Results (means ± SD) are from 6 sets of experiments.
Discussion
Hypoxia has been thought to play pivotal roles in the pathophysiology of acute kidney injury and the progression of chronic kidney disease.Citation16,Citation17 The transcription factor HIF-1 is a key regulator responsible for cellular hypoxic responses, and it is a promising target with therapeutic potential in hypoxia-mediated kidney diseases. It has been reported that HIF-1 trans-activates a variety of genes, including vascular endothelial growth factor (VEGF) and glucose transporter-1 (Glut-1), which play roles in the adaptation to oxygen deficiency.Citation6 On the other hand, HIF-1 also induces the expression of BH3-only pro-death proteins, such as BNIP3, provoking hypoxia-mediated cell death.Citation9 HIF-1 can induce the expression of both pro-death and pro-survival genes, but what determines the overall outcome is not fully understood. Furthermore, effects of HIF-1 on renal proximal tubular epithelial cell fate under hypoxia remain unclear. Our study was to investigate the role of HIF-1 in cell proliferation and cell death of proximal tubular epithelial cell under hypoxia.
Cobalt chloride (CoCl2) is one of the iron antagonists, widely used as an experimental hypoxia mimetics.Citation18–20 CoCl2 stimulation to cells shows the same mechanisms of oxygen sense, signal transduction, and transcriptional regulation.Citation21 Matsumoto and others reported hypoxia preconditioning with CoCl2 at low doses could enhance HIF expression and protect organs against damage in rats.Citation22,Citation23 However, the obvious reduction in oxygen tension also makes the kidney and its innate cells prone to hypoxic or ischemic injury.Citation24–26 Severe energy depletion and subsequent activation of a number of critical alterations in cytoskeleton occur under hypoxic conditions.Citation25 Similar to that observed in physical hypoxia, this study showed that cell necrosis and cell growth inhibition were more severe in chemical hypoxia group than normoxia group.
Furthermore, high expression of HIF-1α and its target genes, including VEGF and Glut-1, induced in vitro by CoCl2-mediated chemical hypoxia mimic, was clearly seen in the HK-2 cell line. Previous studies showed that the regulation of HIF-1α expression and activity occurs at multiple levels, including mRNA expression, protein expression, nuclear localization, and transactivation.Citation27 And among these, the most intensively studied has been the regulation of steady-state HIF-1α protein levels.Citation27 This study investigated the expression of HIF-1α in HK-2 cells under hypoxia, and it showed that hypoxia increased the expression of HIF-1α at both mRNA and protein levels. In addition, our previous study demonstrated that the most suitable concentration of CoCl2 in medium to mimic hypoxia was 150 μM, and the most suitable hypoxic period was 24 h for HK-2 cells to activate HIF-1 (data not shown).
RNAi mediated by siRNA is a powerful technique to silence mammalian genes with great specificity and potency.Citation28 RNA interference has been used to suppress the expression of HIF-1α in many researches.Citation8,Citation14,Citation15 We observed that, under normoxia, siRNA was efficiently transfected into HK-2 cells, and siRNA with final concentration of 100 nM could silence about 70% of HIF-1α. It also showed that the mRNA expression of HIF-1α was nearly abrogated by siRNA in cultured HK-2 cells at 24 h under hypoxia. Consistently, the protein expression of HIF-1α was also reduced significantly by RNA interference. Moreover, both mRNA and protein levels of VEGF and Glut-1 were inhibited correspondingly. As shown in other studies, our data suggest that HIF-1α can be silenced effectively by RNA interference. This study showed that silencing HIF-1α in HK-2 cells could significantly aggravate cell growth inhibition and necrosis under hypoxia. It is suggested that HIF-1 activation could help proximal tubular epithelial cell survive under low oxygen conditions. Consistent with our results, Conde et al. described in vivo interference of HIF-1α exacerbated tissue damage and renal dysfunction after ischemia/reperfusion.Citation14 Others also reported that silencing HIF-1α could accelerate cell death in non-small-cell lung cancer,Citation29 and inhibit cell proliferation in glioma cell lines.Citation15 However, some studies showed that repressing HIF-1α could promote cell proliferation and ameliorate cell death.Citation30,Citation31 The contribution of HIF-1 to cell fate is not fully understood, which may be determined by the degree of hypoxic stimuli, the cell type, and subsequently activated downstream genes, either pro-death or pro-survival. Many genes regulated by HIF-1 are involved in promoting cell survival and recovery after hypoxia, for example, by maintenance of cellular energy supplies and stimulation of angiogenesis.Citation27 Glucose transporter proteins mediate glucose uptake. Six glucose transporter proteins, responsible for glucose uptake, have been found. Among them, Glut-1 may be the rate-limiting step for glucose utilization of many different cells.Citation32 VEGF plays a central role in angiogenesis, which increases blood vessel density and blood oxygen-carrying capacity.Citation33,Citation34 Kaur et al. propounded that HIF-1α expression represented an “angiogenic switch” that promoted cell survival in hypoxic conditions by elevating glycolysis and angiogenesis.Citation35 Consistent with that, our results showed that, under chemical hypoxia for 24 h, both mRNA and protein expression of VEGF and Glut-1 were increased with the activation of HIF-1α. Moreover, HIF-1α silencing led to their downregulation, accompanied by deterioration of growth inhibition and cell necrosis. It is indicated that Glut-1 and VEGF may be involved in pro-survival effects of HIF-1 in HK-2 cells.
Cell death is typically discussed dichotomously as either apoptosis or necrosis. Cell death by means of apoptosis or necrosis is mainly determined by the degree and the duration of insults. Apoptosis is a mild death way with specific characters which distinguish itself from necrosis.Citation36 Hypoxia can induce apoptosis.Citation21 Our data showed that hypoxia could increase both necrosis and apoptosis in HK-2 cells, whereas the former was the major in this study. As a result, silencing HIF-1α by siRNA mainly aggravated HK-2 cell necrosis, instead of apoptosis. Further studies will be needed to clarify underlying molecular mechanisms.
In conclusion, silencing HIF-1α gene could aggravate growth inhibition and necrosis of proximal renal tubular cells under hypoxia. That is, we provide evidence, from the opposite direction, that HIF-1 activation facilitates adaptation and survival of proximal renal tubular cells under hypoxic conditions, and the beneficial effects may be related to its downstream pro-survival genes, such as Glut-1 and VEGF. It is suggested that measures to activate HIF-1 hold great potential as a novel therapy for renal hypoxic/ischemic insults.
Disclosure statement
The authors declare that there are no conflicts of interest.
References
- Epstein FH, Agmon Y, Brezis M. Physiology of renal hypoxia. Ann NY Acad Sci. 1994;718:72–81.
- Sauvant C, Schneider R, Holzinger H, et al. Implementation of an in vitro model system for investigation of reperfusion damage after renal ischemia. Cell Physiol Biochem. 2009;24:567–576.
- Haase VH. Hypoxic regulation of erythropoiesis and iron metabolism. Am J Physiol Renal Physiol. 2010;299:F1–13.
- Cheng Q, Nguyen T, Song H, et al. Hypoxia protects human corneal endothelium from tertiary butyl hydroperoxide and paraquat-induced cell death in vitro. Exp Biol Med. 2007;232:445–453.
- Greijer AE, van der Groep P, Kemming D, et al. Up-regulation of gene expression by hypoxia is mediated predominantly by hypoxia-inducible factor 1 (HIF-1). J Pathol. 2005;206:291–304.
- Fedele AO, Whitelaw ML, Peet DJ. Regulation of gene expression by the hypoxia-inducible factors. Mol Interv. 2002;2:229–243.
- Wu J, Chen P, Li Y, Ardell C, et al. HIF-1α in heart: Protective mechanisms. Am J Physiol Heart Circ Physiol. 2013;305:H821–H828.
- Takahashi Y, Nishikawa M, Takakura Y. Inhibition of tumor cell growth in the liver by RNA interference-mediated suppression of HIF-1alpha expression in tumor cells and hepatocytes. Gene Ther. 2008;15:572–582.
- Sowter HM, Ratcliffe PJ, Watson P, et al. HIF-1-dependent regulation of hypoxic induction of the cell death factors BNIP3 and NIX in human tumors. Cancer Res. 2001;61:6669–6673.
- Aminova LR, Siddiq A, Ratan RR. Antioxidants, HIF prolyl hydroxylase inhibitors or short interfering RNAs to BNIP3 or PUMA, can prevent prodeath effects of the transcriptional activator, HIF-1alpha, in a mouse hippocampal neuronal line. Antioxid Redox Signal. 2008;10:1989–1998.
- Aminova LR, Chavez JC, Lee J, et al. Prosurvival and prodeath effects of hypoxia-inducible factor-1alpha stabilization in a murine hippocampal cell line. J Biol Chem. 2005;280:3996–4003.
- Mazure NM, Pouysségur J. Hypoxia-induced autophagy: Cell death or cell survival?. Curr Opin Cell Biol. 2010;22:177–180.
- Piret JP, Mottet D, Raes M, et al. Is HIF-1alpha a pro- or an anti-apoptotic protein? Biochem Pharmacol. 2002;64:889–892.
- Conde E, Alegre L, Blanco-Sánchez I, et al. Hypoxia inducible factor 1-alpha (HIF-1 alpha) is induced during reperfusion after renal ischemia and is critical for proximal tubule cell survival. PLoS One. 2012;7:e33258.
- Gillespie DL, Whang K, Ragel BT, et al. Silencing of hypoxia inducible factor-1 alpha by RNA interference attenuates human glioma cell growth in vivo. Clin Cancer Res. 2007;13:2441–2448.
- Rosen S, Epstein FH, Brezis M. Determinants of intrarenal oxygenation: Factors in acute renal failure. Ren Fail. 1992;14:321–325.
- Tanaka T, Nangaku M. The role of hypoxia, increased oxygen consumption, and hypoxia-inducible factor-1 alpha in progression of chronic kidney disease. Curr Opin Nephrol Hypertens. 2010;19:43–50.
- Belaidi E, Beguin PC, Levy P, et al. Delayed myocardial preconditioning induced by cobalt chloride in the rat: HIF-1α and iNOS involvement. Fundam Clin Pharmacol. 2012;26:454–462.
- Brusevold IJ, Husvik C, Schreurs O, et al. Induction of invasion in an organotypic oral cancer model by CoCl2, a hypoxia mimetic. Eur J Oral Sci. 2010;118:168–176.
- Shrivastava K, Bansal A, Singh B, et al. Sub-chronic oral toxicity study in Sprague-Dawley rats with hypoxia mimetic cobalt chloride towards the development of promising neutraceutical for oxygen deprivation. Exp Toxicol Pathol. 2010;62:489–496.
- Piret JP, Mottet D, Raes M, et al. CoCl2, a chemical inducer of hypoxia-inducible factor-1, and hypoxia reduce apoptotic cell death in hepatoma cell line HepG2. Ann NY Acad Sci. 2002;973:443–447.
- Matsumoto M, Makino Y, Tanaka T, et al. Induction of renoprotective gene expression by cobalt ameliorates ischemic injury of the kidney in rats. J Am Soc Nephrol. 2003;14:1825–1832.
- Shrivastava K, Shukla D, Bansal A, et al. Neuroprotective effect of cobalt chloride on hypobaric hypoxia-induced oxidative stress. Neurochem Int. 2008;52:368–375.
- Biju MP, Akai Y, Shrimanker N, et al. Protection of HIF-1-deficient primary renal tubular epithelial cells from hypoxia-induced cell death is glucose dependent. Am J Physiol Renal Physiol. 2005;289:F1217–F1226.
- Sáenz-Morales D, Conde E, Escribese MM, et al. ERK1/2 mediates cytoskeleton and focal adhesion impairment in proximal epithelial cells after renal ischemia. Cell Physiol Biochem. 2009;23:285–294.
- Jiang SH, Liu CF, Zhang XL, et al. Renal protection by delayed ischaemic preconditioning is associated with inhibition of the inflammatory response and NF-kappaB activation. Cell Biochem Funct. 2007;25:335–343.
- Semenza GL. HIF-1: Mediator of physiological and pathophysiological responses to hypoxia. J Appl Physiol. 2000;88:1474–1480.
- Mohr S, Bakal C, Perrimon N. Genomic screening with RNAi: Results and challenges. Annu Rev Biochem. 2010;79:37–64.
- Song X, Liu X, Chi W, et al. Hypoxia-induced resistance to cisplatin and doxorubicin in non-small cell lung cancer is inhibited by silencing of HIF-1alpha gene. Cancer Chemother Pharmacol. 2006;58:776–784.
- Schultz K, Murthy V, Tatro JB, et al. Prolyl hydroxylase 2 deficiency limits proliferation of vascular smooth muscle cells by hypoxia-inducible factor-1 alpha-dependent mechanisms. Am J Physiol Lung Cell Mol Physiol. 2009;296:L921–L927.
- Helton R, Cui J, Scheel JR, et al. Brain-specific knock-out of hypoxia-inducible factor-1 alpha reduces rather than increases hypoxic-ischemic damage. J Neurosci. 2005;25:4099–4107.
- Shao Y, Wellman TL, Lounsbury KM, et al. Differential regulation of GLUT1 and GLUT8 expression by hypoxia in mammary epithelial cells. Am J Physiol Regul Integr Comp Physiol. 2014;307:R237–R247.
- Kang DH, Hughes J, Mazzali M, et al. Impaired angiogenesis in the remnant kidney model: II. Vascular endothelial growth factor administration reduces renal fibrosis and stabilizes renal function. J Am Soc Nephrol. 2001;12:1448–1457.
- Kanellis J, Fraser S, Katerelos M, et al. Vascular endothelial growth factor is a survival factor for renal tubular epithelial cells. Am J Physiol Renal Physiol. 2000;278:F905–F915.
- Kaur B, Khwaja FW, Severson EA, et al. Hypoxia and the hypoxia-inducible-factor pathway in glioma growth and angiogenesis. Neuro-oncology. 2005;7:134–153.
- Kushnareva Y, Newmeyer DD. Bioenergetics and cell death. Ann N Y Acad Sci. 2010;1201:50–57.