
Abstract
Cardiac output may increase after volume administration with relative intravascular volume depletion, or after ultrafiltration (UF) with relative intravascular volume overload. Assessing relative intravascular volume using respiratory/ventilatory changes in inferior vena cava (IVC) diameters may guide volume management to optimize cardiac output in critically ill patients requiring hemodialysis (HD) and/or UF.
We retrospectively studied 22 critically ill patients having relative intravascular volume assessed by IVC Collapsibility Index (IVC CI) = (IVCmax-IVCmin)/IVCmax*100%, within 24 h of cardiac output measurement, during 37 intermittent and 21 continuous HD encounters. Cardiac output increase >10% was considered significant. Net volume changes between cardiac outputs were estimated from “isonatremic volume equivalent” (0.9% saline) gains and losses.
Cardiac output increased >10% in 15 of 42 encounters with IVC CI <20% after net volume removal, and in 1 of 16 encounters with IVC CI ≥20% after net volume administration (p = 0.0136). All intermittent and continuous HD encounters resulted in intradialytic hypotension. Net volume changes between cardiac output measurements were significantly less (median +1.0 mL/kg) with intractable hypotension or vasopressor initiation, and net volume removal was larger (median −22.9 mL/kg) with less severe intradialytic hypotension (p < 0.001). Cardiac output increased >10% more frequently with least severe intradialytic hypotension and decreased with most severe intradialytic hypotension (p = 0.047).
In summary, cardiac output may increase with net volume removal by ultrafiltration in some critically ill patients with relative intravascular volume overload assessed by IVC collapsibility. Severe intradialytic hypotension may limit volume removal with ultrafiltration, rather than larger volume removal causing severe intradialytic hypotension.
Introduction
The goal of volume assessment and management in critically ill patients is to optimize relative intravascular volume in an attempt to improve cardiac output (CO) and tissue perfusion [Citation1,Citation2]. Reliable assessment of relative intravascular volume is essential for appropriate management of hospitalized patients requiring hemodialysis (HD) and/or ultrafiltration for end-stage renal disease (ESRD) or acute kidney injury (AKI), who frequently have mismatch between blood pressure (BP) and intravascular volume, or between extravascular and intravascular volume [Citation1].
Critically ill patients with undifferentiated hypotension have been shown to benefit from inferior vena cava ultrasound (IVC US) assessment of relative intravascular volume to guide volume management [Citation3,Citation4]. IVC US may be a useful tool for predicting whether critically ill patients are likely to tolerate volume removal with hemodialysis (HD) and ultrafiltration (UF) [Citation5]. In our previous study, critically ill patients with low inferior vena cava (IVC) collapsibility index (CI) values, consistent with relative intravascular volume overload, more frequently tolerated UF, while those with high IVC CI consistent with low relative intravascular volumes were much less likely to tolerate UF [Citation5]. Assessing relative intravascular volume using inferior vena cava collapsibility determined by ultrasound may provide a useful tool in guiding volume management in critically ill patients receiving HD/UF.
CO has been well documented to increase >10% after volume administration in volume depleted patients [Citation1,Citation6]. CO has only been reported to increase >10% with HD and UF in two studies of congested patients with stable ESRD [Citation7,Citation8], in one study of critically ill patients with renal failure and clinical volume overload [Citation9], and with UF alone in three studies of refractory/decompensated heart failure [Citation10–12].
CO has been reported to decrease >10% after intermittent HD and/or UF in multiple studies of stable ESRD patients with or without a propensity for intradialytic hypotension (IDH) [Citation8,Citation13–27]. CO has been reported to be decreased in critically ill patients with acute hepatic and renal failure receiving vasopressors during intermittent hemodiafiltration without net UF[Citation28], in patients with AKI associated with critical illnesses during HD with or without UF [Citation29], and with sepsis and acute kidney injury (AKI) during continuous veno-venous hemofiltration (CVVH) without UF [Citation30].
Intradialytic hypotension (IDH) may relate to cardiac stunning and decreased CO in stable ESRD patients [Citation25,Citation26], and may limit the volume of net UF removed in critically ill patients [Citation5].
Changes in relative intravascular and extravascular volume may not be accurately determined from either changes in total body weight or net “fluid” balance [Citation31]. The volume effects of different enteral and parenteral solutions administered and body fluid losses vary widely [Citation32]. When estimating relative intravascular and extravascular volume contribution of different “fluid” inputs and losses from the body, it is important to consider their individual compositions, as well as the normal distribution of water and electrolytes and the size of the major fluid compartments in the body. Changes in CO with HD/UF in critically ill patients receiving intermittent or continuous hemodialysis (HD) therapy have not been previously related to initial relative intravascular volume assessed by IVC US and subsequent net “isonatremic volume equivalent” changes (equivalent volume effect of 0.9% saline).
We evaluated a group of critically ill patients who had relative intravascular volume assessed by IVC CI, and CO estimated by thermodilution, before and after intermittent HD and/or UF or at intervals during continuous HD with or without UF, to assess effects of net volume change on change in CO.
Material and methods
Population and study design
We retrospectively studied ICU patients between August 2012 and September 2018 who had CO assessed by thermodilution using a Swan-Ganz catheter before and after intermittent HD or during continuous venovenous hemodiafiltration (continuous HD), and had relative intravascular volume assessed by respiratory changes in inferior vena cava (IVC) collapsibility within 24 h prior to intermittent HD or prior to CO measurement during continuous HD ( and ).
Table 1. Patient characteristics.
Table 2. Patient encounter data.
Approval for this study was obtained from the University of Southern California Institutional Review Board (HS-12-00383-CR002). Written informed consent was not required for the retrospective data collection and analysis since all ultrasound studies, Swan-Ganz catheter placements and measurements, and treatment plans were performed for clinical purposes.
Dialysis and/or ultrafiltration were performed using intermittent HD if tolerated or continuous venovenous hemodiafiltration, at the discretion of the attending nephrologist. Volume management decisions were made in a clinical context, not according to a research protocol, based on all available data, including Swan-Ganz and IVC US findings. We generally aimed to optimize intravascular volume in the absence of overriding considerations or clinical goals [Citation1].
CO values were included if they were recorded before and after intermittent HD, or if they were available immediately before and after, or during continuous HD. Individual patients have different relative intravascular volumes from one encounter to another due to volume administration, volume losses and other factors, as well as varying changes in cardiac output. Each interval between CO measurements was considered as a separate encounter, since critically ill patients have continuous variations in relative intravascular volume and CO as well as multiple other parameters over time.
All patients had echocardiography studies available during the hospitalization. For patients who had multiple echocardiograms, the study closest in time to the first encounter was used.
Ultrasound
Bedside IVC US was performed in real-time during daily bedside rounds without Valsalva or sniff maneuvers, since most patients were unable to perform these maneuvers, as previously described [Citation5]. For continuous HD encounters, all were scanned while on HD except for one who had IVC US pre-HD (Supplemental Table 1). Longitudinal images of the IVC were obtained from an anterior substernal approach performed or directly supervised by the senior investigator (EMK) with a 3.5-MHz curvilinear probe on a portable ultrasound machine (LOGIQ e B12, GE Healthcare, Wauwatosa, WI 53226). All patients were imaged in the semi-recumbent position. Substernal IVC diameters were measured 1–2 cm from the junction with the right atrium or distal to the hepatic vein. A frame-by-frame image analysis was performed to identify maximum (IVCmax) and minimum (IVCmin) cava diameters with respiration/ventilation. Collapsibility Index (CI = (IVCmax – IVCmin)/IVCmax * 100%) was calculated for all encounters [Citation1].
Severity of IDH
Severity of IDH was categorized as previously reported [Citation5], with the greatest severity recorded for each encounter. Increasing severity of IDH in our ICU patients were as follows: 0, No criteria for IDH; 1, received more than 500 mL 0.9% saline or received albumin IV to treat IDH (all patients receiving intermittent HD received 250 mL of 0.9% saline initially to prime the line and dialyzer and 250 mL of 0.9% saline at the completion of HD to return the blood and rinse the line and dialyzer) [Citation5]; 2a, MAP < 65 mmHg with or without volume resuscitation during HD, no vasopressors/inotropes given, and HD not discontinued due to hypotension; 2b, pre-HD hypotension requiring vasopressors/inotropes, and a constant dose of vasopressors/inotropes given to maintain BP before and during HD/UF with or without volume resuscitation; 3, SBP decreased more than 50 mmHg or MAP decreased more than 20% with or without volume resuscitation and/or vasopressors/inotropes; 4, vasopressor/inotrope therapy initiated, dose increased, or dialysis stopped within 2 h due to intractable IDH with or without volume resuscitation.
Calculation of “isonatremic volume equivalent” changes
Supplemental Figure 1 summarizes how we estimated the intravascular and extravascular volume contribution of different enteral and parenteral solutions administered, and body fluid losses. We used population-based mean sodium concentrations for body fluid losses [Citation32]. Net UF volume changes during intermittent HD included only those directly related to the dialysis procedure and blood products, for the time during which dialysis was performed. Net volume changes between CO measurements included all “isonatremic” volume inputs and losses, including those during the dialysis procedure.
Isonatremic solutions, for example 0.9% saline, equilibrate across intravascular and extravascular compartments in proportion to the relative sizes of those compartments [Citation32]. The free water contribution to intravascular and extravascular volume has been shown to be minimal [Citation34,Citation35]. To determine what proportion of fluids will distribute as isonatremic solution, the sodium concentration of fluids lost and gained can be divided by the sodium concentration of plasma water (normally 154 mEq/L), except for blood products [Citation32]. For all analyses in this study, milliliters of fluid inputs and outputs were converted into “isonatremic volume equivalents” (equivalent volume effect of 0.9% saline) using the calculations in the Supplemental Figure 1.
Net intravascular plus extravascular volume effect of pRBC administration using an additive solution was estimated as (pRBC volume * 2.8) as 0.9% saline equivalents (Supplemental Figure 1) [Citation36,Citation37].
The intravascular volume effect of albumin peaks immediately after IV administration and decreases progressively with time [Citation38]. The immediate intravascular volume effect of 25% albumin is approximately five times that of 5% albumin [Citation39], and 5% albumin has a similar volume effect immediately after IV administration as 0.9% saline [Citation40]. For net volume calculations which included 25% albumin, the intravascular volume effect was adjusted for the time from administration to the time of the CO measurement (Supplemental Table 1).
If urine sodium concentration was not measured, urine was assumed to be approximately 0.45% saline (77 mEq/L) with severe renal insufficiency or diuretics. If stool loss was indicated but no volume recorded, we assumed loss was approximately 100 mL. If there were stool losses but no lactulose, sorbitol or polyethylene glycol (PEG) had been administered, we assumed non-osmotic diarrhea with mean sodium concentration of 69 mEq/L [Citation32]. Other body fluid losses were estimated as indicated in Supplemental Figure 1.
Statistical analysis
Statistics were performed using Epistat version 5.3 (Epistat Services, Richardson, TX, USA) and graphics were created using SigmaPlot version 13 (Systat Software Inc, San Jose, CA, USA).
Category variables were analyzed using log likelihood ratio tests (LLR). Values for numeric variables were compared using non-parametric Mann-Whitney U test (MW) when data was distributed between two categories, and using non-parametric Kruskal-Wallis ANOVA (KW) test with multiple categories. When the Kruskal-Wallis test indicated significance, Newman-Keuls (NK) multiple comparisons tests at the p = 0.05 significance level were used to determine which groups differed.
The change in CO with net “isonatremic volume equivalent” change (abbreviated as “net volume” change) may depend on initial relative intravascular volume. The relationship of change in CO to “net volume” change between cardiac measurements and to IVC CI was plotted using a 3-D scattergram with smoothing (). CO change >10% was considered significant [Citation6].
Figure 1. (a) Relationship of change in CO to “net volume” change within CO interval and to IVC CI depicted as a 3-D scattergram with smoothing. Solid symbols indicate intermittent HD encounters and open symbols indicate continuous HD encounters. Upward triangles indicate CO increased > 10%, downward triangles indicate CO decreased > 10%, circles indicate CO changed −10% to +10%. Stars indicate CO “outliers” on the mesh plot. IVC CI < 20% was indicated as relative intravascular volume overload and IVC CI ≥ 20% as not volume overloaded. The flat plane indicates zero per cent change in CO. Sectors labeled A, B, C, D, E, and F correspond to . (b) Relationship of IVC CI to “net volume” change between CO measurements, CO change, and intradialytic hypotension. Symbols are as in . Encounter data are grouped based on IVC CI <20% versus ≥20%. The “net volume” change cutoffs were arbitrarily at −7 mL/kg and −30 mL/kg. The numbers inside of the symbols indicate the severity of intradialytic hypotension (IDH) (number 1 = IDH 2a, 2 = IDH 2b, 3 = IDH 3, and 4 = IDH 4). For IVC CI < 20%, sector A represents “net volume” change of < −7 mL/kg (n = 12), sector B represents “net volume” change −7 to −30 mL/kg (n = 24), and sector C represents “net volume” change of more than −30 mL/kg (n = 6). For IVC CI ≥ 20%, D represents “net volume” change of < −7 mL/kg (n = 8), E represents “net volume” change −7 to −30 mL/kg (n = 7), F represents “net volume” change of more than −30 mL/kg (n = 1).
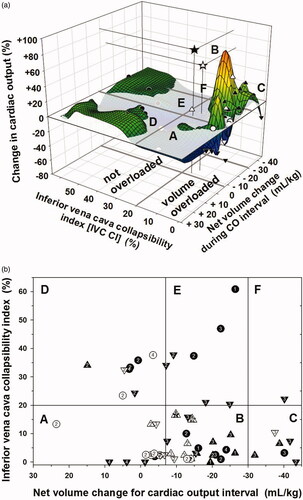
We plotted IVC CI versus weight-adjusted “net volume” change for cardiac output intervals, and divided encounters into categories by IVC CI and “net volume” change (). We used IVC CI cutoff < 20% and ≥20% as previously published [Citation5], and arbitrary “net volume” change cutoffs of more than 30 mL/kg, and <7 mL/kg derived from natural breaks in the data. Changes in CO were categorized as >+10%, −10% to +10%, and < −10%. The severity of intradialytic hypotension is indicated for each encounter ( and Supplemental Table 1). All summations for contingency table analyses can be derived from Supplemental Table 1.
Sequential Organ Failure Assessment (SOFA) scores were calculated for each encounter [Citation41] (Supplemental Table 1). Relationships between encounter SOFA scores with IVC CI values were assessed by linear regression, and between SOFA scores and changes in CO (as increased >10% or not increased) were determined by Mann-Whitney U test.
Results
As shown in , CO data were available for 15 patients who received intermittent HD and/or UF, 4 who received continuous HD and/or UF, and 3 who had both intermittent and continuous HD and/or UF encounters. There were 37 encounters with intermittent and 21 with continuous HD and/or UF ().
As shown in , significantly more encounters with vasopressor/inotrope support occurred with continuous HD (100%) compared to intermittent HD (75.7%) (p < 0.003), and SOFA scores were higher in the continuous than intermittent HD encounters (p < 0.009). The number of encounters with IDH 2a and IDH4 were higher than expected due to chance in intermittent HD and the number of encounters with IDH 2 b was higher than expected in the continuous HD encounters (p = 0.017 LLR). The weight-adjusted “net volume” change between CO measurements was larger in the intermittent than the continuous HD encounters (p < 0.007), while the rate of “net volume” change was not significantly different for intermittent than continuous HD encounters (p = 0.2) which may be due to the tendency for longer intervals between CO measurements with intermittent HD (p = 0.075).
Encounters were grouped based on IVC CI < 20% versus ≥ 20%, and changes in CO of greater than 10% increase −10% to +10%, and greater than 10% decrease (). There were 42 encounters with IVC CI < 20% (24 intermittent and 18 continuous HD) and 16 encounters with IVC CI ≥ 20% (13 intermittent and 3 continuous HD). Details of each encounter are presented in Supplemental Table 1.
Table 3. Summary of patient encounter data related to inferior vena cava collapsibility and cardiac output categories.
shows the 3-D mesh plot of the relationship of change in CO to relative intravascular volume assessed by IVC CI before each CO interval and to weight-adjusted “net volume” change during intermittent or continuous HD. A similar profile was seen using mean rate of “net volume” change during CO intervals (Not shown).
shows the 2D scatter plot of IVC CI < 20% and ≥ 20% versus “net volume” change categories (more than −30, −30 to −7, and less than −7 mL/kg) and also shows changes in CO and severity of IDH for each encounter (data from Supplemental Table 1).
CO increased >10% in 15 of 42 encounters with IVC CI < 20% and in 1 of 16 encounters with IVC CI ≥ 20% (p = 0.0136 LLR) (). CO decreased >10% in 13 of 42 encounters with IVC CI < 20% and in 7 of 16 encounters with IVC CI ≥ 20% (p = 0.35 LLR), and change in CO was between −10% and +10% in 22 of 42 encounters.
Of the 16 encounters with increased CO >10%, 15 had IVC CI < 20% (Sectors A, B and C) and one had IVC CI of 34% (Sector D) (). Those with IVC CI <20% and increased CO achieved “net volume” changes ranging from −39 mL/kg to −9 mL/kg. The encounter with IVC CI of 34% and increased CO >10% had a “net volume” change of +15 mL/kg (Sector D) (Supplemental Table 1).
The distribution of IDH severity in encounters with IVC CI <20% was not random among “net volume” change categories (p = 0.0095 LLR) (). In encounters where only minimal “net volume” was removed or volume was added ( sector A), there was higher than expected number of encounters with IDH category 4 and a lower than expected number of encounters with IDH category 3. In encounters where the largest “net volume” was removed ( sector C), there was a higher than expected number of encounters with IDH category 3.
The median “net volume” change between CO measurements for the combined intermittent and continuous HD encounters were less with IDH 2b and IDH 4 than with IDH 2a and IDH 3 which did not differ from each other; the “net volume” change was less with IDH4 than with IDH 2 b (p < 0.001 by KW) (). The same pattern was present for the median rates of net volume change among IDH categories (p < 0.001) (Data not shown). The net UF volumes and UF rates for the intermittent HD encounters were significantly less with IDH 4 than with IDH 2a, IDH 2b or IDH 3 which were not different from each other (p = 0.004 for UF volumes, and p = 0.006 for UF rates, respectively) (Data not shown).
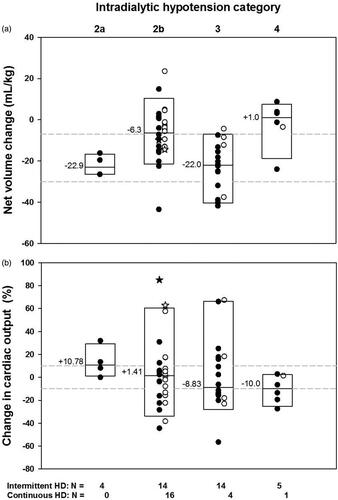
Figure 2. Relationship of net volume change between CO measurements to severity of IDH () and the relationship between changes in CO values with severity of IDH (). Solid symbols indicate intermittent HD encounters and open symbols indicate continuous HD encounters. Stars indicate CO “outliers” on the mesh plot. Boxes indicate the 95th, 50th and 5th percentiles. Median values are indicated. The number of encounters is indicated as N. (a) The weight-adjusted median net volume changes were less with IDH 4 than with IDH 2b, which were less than with IDH 2a or IDH 3 (KW p < 0.001, NK at p of 0.05). The dashed lines represent the “net volume” change cutoffs of −7 mL/kg and −30 mL/kg. (b) An increased CO > 10% was more frequent with IDH 2a and less frequent with IDH 4 than expected due to chance. A decreased CO more than 10% was less frequent with IDH 2a and IDH 2b, and more frequent with IDH 3 and IDH 4 than expected due to chance (p = 0.047 LLR) (Supplemental Table 2). Median values were not significantly different.
The distribution of encounters with varying severity of IDH and change in CO as increased, unchanged or decreased, was not random (p = 0.047 by LLR) ( and Supplemental Table 2). For those encounters with more than 10% increase in CO, IDH 2a was more frequently observed than expected and IDH 4 was less frequently observed than expected. For those encounters whose CO was decreased more than 10%, IDH 3 and IDH 4 were observed more frequently than expected and IDH 2a and 2b were observed less frequently than expected (Supplemental Table 2). Median changes in CO were not significantly different among IDH categories. The changes in SVR or 1/SVR were not significantly related to IDH categories (Data not shown).
Changes in CO were linearly correlated directly with changes in stroke volume (R2 = 0.82, p < 0.001) and to changes in 1/SVR (R2 = 0.49, p < 0.001). There was no relationship between a diagnosis of cardiac disease and the number of encounters with increased, decreased or no change in CO (p = 0.16 LLR), or for those with increased CO compared to those with no increase in CO (p = 0.15 LLR). There was no significant relationship between the frequency of encounters for CO increased or not increased when comparing numbers of encounters with moderate to severe mitral regurgitation to those without moderate to severe mitral regurgitation (p = 0.30 LLR) (Supplemental Table 1). The distribution of the frequency of increased CO or not increased with or without administration of vasopressors/inotropes including dopamine, dobutamine and epinephrine, which may increase CO [Citation42], was not different from random in either the intermittent HD (p = 0.07) or continuous HD encounters (p = 1.0), or for the combined group (p = 0.14) (Supplemental Table 1). Encounter SOFA scores were not significantly related to whether change in CO was increased or not increased.
Among encounters with IVC CI <20%, the frequency of increased CO >10% compared to no change or decreased CO was not significantly different for baseline diagnoses including cardiac diseases (p = 0.156) or sepsis (p = 0.094) (Data from Supplemental Table 1). There was no difference in frequency of severity of IDH (p = 0.166), or mechanical ventilation (p = 0.54), or after excluding the multiple encounters for patient #1 (p = 0.292 and p = 1.0, respectively). The mean net UF volume changes (mL/kg) or median SOFA scores did not differ between those in whom CO increased >10% or not for all encounters (p = 0.179 and p = 0.341, respectively), or for encounters excluding patient #1 (p = 0.463 and p = 0.932, respectively). The frequency of increased CO was not significantly different with administration of vasopressors/inotropes which affect CO (p = 0.105) but was significantly more frequent when encounters for patient #1 were excluded (p = 0.018 LLR).
There were no significant relationships between IVC CI and right atrial pressure (RAP) (p = 0.25), PAOP (p = 0.058) or SVR (p = 0.89), or between change in weight-adjusted “net volume” and change in RAP (p = 0.38) or change in PAOP (p = 0.058). There was a significant relationship between absolute change in RAP and absolute change in PAOP in all encounters (R2=0.30, p < 0.001) as well as for encounters with increased CO (R2=0.32, p = 0.02). There was no association between the frequency of IVC CI <20% or ≥20% and the presence or absence of moderate to severe tricuspid regurgitation by echocardiography (p = 0.53 LLR).
Discussion
CO increased >10% in 36% of our critically ill patient encounters with relative intravascular volume overload asessed by IVC CI <20% followed by net volume removal during intermittent or continuous HD, while CO decreased ≥10% in 34%, and was between −10% and +10% in the remaining 30%. CO increased in only one encounter with IVC CI ≥20% after volume administration ().
In prior studies, CO was shown to increase after HD with or without UF or after UF alone in 11 reports and was decreased or unchanged in 36 reports (). For studies in which the CO increased, most patients were clinically assessed to be volume overloaded, while for the majority of studies in which CO decreased or was unchanged, volume status varied or was not reported.
Table 4. Review of the literature of changes in CO with hemodialysis with or without ultrafiltration.
IVC CI may reflect relative intravascular volume and provide a clinical assessment of the patient’s ability to respond to volume removal. All encounters in which CO increased with “net volume” removal had IVC CI <20% consistent with relative intravascular volume overload; one encounter with IVC CI of 34%, not consistent with relative volume overload, had an increase in CO after “net volume” administration. All other encounters with IVC CI ≥20% had a decrease or no change in CO after HD/UF. This suggests that if the IVC CI is <20%, indicating relative intravascular volume is increased, CO may improve with volume restriction and “appropriate” UF.
An increase in CO in 36% of our patient encounters who had increased relative intravascular volume prior to HD/UF may relate to “appropriate” volume removal, also shown in patients with heart failure following ultrafiltration (). CO has also been well documented to increase in patients without volume overload with “appropriate” net volume administration [Citation6], as was noted in one of our patient encounters.
In studies reporting increased CO after HD and/or UF, the patients tended to be “congested” or “overloaded”, but not all patients had increased CO with volume removal. In one report, CO increased in only 19% of hospitalized patients after dialysis/UF, who were assessed to have volume overload and severe chronic renal failure; CO did not increase in any of the patients without “congestion” after HD/UF [Citation8]. CO increased in 9 of 10 patients with volume overload and acute or chronic renal failure following continuous HD/UF [Citation9], and mean CO increased >10% in patients with decompensated heart failure after UF [Citation10–12]. In patients with refractory congestive heart failure, cardiac output has been postulated to increase after volume removal with UF due to reduction of extracardiac constraint; the latter has been attributed to increased lung edema, pleural effusions and ascites, which in turn may decrease right and left ventricular filling pressures [Citation12].
Inotropes/vasopressors such as dopamine, dobutamine and/or epinephrine may increase CO [Citation42], and may have played a role in a subset of our patient encounters with relative intravascular overload.
CO was decreased or unchanged in 64% of our patient encounters. In the majority of reported studies, CO after HD/UF was unchanged or decreased and patients were frequently clinically “not congested” or “prone to intradialytic hypotension” (). Relative intravascular volume status was not evaluated pre-HD/UF in most reported studies although some studies reported mean right atrial pressure (RAP) or pulmonary artery occlusion pressure (PAOP) values prior to HD/UF ().
In our critically ill patients, all HD encounters met criteria for IDH. In stable ESRD patients, larger UF volumes and more rapid UF rates have been associated with more frequent intradialytic hypotension [Citation63], decreased CO during HD with or without intradialytic hypotension [Citation21,Citation22,Citation26,Citation62], as well as reduced myocardial blood flow and myocardial stunning [Citation26,Citation63–65]. In our study, encounters with the most severe IDH (IDH 4), had minimal changes in the net volume and rate of net volume removal, and the largest rates of net volume change were observed in encounters with less severe IDH. These findings suggest that the most severe IDH may have limited the amount of net volume removal rather than large net volume removal causing more severe IDH.
In our patient encounters, a cardiac output increase >10% was more frequent with the least severe intradialytic hypotension and was less frequent with more severe intradialytic hypotension. IDH may have induced myocardial stunning and contributed to decreased CO in some encounters. The frequency of CO changes relative to IDH severity suggests that more severe intradialytic hypotension may have played a role in decreasing CO in our patient encounters, which may in turn have been related to myocardial stunning as previously reported [Citation63]. These relationships of changes in “net volumes” and changes in CO with categorization of severity of IDH suggests that our IDH categorization is clinically relevant.
Multiple definitions of intradialytic hypotension have been proposed, without consensus or definition of severity [Citation66,Citation67]. We previously categorized severity of IDH based on the degree of hypotension, requirements for volume resuscitation, use of vasopressors, and ability to continue the HD procedure [Citation5]. We defined IDH 4 as initiation or increase of vasopressor/inotrope therapy or discontinuation of dialysis within 2 h due to intractable IDH with or without volume resuscitation. In our previous study [Citation5], encounters with IDH 4 had vasopressors started or increased in 32 out of 33 encounters, while in the current study, those with IDH 4 had HD terminated early due to intractable hypotension in 3 out of 4 encounters. This suggests our IDH 4 criteria may have to be further defined as IDH 4a, indicating intractable hypotension requiring initiation of vasopressors or an increase in the vasopressor dose, and IDH 4b indicating the additional necessity of terminating HD/UF early due to intractable hypotension.
Limitations
This was a retrospective observational study that was not controlled, randomized or blinded. Multiple factors could affect the IVC CI and the changes in CO. The number of patients and encounters was small due to the infrequent concurrent clinical use of Swan-Ganz catheters and IVC ultrasound. IVC ultrasound measurements were not performed immediately prior to CO measurements or immediately prior to and after HD. CO measurements were not available immediately prior to and after intermittent HD. Some patients had multiple encounters which may have been interdependent and may have introduced bias.
Conclusion
In this study, despite the severity of illness and occurrence of IDH, CO increased after intermittent or continuous HD/UF with net volume removal in a third of encounters assessed to have relative intravascular volume overload by IVC ultrasound. This suggests that “appropriate” volume removal may be associated with increased CO in a subset of volume overloaded critically ill patients.
The most severe IDH was associated with the lowest UF volumes and rates, and with the smallest changes in “net volume” and lowest rates of “net volume” removal between CO measurements, suggesting that severity of IDH may have limited volume removal, rather than larger/more rapid volume removal being associated with more severe IDH.
Supplemental Material
Download MS Word (30.6 KB)Supplemental Material
Download MS Word (167.1 KB)Acknowledgments
Martin Aldana-Campos, MD, and Carlos Rueda-Mantilla, MD, University of Southern California, Los Angeles, CA, for retrieving data.
Disclosure statement
No potential conflict of interest was reported by the author(s).
Correction Statement
This article has been republished with minor changes. These changes do not impact the academic content of the article.
Related Research Data
References
- Kaptein MJ, Kaptein EM. Focused real-time ultrasonography for nephrologists. Int J Nephrol. 2017;2017:3756857.
- Ronco C, Kaushik M, Valle R, et al. Diagnosis and management of fluid overload in heart failure and cardio-renal syndrome: the “5B” approach. Semin Nephrol. 2012;32(1):129–141.
- Kanji HD, McCallum J, Sirounis D, et al. Limited echocardiography-guided therapy in subacute shock is associated with change in management and improved outcomes. J Crit Care. 2014;29(5):700–705.
- Perera P, Mailhot T, Riley D, et al. The RUSH exam: Rapid Ultrasound in SHock in the evaluation of the critically lll. Emerg Med Clin North Am. 2010;28(1):29–56, vii.
- Kaptein MJ, Kaptein JS, Oo Z, et al. Relationship of inferior vena cava collapsibility to ultrafiltration volume achieved in critically ill hemodialysis patients. IJNRD. 2018;11:195–209.
- Bentzer P, Griesdale DE, Boyd J, et al. Will this hemodynamically unstable patient respond to a bolus of intravenous fluids? JAMA. 2016;316(12):1298–1309.
- Del Greco F, Shere J, Simon NM. Hemodynamic effects of hemodialysis in chronic renal failure. Trans Am Soc Artif Intern Organs. 1964;10:353–356.
- Del Greco F, Simon NM, Roguska J, et al. Hemodynamic studies in chronic uremia. Circulation. 1969;40(1):87–95.
- Lauer A, Alvis R, Avram M. Hemodynamic consequences of continuous arteriovenous hemofiltration. Am J Kidney Dis. 1988;12(2):110–115.
- Giglioli C, Landi D, Gensini GF, et al. Cardiac efficiency improvement after slow continuous ultrafiltration is assessed by beat-to-beat minimally invasive monitoring in congestive heart failure patients: a preliminary report. Blood Purif. 2010;29(1):44–51.
- Giglioli C, Landi D, Cecchi E, et al. Effects of ULTRAfiltration vs. DIureticS on clinical, biohumoral and haemodynamic variables in patients with deCOmpensated heart failure: the ULTRADISCO study. Eur J Heart Fail. 2011;13(3):337–346.
- Marenzi G, Lauri G, Grazi M, et al. Circulatory response to fluid overload removal by extracorporeal ultrafiltration in refractory congestive heart failure. J Am Coll Cardiol. 2001;38(4):963–968.
- Wehle B, Asaba H, Castenfors J, et al. Hemodynamic changes during sequential ultrafiltration and dialysis. Kidney Int. 1979;15(4):411–418.
- Rouby JJ, Rottembourg J, Durande JP, et al. Hemodynamic changes induced by regular hemodialysis and sequential ultrafiltration hemodialysis: a comparative study. Kidney Int. 1980;17(6):801–810.
- Bos WJ, Bruin S, van Olden RW, et al. Cardiac and hemodynamic effects of hemodialysis and ultrafiltration. Am J Kidney Dis. 2000;35(5):819–826.
- Gadegbeku CA, Shrayyef MZ, Ullian ME. Hemodynamic effects of chronic hemodialysis therapy assessed by pulse waveform analysis. Am J Hypertens. 2003;16(10):814–817.
- Boon D, van Montfrans GA, Koopman MG, et al. Blood pressure response to uncomplicated hemodialysis: the importance of changes in stroke volume. Nephron Clin Pract. 2004;96(3):c82–87.
- Karamperis N, Sloth E, Jensen JD. Predilution hemodiafiltration displays no hemodynamic advantage over low-flux hemodialysis under matched conditions. Kidney Int. 2005;67(4):1601–1608.
- Yoshii M, Minami J, Ishimitsu T, et al. Non-invasive monitoring of hemodynamic changes during hemodialysis by the use of a newly developed admittance cardiograph. Therapher Dial. 2005;9(2):154–160.
- Hoeben H, Abu-Alfa AK, Mahnensmith R, et al. Hemodynamics in patients with intradialytic hypotension treated with cool dialysate or midodrine. Am J Kidney Dis. 2002;39(1):102–107.
- Selby NM, Lambie SH, Camici PG, et al. Occurrence of regional left ventricular dysfunction in patients undergoing standard and biofeedback dialysis. Am J Kidney Dis. 2006;47(5):830–841.
- Dasselaar JJ, Slart RH, Knip M, et al. Haemodialysis is associated with a pronounced fall in myocardial perfusion. Nephrol Dial Transplant. 2008;24(2):604–610.
- Yang NI, Wang CH, Hung MJ, et al. Real-time three-dimensional echocardiography provides advanced haemodynamic information associated with intra-dialytic hypotension in patients with autonomic dysfunction. Nephrol Dial Transplant. 2010;25(1):249–254.
- Cornelis T, van der Sande FM, Eloot S, et al. Acute hemodynamic response and uremic toxin removal in conventional and extended hemodialysis and hemodiafiltration: a randomized crossover study. Am J Kidney Dis. 2014;64(2):247–256.
- Maarek JM, Rubinstein EH, Guo Y, et al. Measurement of cardiac output and blood volume during hemodialysis with fluorescent dye dilution technique. Ann Biomed Eng. 2017;45(3):580–591.
- Buchanan C, Mohammed A, Cox E, et al. Intradialytic cardiac magnetic resonance imaging to assess cardiovascular responses in a short-term trial of hemodiafiltration and hemodialysis. JASN. 2017;28(4):1269–1277.
- Goss JE, Alfrey AC, Vogel JHK, et al. Hemodynamic changes during hemodialysis. Am Soc Artif Intern Organs. 1967;13:68–74.
- Davenport A, Will EJ, Davidson AM. Improved cardiovascular stability during continuous modes of renal replacement therapy in critically ill patients with acute hepatic and renal failure. Crit Care Med. 1993;21(3):328–338.
- Wakabayashi Y, Ohwada T, Kikawada R. Haemo-dialysis/-filtration using sodium bicarbonate depresses cardiac function in critically ill patients with acute renal failure. Jpn Circ J. 1994;58(2):81–86.
- Heering P, Morgera S, Schmitz FJ, et al. Cytokine removal and cardiovascular hemodynamics in septic patients with continuous venovenous hemofiltration. Intensive Care Med. 1997;23(3):288–296.
- Testani JM, Brisco MA, Kociol RD, et al. Substantial discrepancy between fluid and weight loss during acute decompensated heart failure treatment. Am J Med. 2015;128(7):776–783. e774.
- Kaptein EM, Sreeramoju D, Kaptein JS, et al. A systematic literature search and review of sodium concentrations of body fluids. CN. 2016;86(10):203–228.
- Borlaug BA. Clinical manifestations and diagnosis of heart failure with preserved ejection fraction. In: Colucci WS, editor. UpToDate. Alphen aan den Rijn,(Netherlands): Wolters Kluwer; 2018.
- Lobo DN, Stanga Z, Simpson JA, et al. Dilution and redistribution effects of rapid 2-litre infusions of 0.9% (w/v) saline and 5% (w/v) dextrose on haematological parameters and serum biochemistry in normal subjects: a double-blind crossover study. Clin Sci (Lond). 2001;101(2):173–179.
- Konstam MA, Gheorghiade M, Burnett JC Jr, et al. Effects of oral tolvaptan in patients hospitalized for worsening heart failure: the EVEREST Outcome Trial. JAMA. 2007;297(12):1319–1331.
- Kleinman S. Red blood cell transfusion in adults: storage, specialized modifications and infusion parameters. In: Silvergleid AJ, editor. UpToDate. Alphen aan den Rijn (Netherlands): Wolters Kluwer Health; 2017.
- Sparrow RL. Time to revisit red blood cell additive solutions and storage conditions: a role for “omics” analyses. Blood Transfus. 2012;10(Suppl 2):s7–s11.
- Hedin A, Hahn RG. Volume expansion and plasma protein clearance during intravenous infusion of 5% albumin and autologous plasma. Clin Sci (Lond). 2005;108(3):217–224.
- Heyl JT, Gibson JG, Janeway CA, et al. Studies on the plasma proteins. V. The effect of concentrated solutions of human and bovine serum albumin on blood volume after acute blood loss in man. J Clin Invest. 1943;22(6):763–773.
- Knoll GA, Grabowski JA, Dervin GF, et al. A randomized, controlled trial of albumin versus saline for the treatment of intradialytic hypotension. J Am Soc Nephrol. 2004;15(2):487–492.
- Ferreira FL, Bota DP, Bross A, et al. Serial evaluation of the SOFA score to predict outcome in critically ill patients. JAMA. 2001;286(14):1754–1758.
- Kalcik M, Gursoy MO, Yesin M, et al. Review and update on ionotropes and vasopressors: Evidence-based use in cardiovascular diseases. Curr Res Cardiol. 2015;2(1):23–29.
- Fox SD, Henderson LW. Cardiovascular response during hemodialysis and hemofiltration: thermal, membrane, and catecholamine influences. Blood Purif. 1993;11(4):224–236.
- Honore PM, Jamez J, Wauthier M, et al. Prospective evaluation of short-term, high-volume isovolemic hemofiltration on the hemodynamic course and outcome in patients with intractable circulatory failure resulting from septic shock. Crit Care Med. 2000;28(11):3581–3587.
- Jeong JH, Biruete A, Fernhall B, et al. Effects of acute intradialytic exercise on cardiovascular responses in hemodialysis patients. Hemodial Int. 2018;22(4):524–533.
- Chaignon M, Aubert P, Martin MF, et al. Hemodynamic effects of hemodialysis and hemofiltration. Artif Organs. 1982;6(1):27–30.
- Pepi M, Marenzi GC, Agostoni PG, et al. Sustained cardiac diastolic changes elicited by ultrafiltration in patients with moderate congestive heart failure: pathophysiological correlates. Br Heart J. 1993;70(2):135–140.
- Karamperis N, Sloth E, Jensen JD. The hemodynamic effect of calcium ion concentration in the infusate during predilution hemofiltration in chronic renal failure. Am J Kidney Dis. 2005;46(3):470–480.
- Chou KJ, Lee PT, Chen CL, et al. Physiological changes during hemodialysis in patients with intradialysis hypertension. Kidney Int. 2006;69(10):1833–1838.
- Schmidt S, Westhoff T, Schlattmann P, et al. Analysis of transpulmonary thermodilution data confirms the influence of renal replacement therapy on thermodilution hemodynamic measurements. Anesth Analg. 2016;122(5):1474–1479.
- Czyzewski L, Wyzgal J, Sierdzinski J, et al. Comparison of 3 times a week 4- and 5-hour in-center hemodialysis sessions with use of continuous non-invasive hemodynamic monitoring. Ann Transplant. 2017;22:346–353.
- Ikaheimo M, Huttunen K, Takkunen J. Cardiac effects of chronic renal failure and haemodialysis treatment. Hypertensive versus normotensive patients. Br Heart J. 1981;45(6):710–716.
- Teo KK, Basile C, Ulan RA, et al. Comparison of hemodialysis and hypertonic hemodiafiltration on cardiac function [corrected]. Kidney Int. 1987;32(3):399–407.
- Rimondini A, Cipolla CM, Della Bella P, et al. Hemofiltration as short-term treatment for refractory congestive heart failure. Am J Med. 1987;83(1):43–48.
- Susini G, Zucchetti M, Bortone F, et al. Isolated ultrafiltration in cardiogenic pulmonary edema. Crit Care Med. 1990;18(1):14–17.
- Barnas MG, Boer WH, Koomans HA. Hemodynamic patterns and spectral analysis of heart rate variability during dialysis hypotension. J Am Soc Nephrol. 1999;10(12):2577–2584.
- Klouche K, Cavadore P, Portales P, et al. Continuous veno-venous hemofiltration improves hemodynamics in septic shock with acute renal failure without modifying TNFalpha and IL6 plasma concentrations. J Nephrol. 2002;15(2):150–157.
- Prakash S, Reddan D, Heidenheim AP, et al. Central, peripheral, and other blood volume changes during hemodialysis. Asaio J. 2002;48(4):379–382.
- Ratanarat R, Brendolan A, Piccinni P, et al. Pulse high-volume haemofiltration for treatment of severe sepsis: effects on hemodynamics and survival. Crit Care . 2005;9(4):R294–R302.
- Schytz PA, Mace ML, Soja AM, et al. Impact of extracorporeal blood flow rate on blood pressure, pulse rate and cardiac output during haemodialysis. Nephrol Dial Transplant. 2015;30(12):2075–2079.
- Sarafidis PA, Kamperidis V, Loutradis C, et al. Haemodialysis acutely deteriorates left and right diastolic function and myocardial performance: an effect related to high ultrafiltration volumes?. Nephrol Dial Transplant. 2017;32(8):1402–1409.
- Haag S, Friedrich B, Peter A, et al. Systemic haemodynamics in haemodialysis: intradialytic changes and prognostic significance. Nephrol Dial Transplant. 2018;33(8):1419–1427.
- Jefferies HJ, Virk B, Schiller B, et al. Frequent hemodialysis schedules are associated with reduced levels of dialysis-induced cardiac injury (myocardial stunning). CJASN. 2011;6(6):1326–1332.
- Burton JO, Jefferies HJ, Selby NM, et al. Hemodialysis-induced cardiac injury: determinants and associated outcomes. CJASN. 2009;4(5):914–920.
- McIntyre CW, Burton JO, Selby NM, et al. Hemodialysis-induced cardiac dysfunction is associated with an acute reduction in global and segmental myocardial blood flow. CJASN. 2008;3(1):19–26.
- Sharma S, Waikar SS. Intradialytic hypotension in acute kidney injury requiring renal replacement therapy. Semin Dial. 2017;30(6):553–558.
- Lynch KE, Ghassemi F, Flythe JE, et al. Sodium modelling to reduce intradialytic hypotension during haemodialysis for acute kidney injury in the intensive care unit. Nephrology (Carlton). 2016;21(10):870–877.