
Abstract
Objective
To investigate the way that miR-136 regulated spleen tyrosine kinase (SYK) and transforming growth factor-β1 (TGF-β1)/Smad3 signaling pathways on renal fibrosis.
Methods
100 male SD (Sprague-Dawley) rats were randomly divided into diabetic nephropathy (DN) group, normal control (NC) group, miR-136 mimics group, and control group. The renal fibrosis model of diabetic rats was established by streptozotocin (STZ) method. NRK-52E cells were transfected into six groups: HG group, HG + miR-136 group, HG + miR-NC group, miR-136 + SYK group, miR-136 + NC group, and control group. Histopathological examination, the expressions of miR-136 and SYK mRNA, the expression of mTOR, blood glucose, urine protein, body weight, creatinine level, blood urea nitrogen (BUN), and KW/BW were detected in each group. Transfection efficiency, the targeted binding, and regulation between miR-136 and SYK, as well as the expression level of related inflammatory factors, the expression levels of SYK, E-Cad (E-cadherin), Vimentin, Collagen I, α-smooth muscle actin (α-SMA), and vascular endothelial growth factor A (VEGFA) were detected.
Results
It was shown that the expression level of miR-136 in DN group significantly decreased. The blood glucose and urine protein concentrations in the DN group and miR-136 mimics group significantly increased and the body weight was decreased, but the blood glucose concentration in the miR-136 mimics group increased with time. The prolongation of the decline significantly decreased, and the growth rate of urinary protein reduced. Creatinine, BUN, and the kidney weight to body weight ratio (KW/BW) in DN group increased significantly. Cell culture results showed that SYK was a target gene of miR-136 and miR-136/SYK-mediated renal fibrosis by activating TGF-β1/Smad3 signal.
Conclusion
SYK activates TGF-β1/Smad3 signaling, while miR-136 inhibits TGF-β1/Smad3 signaling mediating tubular epithelial cell fibrosis by down-regulating SYK.
Introduction
Diabetes mellitus (DM) is one of the most common chronic diseases caused by insufficient insulin synthesis or insufficient insulin function [Citation1]. About 30–40% of diabetic patients with metabolic and hemodynamics develop a form of kidney disease called diabetic nephropathy (DN), which leads to end-stage renal failure [Citation2]. In North America, 20–40% of DN patients eventually develop renal failure [Citation3]. DN is characterized by glomerular hypertrophy, glomerular sclerosis, and interstitial fibrosis, which eventually leads to end stage renal disease (ESRD) [Citation4]. The pathogenesis of DN may involve hyperglycemia, hypertension, immunity, inflammation, deposition of advanced glycation products, dyslipidemia, and epithelial cell transdifferentiation [Citation5,Citation6]. Regardless of the initial etiology, renal fibrosis is the ultimate common pathway for the progression of chronic kidney disease (CKD) to end stage renal disease (ESRD) [Citation7]. The pathogenic role of tubulointerstitial fibrosis (TIF) associated with renal dysfunction is very prominent in T2DM. Many evidences show that TIF plays an important role in the pathogenesis of DN.
Splenic tyrosine kinase (SYK) encoded by SYK gene with its coding products exists in cells, mainly expressed in hematopoietic cells or lots of cancer cells [Citation8]. SYK also participates in regulating various inflammatory reactions [Citation9]. The absence of SYK inhibits the accumulation of CXCL2, IL-1β, and leukotriene B4 in inflammatory sites and the recruitment of neutrophils [Citation10]. Studies have shown that SYK is involved in the pathogenesis of diabetic complications. Yang et al. found that SYK mediated ERK and NF-kB pathways, up-regulated the transcription of transforming growth factor (TGF-β), which aggravated the damage of renal tubules [Citation11]. TGF-β1 is an important fibrogenic factor mediating TIF through multiple signaling pathways. The most classical TGF-β1/Smads signaling pathway mediates epithelial-mesenchymal transition (EMT) of renal tubular epithelial cells (RTEC) [Citation12,Citation13]. TGF-β1 may stimulate fibroblasts to secrete ECM components including Col-IV and FN, and ultimately aggravate fibrosis, which is one of the important mechanisms for the development of tubulointerstitial injury to TIF [Citation14].
MicroRNA is a non-coding single-stranded RNA related to many pathophysiological processes. Recent studies have shown that in vivo and in vitro, renal innate cells can induce the expression of some microRNA, which promotes the accumulation of ECM associated with renal fibrosis and renal dysfunction [Citation15,Citation16]. Strong data from mouse experiments on kidney phenotypes suggest that some microRNAs are involved in kidney dysfunction [Citation17,Citation18]. Evidences for these phenotypic changes included podocyte-specific Dicer deletion, proteinuria, podocyte fusion, podocyte apoptosis, glomerulosclerosis, and TIF with renal failure [Citation19–21]. miR-136, one of the well-known tumor suppressor, mediates the potential function of renal cell carcinoma [Citation22], however, the regulatory network of SYK/TGF-β1/Smad3 and miR-136 in the pathogenesis of DN remains largely unknown and needs further investigation.
Therefore, we hypothesized that miR-136 played a regulatory role in the progression of renal fibrosis via the mediation of SYK/TGF-β1/Smad3 axis. In this study, the relationship between miR-136 and SYK, TGF-β1/Smad3 signaling pathway, and renal fibrosis was observed in rat renal tubular epithelial cells and STZ diabetic rats, respectively. This study provides a new theoretical basis for further elucidating the antirenal fibrosis effect of miRNAs.
Materials and methods
Animal model and treatment
About 100 male SD rats (Charles River Laboratories, China) weighing 180–220 g were fed with routine diet and free drinking water and diet. Seven days later, they were randomly divided into DN group, NC group, miR-136 mimics group, and control group, 25 SD rats in each group. The plasmid containing miR-136 mimics (5′-ACUCCAUUUGUUUUGAUGAUGG-3′) and its negative control (5′-TTCTCCGAACGTGTCACGT-3′) were synthesized by GenePharm (Shanghai, China) and transfected into lentiviral vectors. Rats in DN group were given STZ (65 mg/kg) by intraperitoneal injection at one time to establish renal fibrosis model in diabetic rats. STZ was diluted in 0.1 mmol/L citric acid buffer (pH = 4.5). The injection was completed within 30 min and transferred on ice. Fasting blood glucose was measured at least 3 days after 72 h of injection. The model was successfully established with blood glucose > 16.7 mmol/L for 3 days. In NC group, lentivirus transfected with control sequence was injected into tail vein on the basis of model group. In the miR-136 mimics group, lentiviruses transfected with miR-136 mimics were injected into tail vein on the basis of model group. Control group received no special treatment.
Cell culture
NRK-52E cells were obtained from the Cell Bank of the Chinese Academy of Sciences (Shanghai, China) and cultured in vitro with ATCC complete growth medium (Dulbecco’s Modified Eagle’s Medium (DMEM) with 4 mM L-glutamine adjusted to contain 1.5 g/L sodium bicarbonate and 4.5 g/L glucose) containing 10% FBS and 1% penicillin and streptomycin (Life Technologies, USA). The cells were placed in a moisture incubator with 5% CO2. Lentiviral vectors expressing SYK and its corresponding negative control were purchased from Genepharm. One day after cell seeding, the cells were transfected with designated sequences using Lipofectamine 2000 (Invitrogen, USA) with a final concentration of 20 nmol/L according to the guidelines. NRK-52E cells were divided into six groups: (1) HG group: 25 mmol/L glucose was added during cell culture; (2) HG + miR-136 group: On the basis of HG group, miR-136 mimics were stably transfected; (3) HG + microRNA-NC group: cells were transfected with control miRNA and treated with 25 mmol/L glucose during culture; (4) HG + miR-136 + SYK group: On the basis of HG group, and stable transfection of miR-136 mimics and SYK; (5) HG + miR-136 + NC group: On the basis of HG group, and stable transfection of miR-136 mimics. (6) Control group: no special treatment.
Masson trichrome staining
The kidneys of these rats were extracted and histologically examined by Masson trichrome staining (Sigma-Aldrich) following the manufacturer’s instructions. Briefly, mordant in Bouin’s solution was microwaved for 1 min, washed with water to remove the picric acid for 5 min. Weigert’s working hematoxylin, 10 min. Blue in water for 5 min, rinse in distilled water. Biebrich scarlet for 5 min. Phosphotungstic acid for 10 min. Transfer directly into Aniline blue for 5 min. Rinse in distilled water. 1% acetic acid for 1 min, discard solution, rinse in distilled water. Dehydrate, clear, and coverslip. Under microscopy, the nuclei were black, cytoplasm and muscle erythrocytes were red, and the collagen was blue.
Periodic acid schiff (Pas) staining
The sections of rats’ kidney were dewaxed, sectioned, and hydrated. Soak slides in PAS solution (Abcam, UK) for 5–10 min. Rinse with water four times. Immerse the slide in a Schiff solution for 15–30 min and rinse. Stain the slides with HE for 2–3 min and rinse. Incubate in blue reagent for 30 s and rinse. Incubate in a light green solution for 2 min and rinse. Dehydrate with alcohol, removal, and fixation. Finally, the images were observed under microscopes.
Quantitative real-time PCR (RT-qPCR)
NRK-52E cells were transiently transfected with miR-136 mimics or specific controls. 36 h later, the total RNA was extracted and reversely transcribed into the first chain of cDNA using the ReverTra Ace Kit (Toyobo, Japan). Then, SYBR GREEN and ABI were utilized to perform RT-qPCR. The relative expression of these genes were calculated by 2−△△Ct, and U6 was set as the internal control of miRNA while GAPDH was set as the internal control for SYK. The primer forwards and primer reverses (GenePharm) were listed as follows ().
Table 1. The primer forwards and primer reverses.
Western blot
Cells were placed on ice and washed with pre-cold PBS for three times. Lyse the cells with RIPA buffer and discard the cellular debris by high-speed centrifugation. Take 20 μg cell lysate and an equal volume of 2× loading buffer, boil the cell lysate at 95 °C for 5 min. After 10-min centrifugation, 20 μg protein were loaded on 10% SDS-PAGE. Then, transfer the protein to PVDF membrane (MilliporeSigma, USA). After 1 h blocking with 5% defat milk, PVDF membrane was incubated with primary antibodies of mTOR, SYK, E-Cad, Vimentin, Collagen I, α-SMA, and VEGFA (Abcam) prepared with 1× TBST. And incubate in the refrigerator overnight. Next, the PVDF membrane was incubated with HRP-conjugated secondary antibodies (Abcam) after three times washing with 1× TBST. Finally, the membrane was treated with ECL solution and imaged under microscopies. All the primary antibodies were purchased from Cell Signaling Technology and diluted at the ratio of 1:1000.
Enzyme linked immunosorbent assay (ELISA)
ELISA was performed to detect the levels of IL-1B, IL-6, MCP-1, TNG-alpha, and vascular endothelial growth according to the manufacturer’s instructions (MyBioSource Inc.). The absorbance was detected at 450 and 550 nm.
Dual-luciferase reporter assay
Double Luciferase Report analysis (Promega Biotech Co., USA) was used to determine the targeting binding and regulation between miR-136 and SYK.
Statistical methods
SPSS 18.0 statistical software was used to process and analyze the data, and the measurement data were described by mean ± SD. All cell culture experiments were performed in triplicate. All measurements were repeated three times. One-way analysis of variance (ANOVA) and two-tailed Student’s t-test were used for statistical significance. The linear correlation analysis was performed to evaluate the relationship between miR-136 and SYK and TGF-β1/Smad3 signaling pathway. p < .05 was statistically significant.
Results
Histological examination of rat kidney
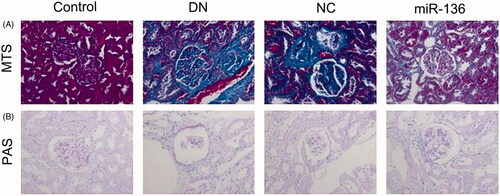
Masson trichrome staining and PAS staining were used to observe the renal fibrosis of rats in each group. The results showed that the renal tissue fibrosis in DN group and NC group was severe, and the renal tissue fibrosis in miR-136 group was alleviated. These results suggest that over-expression of miR-136 can alleviate renal fibrosis in rats ().
Figure 1. Renal fibrosis in rats of each group. MTS assay (A) or PAS staining (B) was performed, respectively, to measure the cell proliferation of control group, DN group, NC group, and miR-136 group.
Expression of SYK, miR-136, and mTOR in DN group and control group
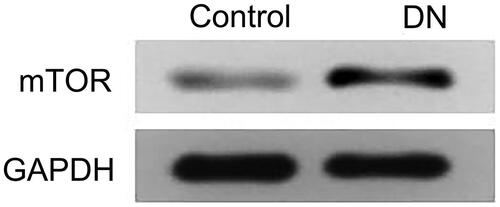
RT-qPCR was used to detect the expression of miR-136 and SYK, and WB method was used to detect the expression of mTOR. The results showed that the expression of miR-136 in DN group was significantly lower than that in control group (p < .05), while the expression of SYK and mTOR in DN group was significantly higher than that in control group (p < .05). The results suggest that SYK up-regulated in renal fibrosis, and the expression of miR-136 down-regulated ( and ).
Figure 2. The relative expression of SYK and miR-136 in DN group and control group. RT-qPCR was performed to detect the relative expression of SYK (A) and miR-136 in DN group and control group, respectively. Each assay was repeated in triplicates and p < .05 was set as the threshold of significant difference.
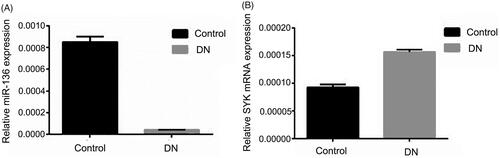
Figure 3. The protein expression of mTOR in DN group and control group. WB was utilized to measure the protein level of mTOR in DN group and control group.
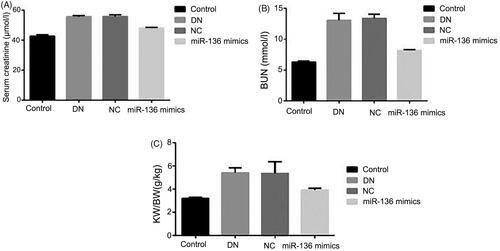
Blood sugar, urinary protein, body weight, creatinine, blood urea nitrogen (BUN), and KW/BW of rats in each group
The changes of blood sugar, urinary protein, and body weight with time and the expressions of creatinine, BUN and KW/BW in each group were detected. The results showed that the concentration of blood sugar and urinary protein in DN, NC and miR-136 mimics groups was significantly higher than that in control group (p < .05), and the body weight was significantly lower than that in control group (p < .05), but the concentration of blood sugar in miR-136 mimics group decreased significantly with the prolongation of time, the growth rate of urinary protein was lower than that in DN and NC groups, and the body weight also increased slowly. Creatinine, BUN, and KW/BW in DN group and NC group were significantly higher than those in miR-136 mimics group and control group (p < .05). The results suggest that over-expression of miR-136 can reduce blood sugar, urinary protein concentration, creatinine, BUN, and KW/BW levels and increase body weight in rats ( and ).
Figure 4. Changes of blood sugar, urinary protein and body weight with time in each group of rats. (A) Blood sugar was detected by hexokinase method. (B) Urinary protein was measured by biuret method. (C) Electronic scale was utilized to measure body weight.
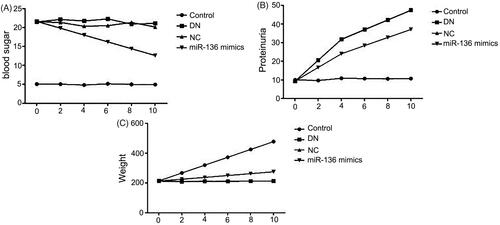
Figure 5. The levels creatinine, BUN and KW/BW levels in rats of each group. (A) Albumin creatinine ratio assay kit was applied to detect the level of creatinine. (B) BUN level was measured by BUN assay kit of Solarbio LIFE SCIENCES. (C) KW/BW level was shown by electronic scale and calculated by the following formula: KW/BW: kidney weight/body weight.
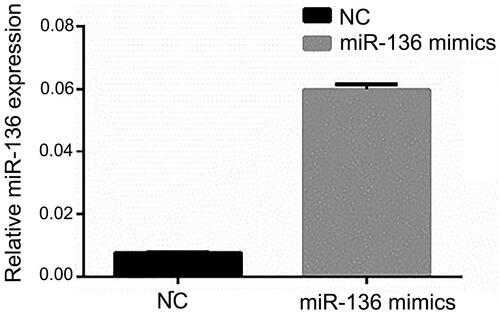
Cell transfection efficiency
RT-qPCR was used to detect the expression of miR-136 and SYK. The results showed that the expression level of SYK in SYK group was significantly higher than that in NC group (p < .05). The expression level of miR-136 in Mimics group was significantly higher than that in NC group (p < .05). The results suggested that the transfection efficiency of SYK and miR-136 was higher ( and ).
Figure 6. The mRNA expression of SYK mRNA in the two groups of cells. RT-qPCR was performed to measure the mRNA level of SYK.
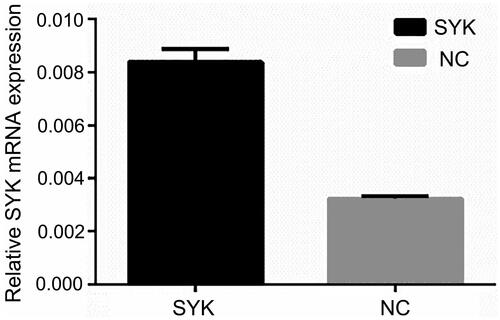
Figure 7. The relative expression of miR-136 in the two groups of cells. The relative level of miR-136 was measured by RT-qPCR.
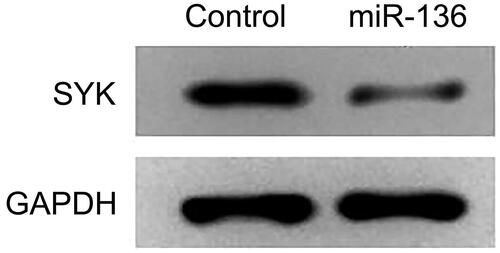
Targeting binding between miR-136 and SYK
Double Luciferase Report analysis was used to detect the binding of miR-136 to SYK. Wt group was 3′UTR wild type, mut group was 3′UTR predicted binding site mutation. The results showed that luciferase activity in the group of miR-136 mimic was lower than that in the group of NC (p < .05), but there was no difference between the two groups in mut (p > .05); the expression of SYK protein and gene in the group of miR-136 mimic was significantly lower than that in the control group (p < .05). The results suggest that miR-136 and SYK can be targeted ().
Figure 8. Luciferase activity of miR-136 mimics on the 3′ UTR of SYK. The relative luciferase activity was measured by double luciferase assay.
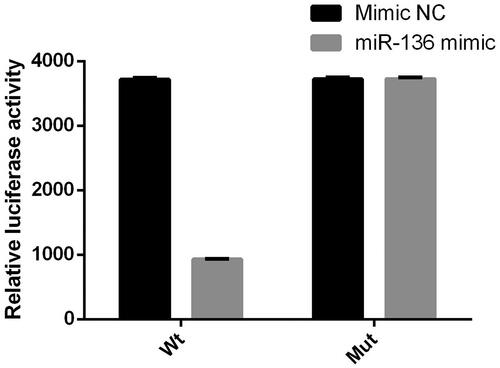
Figure 9. The mRNA expression of SKY mRNA in two groups of cells. The relative level of SYK in miR-136 mimics group and control group was measured by RT-qPCR, respectively.
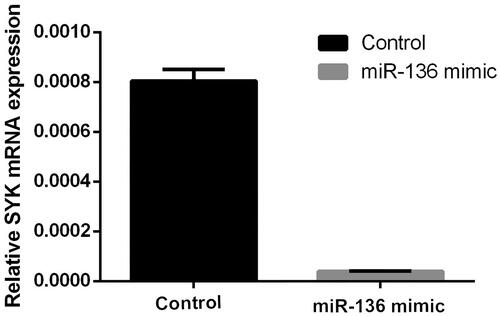
Figure 10. The protein expression of SKY in two groups of cells. The protein level of SYK in miR-136 mimics group and control group was measured by WB.
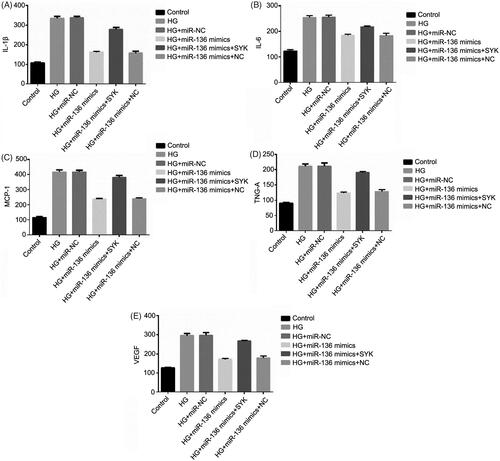
The expression of cell-related inflammatory factors in six groups
The expression of inflammatory factors was detected by ELISA. The expression levels of IL-1B, IL-6, MCP-1, TNG-alpha, and vascular endothelial growth factor in HG, HG + microRNA-NC, and HG + miR-136 + SYK groups were significantly higher than those in HG + miR-136 mics, HG + miR-136 + NC and control groups (p < .05). The results suggest that high glucose treatment induces the release of inflammatory factors, which is inhibited by miR-136, and SYK reverses the effect of miR-136 ().
Figure 11. The mRNA expression of IL-1β, IL-6, MCP-1, TNF-α, and VEGF in cells. The relative level of IL-1β(A), IL-6 (B), MCP-1 (C), TNF-α(D), and VEGF (E) were measured by RT-qPCR, respectively.
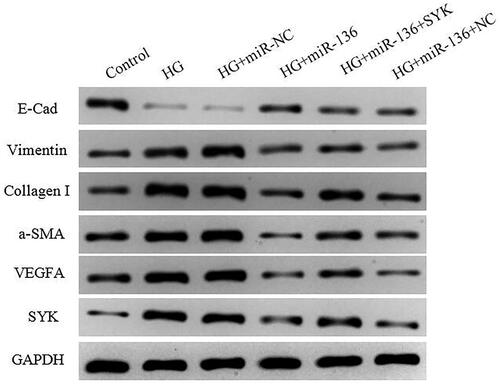
Expression levels of SYK, E-Cad, vimentin, collagen I, a-SMA, and VEGFA in cells of each group
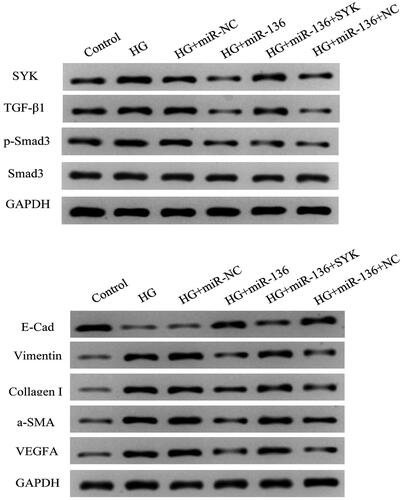
WB was used to detect the expression of SYK, E-Cad, Vimentin, Collagen I, a-SMA, and VEGFA. The results showed that the expression level of E-Cad in HG + mimics group and HG + miR-136 + NC group was lower than that in control group, higher than that in HG and HG + mir-NC group (p < .05). The expression levels of SYK, vimentin, collagen I, a-SMA, and VEGFA were higher than those of control group, but lower than those of HG group and HG + microRNA-NC group (p < .05). The HG + miR-136 + SYK group was at the intermediate level. The results suggest that miR-136 promotes the expression of E-Cad, inhibits the expression of SYK, Vimentin, Collagen I, a-SMA, and VEGFA, while SYK reverses the effect of miR-136 ().
Figure 12. The protein expression of SYK, E-Cad, vimentin, collagen I, α-SMA, and VEGFA in cells of each group. WB was performed to measure the protein level of SYK, E-Cad, Vimentin, Collagen I, α-SMA, and VEGFA.
Expression levels of TGF-β1, p-Smad3, and Smad3 in each group
The expression levels of TGF-β1 and p-Smad3 in HG + miR-136 mimics group were lower than those in HG group (p < .05), whereas the delivery of SYK-overexpression vectors partially restored the expressions of these proteins (p < .05). The expression levels of Samd3 remained unchanged among these groups (p > .05). These results suggest that miR-136/SYK mediates renal tubular epithelial fibrosis by activating TGF-β1/Smad3 signal ().
Figure 13. Expression levels of TGF-β1, p-Smad3, and Smad3 in each group. When cells were treated with various reagents, the protein level was detected by WB.
Discussion
The pathogenesis of DN is complex and involves many factors, but the exact pathogenesis of DN has not been fully elucidated. It involves the disorders of glycolipid metabolism, hypertension, immunity, inflammation, deposition of advanced glycation products, epithelial cell differentiation, renal hemodynamic changes, and other factors [Citation8–11]. Although advances in medical research in recent years have enabled us to better understand DN, the treatment of type 2 diabetes is still progressing slowly. Existing treatments still focus on improving blood sugar, RAAS blockers, weight loss, prevention and treatment of cardiovascular complications, improvement of metabolic disorders, and improvement of patients’ compliance with treatment options. These measures can only delay, not prevent, the progress of DN. The incidence of DN is still high, which brings huge economic and spiritual burden to our society and family. Therefore, searching for a new therapeutic drug or a new target for drug treatment has become an important topic of concern at home and abroad. For a long time, the research on the pathogenesis of DN has focused on the glomerulus. It is believed that the main pathological change of DN is glomerulosclerosis. Recent studies have shown that tubulointerstitial changes are independent of the onset time or pathogenesis [Citation23]. TIF is associated with chronic renal failure, which is more closely related to renal function, and is the main cause of ESRD [Citation24]. Renal tubulointerstitium accounts for more than 90% of the glomerular volume. Renal interstitial fibrosis in diabetic state can directly affect the prognosis of DN. Therefore, it has important theoretical and clinical significance to actively explore the mechanism and treatment strategies of diabetic tubulointerstitial lesions.
TGF-β 1 is currently recognized as the strongest fibrogenic factor, which mediates fibrosis through classical TGF-β1/Smads signaling pathway and plays an important role in the process of RIF [Citation25,Citation26]. In addition, a large number of studies have shown that SYK can be activated rapidly in high sugar environment [Citation27]. Therefore, we used STZ-induced diabetic SD rat model and high glucose-induced kidney cells in vitro to investigate the relationship between miR-136 and SYK and TGF-β1/Smad3 signaling pathway. Firstly, we found that SKY expression was up-regulated, and the expression of miR-136 was down-regulated in DN rat model. Overexpression of miR-136 could alleviate renal fibrosis. At the same time, over-expression of miR-136 could decrease blood sugar concentration, urinary protein growth rate, creatinine, BUN, and KW/BW in DN rats. Subsequently, we transfected NRK-52E cell line to study the targeting binding of miR-136 to SYK, the effect on inflammatory factors and the relationship between miR-136 and TGF-β1/Smad3 signaling pathway. We found that miR-136 could bind to SYK target. High glucose treatment could induce the release of inflammatory factors, but miR-136 inhibited the release of inflammatory factors, while SYK reversed the effect of miR-136. miR-136 promotes the expression of E-Cad and inhibits the expression of SYK, Vimentin, Collagen I, a-SMA, and VEGFA. Previous evidence showed that miR-136 regulated TGF-β1-induced proliferation arrest in keratinocytes [Citation28]. Also, it has been demonstrated that miR-136 suppressed epithelial–mesenchymal transition via targeting Smad2 and Smad3 signaling pathway [Citation29]. Here, we reported that decreased expressions of TGF-β1 and p-Smad3 in HG + miR-136 mimics group was partially resorted by the delivery of SYK-overexpression vectors, suggesting that miR-136/SYK mediates renal tubular epithelial fibrosis by activating TGF-β1/Smad3 signal.
In conclusion, in vivo and in vitro studies have demonstrated that the signaling pathways of miR-136, SYK, and TGF-beta 1/Smad3 play an important role in DN rat models and high-glucose-induced renal cells. It has been found that miR-136 can inhibit the fibrosis of renal tubular epithelial cells by targeting down-regulation of SYK, thus inhibiting the TGF-beta 1/Smad3 signaling pathway.
Disclosure statement
There are no conflicts of interest to declare.
Data availability statement
The data in the research can be obtained if necessary.
References
- Hu J, Ye M, Zhou Z. Aptamers: novel diagnostic and therapeutic tools for diabetes mellitus and metabolic diseases. J Mol Med. 2017;95(3):249–256.
- Sun X-Y, Qin H-J, Zhang ZE, et al. Valproate attenuates diabetic nephropathy through inhibition of endoplasmic reticulum stress induced apoptosis. Mol Med Rep. 2016;13(1):661–668.
- Xu B-H, Sheng J, You Y-K, et al. Deletion of Smad3 prevents renal fibrosis and inflammation in type 2 diabetic nephropathy. Metab Clin Exp. 2020;103:154013.
- Van Krieken R, Krepinsky JC. Caveolin-1 in the pathogenesis of diabetic nephropathy: potential therapeutic target? Curr Diab Rep. 2017;17(3):19.
- Sender V, Lang L, Stamme C. Surfactant protein-A modulates LPS-induced TLR4 localization and signaling via beta-arrestin 2. PLoS One. 2013;8(3):e59896.
- Wang S, Meng X-M, Ng Y-Y, et al. TGF-beta/Smad3 signalling regulates the transition of bone marrow-derived macrophages into myofibroblasts during tissue fibrosis. Oncotarget. 2016;7(8):8809–8822.
- Black LM, Lever JM, Agarwal A. Renal inflammation and fibrosis: a double-edged sword. J Histochem Cytochem. 2019;67(9):663–681.
- Liu D, Mamorska-Dyga A. Syk inhibitors in clinical development for hematological malignancies. J Hematol Oncol. 2017;10(1):145.
- Bijli KM, Fazal F, Minhajuddin M, et al. Activation of Syk by protein kinase C-delta regulates thrombin-induced intercellular adhesion molecule-1 expression in endothelial cells via tyrosine phosphorylation of RelA/p65. J Biol Chem. 2008;283(21):14674–14684.
- Nemeth T, Virtic O, Sitaru C, et al. The Syk tyrosine kinase is required for skin inflammation in an in vivo mouse model of epidermolysis bullosa acquisita. J Invest Dermatol. 2017;137(10):2131–2139.
- Yang WS, Chang JW, Han NJ, et al. Spleen tyrosine kinase mediates high glucose-induced transforming growth factor-beta1 up-regulation in proximal tubular epithelial cells. Exp Cell Res. 2012;318(15):1867–1876.
- Tang PM-K, Zhang Y-Y, Mak TS-K, et al. Transforming growth factor-beta signalling in renal fibrosis: from Smads to non-coding RNAs. J Physiol (Lond). 2018;596(16):3493–3503.
- Li X-W, Feng L-X, Zhu X-J, et al. Human umbilical cord blood mononuclear cells protect against renal tubulointerstitial fibrosis in cisplatin-treated rats. Biomed Pharmacother. 2020;121:109310.
- Maity S, Muhamed J, Sarikhani M, et al. Sirtuin 6 deficiency transcriptionally up-regulates TGF-beta signaling and induces fibrosis in mice. J Biol Chem. 2020;10(25):1–35.
- Fan Y, Chen H, Huang Z, et al. Emerging role of miRNAs in renal fibrosis. RNA Biol. 2020;17(1):1–12.
- Liu L, Wang Y, Yan R, et al. BMP-7 inhibits renal fibrosis in diabetic nephropathy via miR-21 downregulation. Life Sci. 2019;238:116957.
- Liu Y, Liu B, Liu Y, et al. MicroRNA expression profile by next-generation sequencing in a novel rat model of contrast-induced acute kidney injury. Ann Transl Med. 2019;7(8):178–178.
- Metzinger-Le Meuth V, Metzinger L. miR-223 and other miRNA’s evaluation in chronic kidney disease: Innovative biomarkers and therapeutic tools. Noncoding RNA Res. 2019;4(1):30–35.
- Harvey SJ, Jarad G, Cunningham J, et al. Podocyte-specific deletion of dicer alters cytoskeletal dynamics and causes glomerular disease. JASN. 2008;19(11):2150–2158.
- Ho J, Ng KH, Rosen S, et al. Podocyte-specific loss of functional microRNAs leads to rapid glomerular and tubular injury. JASN. 2008;19(11):2069–2075.
- Shi S, Yu L, Chiu C, et al. Podocyte-selective deletion of dicer induces proteinuria and glomerulosclerosis. JASN. 2008;19(11):2159–2169.
- Chen P, Zhao L, Pan X, et al. Tumor suppressor microRNA-136-5p regulates the cellular function of renal cell carcinoma. Oncol Lett. 2018;15(4):5995–6002.
- Joyce E, Glasner P, Ranganathan S, et al. Tubulointerstitial nephritis: diagnosis, treatment, and monitoring. Pediatr Nephrol. 2017;32(4):577–587.
- Hewitson TD, Holt SG, Smith ER, et al. Progression of tubulointerstitial fibrosis and the chronic kidney disease phenotype - role of risk factors and epigenetics. Front Pharmacol. 2017;8:520.
- Biernacka A, Dobaczewski M, Frangogiannis NG, et al. TGF-β signaling in fibrosis. Growth Factors. 2011;29(5):196–202.
- Nakerakanti S. The role of TGF-β receptors in fibrosis. Open Rheumatol J. 2012;6(1):156–162.
- Yang WS, Kim J-S, Han NJ, et al. Toll-like receptor 4/spleen tyrosine kinase complex in high glucose signal transduction of proximal tubular epithelial cells. Cell Physiol Biochem. 2015;35(6):2309–2319.
- Zhang D, Wang J, Wang Z, et al. miR-136 modulates TGF-β1-induced proliferation arrest by targeting PPP2R2A in keratinocytes. Biomed Res Int. 2015;2015:1–8.
- Yang Y, Liu L, Cai J, et al. Targeting Smad2 and Smad3 by miR-136 suppresses metastasis-associated traits of lung adenocarcinoma cells. Oncol Res. 2014;21(6):345–352.