
Abstract
Background
Prediction of prognosis in Immunoglobulin A Nephropathy (IgAN) and taking appropriate precautions may reduce annual incidence of chronic kidney disease. This may be possible by close follow-up for the development and progression of interstitial fibrosis (IF) or interstitial fibrosis/tubular atrophy (IFTA) in IgAN patients.
Aim
To investigate whether Young’s elastic modulus (YM) which measured shear wave elastography (SWE) might be used for follow-up of IF or IFTA in IgAN patients.
Methods
Prospective study was approved by Human Research Ethics Committee. Group 1 consisted of patients with IgAN. Group 2 consisted of healthy control participants. Young’s elastic modulus which is a value of stiffness along with longitudinal stiffness was used to evaluate tissue elasticity. Specificity, sensitivity, positive predictive value (PPV) of YM for the presence of IF and IFTA were evaluated.
Results
Group 1 consisted of 30 participants, and group 2 consisted of 32 participants. Sensitivity and specificity of SWE to diagnose presence of IF for YM > 15 kPa were 89% and 90%, respectively. PPV among the ones whom IF was diagnosed by YM >15 kPa was 91%. Sensitivity and specificity of SWE to diagnose presence of IFTA for YM > 15 were 65% and 51%, respectively. PPV among the ones whom IFTA was diagnosed by YM >15 kPa was 78.1%.
Conclusions
YM which measured SWE is highly specific and sensitive in the diagnosis of IF, but not for IFTA in IgAN patients. Therefore, progression for IF in IgAN may be followed by SWE.
Introduction
Immunoglobulin A Nephropathy (IgAN) is the most common primary glomerulonephritides worldwide [Citation1]. Primary glomerulonephritides are the third most common cause of chronic kidney disease (CKD) [Citation2]. Prediction of prognosis in IgAN and taking appropriate precautions may reduce annual incidence of CKD. This may be possible by close follow-up for the development and progression of interstitial fibrosis (IF) or interstitial fibrosis/tubular atrophy (IFTA) in IgAN patients [Citation3].
Interstitial fibrosis was considered in Oxford 2009 tubular classification [Citation4], whereas evaluation of IFTA was emphasized in the Oxford 2016 classification of IgAN [Citation3]. Degree of IF or IFTA is associated with prognosis of IgAN. Unfortunately, serum creatinine, estimated glomerular filtration rate (eGFR), and urinalysis which had been used in clinical practice are inadequate parameters for follow-up of IF or IFTA in patients with IgAN. Despite all the disadvantages, eGFR is still the best predictor of IF or IFTA as there was no alternative method, and is an important indicator of prognosis [Citation5].
Shear wave elastography (SWE) is a noninvasive test that may measure stiffness in the tissue. Young’s elastic modulus (YM) measured by SWE correlates with the degree of IF [Citation6,Citation7]. SWE may be an ideal method for long-term follow-up in IgAN as it is a noninvasive method which does not require radiocontrast agent use. This method has been used to demonstrate fibrosis in patient with liver cirrhosis. Using SWE, fibrosis can be assessed also in patients without cirrhosis, such as breast, thyroid, prostate diseases, and renal allograft [Citation8]. There is not enough knowledge about whether SWE can be used for the monitoring of IF and IFTA in patients with IgAN.
The aim of this study was to investigate whether YM which measured SWE might be used for follow-up of IF or IFTA in IgAN patients. We tried to determine which of the Oxford classification is related more closely with SWE.
Methods
Subjects
Prospective study design was approved by Human Research Ethics Committee (09/02/2017, 2017/29). Study was performed between March 2017 and September 2018. Patients were followed as outpatients by Mersin University School of Medicine, Nephrology department. Informed consent was obtained from patients.
Group 1 consisted of patients who had diagnosis of IgAN by renal biopsy. Group 2 consisted of healthy control participants who did not have any comorbidities, urinary sediment abnormality, or abnormal biochemical test results.
Exclusion criteria
For group 1, patients aged below 18 years, pregnant patients, renal transplant recipients, patients with diabetic kidney disease, patients with a body mass index > 35 kg/m2, congestive heart failure (CHF), acquired or congenital renal cysts, polycystic kidney disease, medullary cystic disease, medullary sponge kidney, renal vein thrombosis, nephrolithiasis, hydronephrosis, renal artery stenosis, renal mass, chronic obstructive pulmonary disease (COPD), Alzheimer’s disease, active infection, cerebrovascular disease (CVD), malignancy, cirrhosis, Parkinson’s disease, adrenal insufficiency, acute kidney injury, retroperitoneal hemorrhage, subcapsular hematoma, or intraparenchymal hemorrhage after renal biopsy and patients who declined to participate in the study were all excluded. Patients who had renal biopsy more than 1 week ago, and patients who initiated treatment within 1 week, secondary glomerular diseases, primary glomerular diseases other than IgAN, secondary IgAN, and crescentic IgAN were also excluded.
For group 2, patients aged below 18 years, patients with comorbidities, urinary sediment abnormalities, or biochemical abnormalities were excluded.
Imaging data
SWE was performed for group 1 patients within seven days after the renal biopsy before initiation of treatment. In addition to this, SWE was also performed for group 2 patients. The SWE examinations were performed by radiologist with more than 15 years of experience, who was blinded for the patient clinic data and renal biopsy results. Elastography results were recorded to electronic medical recording system just after the procedure. Ultrasonography (US) and SWE examinations were carried out with low-frequency (3.5–5 MHz) convex transducer, Canon Medical System (Otawara, Japan).
First, longitudinal dimensions of kidneys were measured in supine position with B mode. SWE evaluation was performed. SWE was used for the evaluation of kidney elasticity. YM which is a value of stiffness along with longitudinal stiffness was used to evaluate tissue elasticity. The tissue stiffness is quantified with YM, defined by the ratio between the applied stress and the induced strain and expressed in kPa [Citation9].
US pulses were applied to the target tissue for a very short time (0.003–0.4 ms) and acoustic radiation force was exerted. During SWE imaging, patients in lateral decubitus position were told to hold their breath. The probe was held in the sagittal plane, close to the kidney. A rectangular area (15 × 10 mm) within the renal cortex was assigned as the region of interest (ROI). ROI was set next to the inferior pole of the cortex to exclude vessels and to obtain the best acoustic window. Minimal pressure was applied on the probe. Distance between ROI and skin was noted. Five measurements were performed for each patient and average was taken. Measurements were performed from right kidney due to its more appropriate depth. Measurements were performed from left kidney when the right kidney was located deeper or a suitable acoustic window could not be obtained.
For renal USG evaluation, longitudinal dimension between 10 and 12 cm and renal parenchymal thickness between 20 and 30 mm were accepted as normal [Citation10].
Pathologic data
Renal biopsies were interpreted by a pathologist with more than 25 years professional experience (İ.G.).
Presence and grade of TA in renal biopsy specimens of group 1 patients were evaluated according to the Oxford classification of IgAN 2009 [Citation4]. TA was defined by the presence of thick irregular tubular basement membranes with reduced tubular diameter. It was scored according to the percentage of cortical area involvement, <1% was denoted as absence of TA, 1–5% rounded to 5% (moderate TA), and other values rounded to the nearest 10% (severe TA) [Citation4]. IF was defined as increased extracellular matrix separating tubules in the cortical area. It is scored as percentage involvement, <1% was denoted as absence of IF (stage F0), with 1–5% rounded to 5% (stage F1, moderate IF), and other values rounded to the nearest 10% (stage F2, severe IF) [Citation4]. The percentage of the cortical area involved by tubular atrophy or IF was quantitated [Citation3]. Grading of IFTA was performed according to Oxford classification of IgAN 2016. If percentage of IFTA ≤25%; stage T0 (mild IFTA), 26–50%; stage T1 (moderate IFTA), >50%; stage T2 (severe IFTA) [Citation3].
Cutoff values of YM for IF and IFTA were obtained.
Demographic and laboratory data
Laboratory data, demographic and ultrasonographic features of two groups were compared and associations were evaluated.
Arterial pulse, systolic blood pressure (SBP), and diastolic blood pressure (DBP) of all participants were measured. Blood samples were taken after 8 h of fasting for hemoglobin, serum glucose, blood urea nitrogen (BUN), and creatinine.
Twenty-four hour urine was collected to determine 24-h protein excretion. It was performed twice and average was calculated. eGFR was calculated by CKD-EPI formula (Chronic Kidney Disease Epidemiology Collaboration) = 141 × min(Scr/κ,1)α×max(Scr/κ,1) – 1.209 × 0.993age × 1.018 [female] × 1.159 [black]) [Citation11].
Serum plasma glucose, BUN, and creatinine were measured by Olympus AU 640 Chemistry Immunoanalyzer (Tokyo, Japan).
Presence of comorbidities like CHF, hypertension (HT), diabetes mellitus (DM), COPD, Alzheimer’s disease, CVD, malignancy, CVO, cirrhosis, Parkinson’s disease, and adrenal insufficiency were evaluated.
Associated factors with YM
Association between IFTA stages (stages T0, T1, and T2) and YM was investigated in group 1. Association between IF stages (stages F0, F1, and F2) and YM was also evaluated in group 1. Light microscopic images of renal biopsy specimens were obtained. IF and IFTA stages in light microscopic examination were compared with YM.
YM of group 2 was measured.
YM of group 1 and group 2 was compared.
Associations between YM and 24-h urine protein excretion, ultrasonographic renal dimensions (URDs), gender, age, eGFR, ultrasonographic renal parenchymal thickness (URPT), and serum creatinine were also investigated.
Possible influencing factors for YM were investigated.
Specificity, sensitivity, accuracy, positive predictive value (PPV), and negative predictive value (NPV) for the presence of IF and IFTA were evaluated.
Associated factors with IF and IFTA
Relation between IF and 24-h urine protein excretion, URD, gender, age, eGFR, URPT, and serum creatinine were investigated. Relation between IFTA and 24-h urine protein excretion, URD, gender, age, eGFR, URPT, and serum creatinine were also investigated.
Specificity, sensitivity, accuracy, PPV, and NPV of eGFR for the presence of IF and IFTA were evaluated.
Associated factors with URD and URPT
Specificity, sensitivity, accuracy, PPV, and NPV of both URD and URPT for the presence of IF and IFTA were evaluated.
Statistical analysis
MedCalc packet program was used for statistical analysis. The mean ± standard deviation was used for descriptive statistics for non-normally distributed variables. For the mean comparisons of the groups, where more than two groups involved, one-way analysis of variance was applied. ROC curve analysis was used to evaluate diagnostic performance of YM and eGFR for IF. Area under the ROC curve was calculated. Besides sensitivity, specificity, PPV and NPV, accuracy values were calculated.
YMs were converted to three level ordinal categorical level (percentile and cutoff methods) in order to analyze associations between YM and IFTA (stages T0, T1, and T2) and IF (stages F0, F1, and F2) according to the Oxford classification of IgAN 2016 and 2009, and Kendall’s Tau-b statistic was used for compliance analysis.
Pearson’s correlation analysis was used to test linear association between eGFR and YM and scatter plot was performed. Ordinal logistic regression analysis was used to evaluate the importance of each variable (such as age, gender, eGFR, ROI, IF, and IFTA) in determining YM.
Results
Group 1 consisted of 30 participants (15 males, 15 females), and group 2 consisted of 32 participants (16 males, 16 females). Mean age was 40.2 ± 11.3 years for group 1 and 39.2 ± 8.6 years for group 2 (p> .05).
In group 1, distribution of participants according to IF was as follows: stage F0: n = 9, F1; n = 10, F2; n = 11, whereas distribution of participants according to IFTA was as follows: stage T0: n = 9, T1; n = 11, T2; n = 10 patients.
There were statistically significant difference between serum creatinine, YM, 24-h urine protein excretion, parenchymal thickness, and eGFR values of groups 1 and 2 (p<.05), whereas there was no difference between ROI and kidney dimensions of groups 1 and 2 (p>.05).
Cutoff values of YM: In case of absent IF and mild IFTA, YM was between 0 and 15 kPa, whereas YM was 16–27 kPa for moderate IF and moderate IFTA, and >28 kPa for severe IF and severe IFTA. Laboratory data, demographic and ultrasonographic features of groups are shown in .
Table 1. Laboratory data, demographic and ultrasonographic features of all patients (mean values).
Factors affecting the YM: The factors affecting the YM are shown in . eGFR (estimated: −0.066; 95% CI: −0.094 to −0.038; p<.001) and IF (estimated: 0.058; 95% CI: 0.041–0.085; p<.001) were found to be the factors affecting the YM.
Table 2. Factors affecting YM.
Association between YM and IF: YM values of stages F0, F1, and F2 in group 1 were 8.2 ± 1.3 kPa, 19.3 ± 2.4 kPa, and 47.9 ± 3.6 kPa, respectively. Chi square analysis revealed significant difference between YM and F0, F1, and F2 stages (Pearson’s Chi square p<.001). Kendall’s Tau-b statistics revealed a difference of 0.519 which was statistically significant between YM and F0, F1, and F2 stages (p<.001).
Association between YM and IFTA: YM of T0, T1, and T2 stages in group 1 were 14.4 ± 1.7 kPa, 23.3 ± 2.9 kPa, and 32.9 ± 2.6 kPa, respectively. Chi square analysis revealed significant difference between YM and T0, T1, and T2 stages (Pearson’s Chi square p<.026). However, Kendall’s Tau-b statistics revealed a difference of 0.185 which was not statistically significant between YM and T0, T1, and T2 stages (p = .332).
There was statistically significant difference between YM of stage F0 and T0, F1 and T1, F2 and T2 (for all, p<.05).
Other factors associated with YM: Significant negative correlation was present between YM and URD and URPT (p< .05, r= −0.789, r= −0.705 for all). Besides, significant negative correlation was present between YM and eGFR (p< .05, r= −0.710). There was positive correlation between YM and creatinine, age (p< .05 for all, r = 0.415, r = 0.538). There was not statistical association between YM and 24-h urine protein excretion, and gender (p> .05 for all, r = 0.181, r = 0.158).
Light microscopic findings of renal tissue and their YM images: Light microscopic findings of renal tissue demonstrating IFTA and IF in IgAN patients and their YM images are shown in . Patient 1 was found to have stage F0 according to the 2009 Oxford classification, but stage T1 according to the 2016 Oxford classification. The YM of this patient was found to be 7.2 kPa (). This result was consistent with stage F0 in Oxford 2009 classification.
Figure 1. Patient 1: light microscopic images of renal tissue that stage T1 (moderate IFTA)-stage F0 (absence of IF) and their SWE image. (a) H&E ×200. (b) Masson’s trichrome ×200. (c) YM = 7.2 kPa (compatible with the stage F0 (absence of IF)).
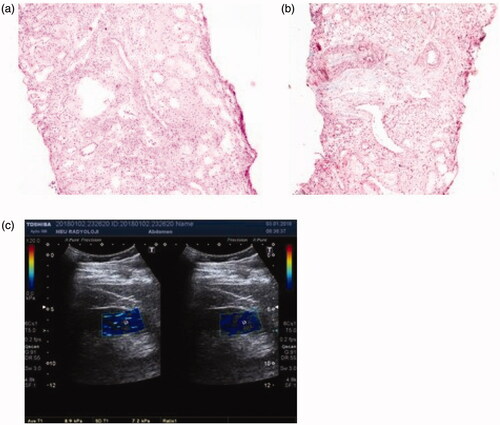
Figure 2. Patient 2: light microscopic images of renal tissue that stage T1 (moderate IFTA)-stage F2 (severe IF) and their SWE image. (a) H&E ×200. (b) Masson’s trichrome ×200. (c) YM = 29.7 kPa (compatible with the stage F2 (severe IF)).
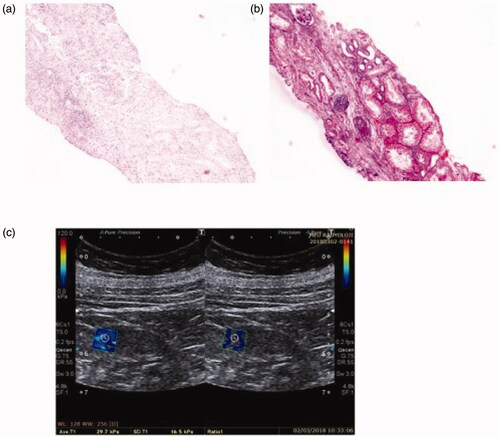
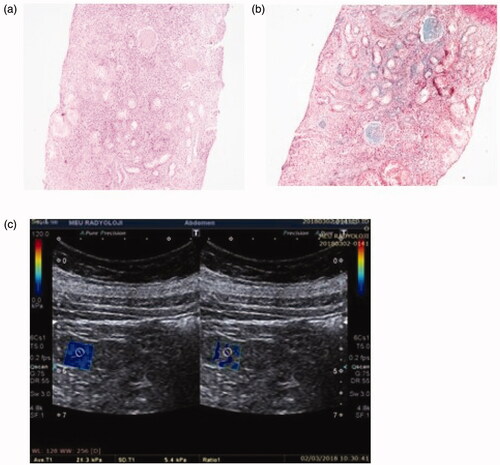
Figure 3. Patient 3: light microscopic images of renal tissue that stage T2 (severe IFTA)-stage F1 (moderate IF) and their SWE image. (a) H&E ×200. (b) Masson’s trichrome ×200. (c) YM = 21.3 kPa (compatible with the stage F1 (moderate IF)).
Patient 2 was found to have stage F2 according to the 2009 Oxford classification, but stage T1 according to the 2016 Oxford classification. The YM of this patient was found to be 29.7 kPa. This result was consistent with stage F2 in Oxford 2009 classification ().
Patient 3 was found to have stage F1 according to the 2009 Oxford classification, but stage T2 according to the 2016 Oxford classification. The YM of this patient was found to be 21.3 kPa. This result was consistent with stage F1 in Oxford 2009 classification ().
Sensitivity, specificity, PPV, NPV, accuracy of SWE, URD, URPT, and eGFR to diagnose presence of IF are shown in . Sensitivity and specificity of SWE to diagnose presence of IF for YM > 15 kPa were found high. Similarly, PPV, NPV, and accuracy among the ones whom IF was diagnosed by YM > 15 kPa were found high. However, sensitivity, NPV and accuracy of URD and URPT for detection of IF were found to be low. Sensitivity, specificity, PPV, NPV, and accuracy of eGFR to diagnose for presence of IF were found to be high. The difference between ROC curves of SWE and eGFR (0.0316) was not statistically significant (p=.237).
Table 3. Sensitivity, specificity, PPV, NPV, accuracy of SWE, URD, URPT, and eGFR to diagnose presence of IF.
Sensitivity, specificity, PPV, NPV, accuracy of SWE, URD, URPT, and eGFR to diagnose presence of IFTA are shown in . Sensitivity and specificity of SWE to diagnose presence of IFTA for YM > 15 were found low. Similarly, PPV, NPV, and accuracy among the ones whom IFTA was diagnosed by YM > 15 kPa were found low. Sensitivity and specificity of URD and URPT for detection of IFTA were low. Furthermore, PPV, NPV and accuracy of URD and URPT to diagnose IFTA were all low.
Table 4. Sensitivity, specificity, PPV, NPV, accuracy of SWE, URD, URPT, and eGFR to diagnose presence of IFTA.
Associated factors with URD and URPT: There was significant negative association between URD and serum creatinine, age (p<.05, r= −0.445, r= −0.443), whereas significant positive correlation was present between URD and eGFR (p<.05, r = 0.460).
There was significant negative correlation between URPT and serum creatinine, age (p<.05, r= −0.443, r= −0.442) whereas significant positive correlation was present between URPT and eGFR (p<.05, r = 0.460).
Other factors associated with IF: There was no significant association between IF and 24-h urine protein excretion, gender (p> .05 for all, r = 0.121, r = 0.099, respectively). There was significant negative association between IF and eGFR, URD, and URPT (p< .05 for all, r= −0.811, r= −0.647, r= −0.587, respectively). Positive correlation was present between IF and serum creatinine, age, YM (p< .05, for all, r = 0.785, r = 0.675, r = 0.712, respectively).
Other factors associated with IFTA: There was no significant association between IFTA and 24-h urine protein excretion, gender, URD and URPT, YM (p>.05 for all, r = 0.112, r = 0.215, r= −0.109, r= −0.117, r = 0.111).
Positive correlation was present between IFTA and serum creatinine, age (p<.05 for all, r = 0.659, r = 0.562). There was significant negative association between IFTA and eGFR (p<.05, r= −0.791).
Discussion
The association between YM and IF was investigated in many trials in CKD and renal transplantation, but not in IgAN. To the best of our knowledge, our study was first prospective controlled study which investigated specificity and sensitivity of YM in determining IF and IFTA. Besides, correlation between YM and Oxford classification was found out.
In this prospective study, sensitivity, specificity, NPV and PPV of SWE for IF in IgAN were found quite high but SWE was not specific and sensitive for IFTA. Significant correlation was found between YM and pathological classification according to IF, whereas there was no correlation when pathological classification was performed based on IFTA. In addition, in this study, the IF in IgAN patients was found to be an influencing factor for YM. IgAN is a nephritis with IF and IFTA [Citation12]. Both IF and IFTA are factors that determine renal survival in IgAN patients. Noninvasive methods are required for the follow-up of renal survival. Long-term follow-up of IF or IFTA in IgAN is important [Citation12,Citation13]. SWE is a simple and noninvasive method for the assessment of renal tissue elasticity. In comparison to the other types of US technologies, SWE is more specific and sensitive for fibrosis [Citation14]. Although specificity of SWE for fibrosis in liver cirrhosis, breast, and thyroid diseases was proved [Citation15–21], studies in kidney diseases were still inadequate. Trials investigating specificity and sensitivity of SWE for renal fibrosis were mostly performed in renal transplant and CKD patients and significant results were reported [Citation14,Citation22–29]. However, it was unclear whether follow-up of IF and IFTA may be performed by SWE. Nakao et al. compared YM and biopsy findings of 27 renal transplant patients. They found that elasticity score was significantly associated with IF and eGFR. Significant difference was found between YM of patients with eGFR > 50 mL/min and <50 mL/min [Citation29]. SWE was not associated with IF in some trials performed in native kidneys. However, limited number of patients, preliminary design, and absence of healthy control group were limitations of these studies [Citation30,Citation31]. Guo et al. found strong correlation between renal histologic score and YM. In this trial, they emphasized that SWE may take place of renal biopsy for the determination of IF [Citation27]. Samir et al. found that SWE in CKD was significantly different from healthy control. However, they did not compare histopathological IF score and SWE [Citation32]. In our study, correlation was found between severity of IF and YM in IgAN patients who had IF in biopsy. In addition to this, YM was significantly higher in IgAN patients with IF than control group. Peng et al. carried out a study in patients with IgAN, minimal change disease, focal segmental glomerulosclerosis, membranous nephropathy and CKD, and found an association between YM and severity of IF, TA [Citation33]. IgAN patients were classified according to Oxford Classification M0 (M = mesangial sclerosis), M1, E0 (E = endocapillary sclerosis), E1, T0 (T = tubular atrophy/interstitial fibrosis), T1 and patients with all stages were included into the study. Peng et al. found that the TA and YM were compatible. This result was not consistent with the outcome of our study. SWE may not be specific for mesangial sclerosis, endocapillary proliferation, and TA. This might confound statistical results in Peng’s study. Also, there was no healthy control group in Peng’s study. In that study, characteristics of patients with IgAN and exclusion criteria were not well defined [Citation33]. In addition, in our study, IF was a factor that affects the YM. In contrast, IFTA was not a factor affecting the YM. This is because; IF is associated with tissue stiffness but not IFTA. In our study, we found that YM was specific and sensitive when IF alone was considered in IgAN, but not specific when classified according to IFTA. For this reason, IF may be followed by SWE in IgAN.
Increase in proteinuria in the initial phase of IgAN was associated with severity of the disease [Citation34]. Persistent proteinuria may lead to tubular inflammation, TA, IF, and increased intraglomerular pressure, which all may lead to irreversible injury [Citation35]. Proteinuria may decrease by the development of glomerulosclerosis [Citation36]. Therefore, amount of proteinuria may not be associated with the IF or IFTA. Lin et al. reported significant correlation between 24-h urine protein excretion and YM in CKD [Citation37]. They found that YM increases as CKD stage progresses. As there was a significant association between 24-h urine protein excretion and YM, they supposed that there may be an association between 24-h urine protein excretion and fibrosis. However, they did not perform biopsy in their trial, and they did not compare directly histopathologic score and 24-h urine protein excretion. Goya et al. found significant association between YM and proteinuria in diabetic nephropathy [Citation38]. Goya et al. grouped patients according to 24-h urine protein excretion without considering histopathologic scoring and compared YM. This is far from comparing IF and 24-h urinary protein excretion. In many trials, 24-h urine protein excretion was considered as prognostic factor. However, upper threshold indicating poor prognosis is unknown [Citation38]. Chen et al. pointed out that daily urine protein excretion above 500 mg indicated poor prognosis in IgAN [Citation34]. In another trial, they emphasized that threshold was 1 g [Citation39]. Therefore, 24-h urine protein excretion was insufficient to predict progression of fibrosis in IgAN [Citation40,Citation41]. We need markers other than 24-h urine protein excretion which may help us to predict presence and progression of IF or IFTA. In our trial, although we found association between IF and YM, no association was documented between YM and 24-h urine protein excretion. In our study, no association was found between IF, IFTA and 24-h urine protein excretion. According to this result, SWE may be more useful than 24-h urine protein excretion for the follow-up of IF in IgAN.
In adults, as age passes eGFR decreases and histopathologic findings like IF, TA occur [Citation42]. In one study, there was no association between YM and age [Citation43]. Similarly, Goya et al. carried out a study in diabetic nephropathy patients and healthy control group and reported that YM was significantly associated with serum creatinine, and eGFR whereas YM was not found associated with age [Citation38]. In our study, age was found to be associated with IF, IFTA, YM, URD, and URPT. In CKD, age should be considered when SWE is performed. However, in another study performed in 45 patients with CKD, no association was found between eGFR and YM [Citation38]. Small number of patients was the limitation of the study. Increase in serum creatinine and decrease in eGFR may be related to the progression of IF [Citation27]. However, serum creatinine may be affected from extrarenal factors such as gender, age, race, use of trimethoprim, cimetidine, or fibric acid [Citation44]. Despite the handicaps of eGFR in determination of IF, there was no alternative method in clinical practice. Although we found high sensitivity and specificity of eGFR for the determination of IF, we know that serum creatinine may be affected from various factors like the drugs used. New methods are needed to show the progression of IF in addition to serum creatinine and eGFR.
In our study, we found that IF, IFTA, and YM were significantly associated with eGFR and serum creatinine. In our study, there was no difference between eGFR and SWE. SWE may be an adjunct method to eGFR to diagnose IF. Low eGFR and YM > 15 kPa measured by SWE in patients with IgAN indicated presence of IF. Early diagnosis and timely intervention of IF may slow the progression and improve quality of life of the patients with IgAN.
Small kidney URD and thin URPT were reported as indicators of glomerular sclerosis and IF in some trials [Citation45,Citation46]. However, these were late signs of IF [Citation47]. SWE may help early diagnosis of IF [Citation23]. In our trial, URD and URPT had low sensitivity, but high specificity for the diagnosis of IF. IF cannot be excluded in patients with normal URD and URPT. URD and URPT had a high PPV and low NPV for IF. However, sensitivity, specificity, PPV and NPV values for YM to diagnose IF were high. Therefore, YM may be used for early diagnosis and follow-up of IF. In our study, correlation was also present between YM and URD and URPT. At the same time, in our study, URD and URPT sensitivity, specificity, PPV, NPV were not significant in detecting IFTA. Besides, URD and URPT were not related to IFTA. The cause of this may be presence of TA in IFTA. TA is defined as wasting of tubules as a result of ischemia, obstruction, or severe cellular injury. The tubular cells are usually reduced in size and filled with casts. The tubular basal membranes are often thickened. However, interstitial expansion by collagen-rich matrix and increased fibroblasts were present in IF definition, but not in TA [Citation48]. URD and URPT may not be affected by this process. This result indicates the importance of SWE for identification and early diagnosis of IF.
Limitations
One of the limitations of our study was the limited number of the patients enrolled. Subgroup analysis could not be performed. Second, YM was not measured after the treatment in IgAN patients. Third, distance between ROI and skin was <4 cm in our patients. For this reason, results were not applicable for the countries where people have distance between ROI and skin was >4 cm.
Conclusions
YM which measured SWE is highly specific and sensitive in the diagnosis of IF, but not for IFTA in IgAN patients. In future, SWE may be used in clinical practice to follow IF in IgAN. However, these results should be confirmed by randomized controlled trials, and long-term studies with higher number of patients, including treatment periods.
Ethical approval
Prospective study design was approved by Human Research Ethics Committee (09/02/2017, 2017/29). Patients were followed as outpatients by Mersin University School of Medicine, Nephrology department. Informed consent was taken from all patients.
Acknowledgements
This study was accepted as poster communication at the 55rd ERA-EDTA Congress, 2018.
Disclosure statement
No potential conflict of interest was reported by the author(s).
References
- Wyatt RJ, Julian BA. IgA nephropathy. N Engl J Med. 2013;368(25):2402–2414.
- Turkey Kidney Diseases Prevention and Control Program (2014–2017); 2014. http://www.nefroloji.org.tr/pdf/Turkiye_Bobrek_Hastaliklari_Onleme_ve_Kontrol_Programi.pdf
- Trimarchi H, Barratt J, Cattran DC, et al. IgAN classification working group of the international IgA nephropathy network and the renal pathology society, conference participants. Oxford classification of IgA nephropathy 2016: an update from the IgA nephropathy classification working group. Kidney Int. 2017;91(5):1014–1021.
- Roberts IS, Cook HT, Troyanov S, et al.; Working Group of the International IgA Nephropathy Network and the Renal Pathology Society. The Oxford classification of IgA nephropathy: pathology definitions, correlations, and reproducibility. Kidney Int. 2009;76(5):546–556.
- KDIGO clinical practice guideline for glomerulonephritis. Kidney Int Suppl. 2012;2:259–274.
- Urban MW, Chen S, Fatemi M. A review of shearwave dispersion ultrasound vibrometry (SDUV) and its applications. Curr Med Imaging Rev. 2012;8(1):27–36.
- Sasaki Y, Hirooka Y, Kawashima H, et al. Measurements of renal shear wave velocities in chronic kidney disease patients. Acta Radiol. 2018;59(7):884–890.
- Chen S, Sanchez W, Callstrom MR, et al. Assessment of liver viscoelasticity by using shear waves induced by ultrasound radiation force. Radiology. 2013;266(3):964–970.
- Gennisson JL, Deffieux T, Fink M, et al. Ultrasound elastography: principles and techniques. Diagn Interv Imaging. 2013;94(5):487–495.
- Emamian SA, Nielsen MB, Pedersen JF, et al. Kidney dimensions at sonography: correlation with age, sex, and habitus in 665 adult volunteers. AJR Am J Roentgenol. 1993;160(1):83–86.
- Levey AS, Stevens LA, Schmid CH, et al. A new equation to estimate glomerular filtration rate. Ann Intern Med. 2009;150(9):604–612.
- Haas M. Histologic subclassification of IgA nephropathy: a clinicopathologic study of 244 cases. Am J Kidney Dis. 1997;29(6):829–842.
- Barbour SJ, Espino-Hernandez G, Reich HN, et al. The MEST score provides earlier risk prediction in lgA nephropathy. Kidney Int. 2016;89(1):167–175.
- Shiina T, Yamakawa M, Nitta N, et al. Recent progress of ultrasound elasticity imaging technology. Int Congr Ser. 2004;1274:59–63.
- Kircheis G, Sagir A, Vogt C, et al. Evaluation of acoustic radiation force impulse imaging for determination of liver stiffness using transient elastography as a reference. World J Gastroenterol. 2012;18(10):1077–1084.
- Friedrich-Rust M, Buggisch P, de Knegt RJ, et al. Acoustic radiation force impulse imaging for non-invasive assessment of liver fibrosis in chronic hepatitis B. J Viral Hepat. 2013;20(4):240–247.
- Zheng XZ, Ji P, Mao HW, et al. A novel approach to assessing changes in prostate stiffness with age using virtual touch tissue quantification. J Ultrasound Med. 2011;30:387–390.
- D'Anastasi M, Schneevoigt BS, Trottmann M, et al. Acoustic radiation force impulse imaging of the testes: a preliminary experience. Clin Hemorheol Microcirc. 2011;49(1–4):105–114.
- Bai M, Du L, Gu J, et al. Virtual touch tissue quantification using acoustic radiation force impulse technology: initial clinical experience with solid breast masses. J Ultrasound Med. 2012;31(2):289–294.
- Zhang YF, Xu HX, He Y, et al. Virtual touch tissue quantification of acoustic radiation force impulse: a new ultrasound elastic imaging in the diagnosis of thyroid nodules. PLoS One. 2012;7(11):e49094.
- Arndt R, Schmidt S, Loddenkemper C, et al. Noninvasive evaluation of renal allograft fibrosis by transient elastography – a pilot study. Transpl Int. 2010;23:871–877.
- Orlacchio A, Chegai F, Del Giudice C, et al. Kidney transplant: usefulness of real-time elastography (RTE) in the diagnosis of graft interstitial fibrosis. Ultrasound Med Biol. 2014;40(11):2564–2572.
- Whittier WL, Korbet SM. Indications for and complications of renal biopsy. Uptodate. 2018;20:4.
- Grenier N, Poulain S, Lepreux S, et al. Quantitative elastography of renal transplants using supersonic shear imaging: a pilot study. Eur Radiol. 2012;22(10):2138–2146.
- Sommerer C, Scharf M, Seitz C, et al. Assessment of renal allograft fibrosis by transient elastography. Transpl Int. 2013;26(5):545–551.
- Guo LH, Xu HX, Fu HJ, et al. Acoustic radiation force impulse imaging for noninvasive evaluation of renal parenchyma elasticity: preliminary findings. PLoS One. 2013;8(7):e68925.
- Stock KF, Klein BS, Vo Cong MT, et al. ARFI-based tissue elasticity quantification in comparison to histology for the diagnosis of renal transplant fibrosis. Clin Hemorheol Microcirc. 2010;46(2–3):139–148.
- He WY, Jin YJ, Wang WP, et al. Tissue elasticity quantification by acoustic radiation force impulse for the assessment of renal allograft function. Ultrasound Med Biol. 2014;40(2):322–329.
- Nakao T, Ushigome H, Nakamura T, et al. Evaluation of renal allograft fibrosis by transient elastography (Fibro Scan). Transplant Proc. 2015;47(3):640–643.
- Wang L, Xia P, Lv K, et al. Assessment of renal tissue elasticity by acoustic radiation force impulse quantification with histopathological correlation: preliminary experience in chronic kidney disease. Eur Radiol. 2014;24(7):1694–1699.
- Syversveen T, Brabrand K, Midtvedt K, et al. Assessment of renal allograft fibrosis by acoustic radiation force impulse quantification—a pilot study. Transpl Int. 2011;24(1):100–105.
- Samir AE, Allegretti AS, Zhu Q, et al. Shear wave elastography in chronic kidney disease: a pilot experience in native kidneys. BMC Nephrol. 2015;16(1):116.
- Peng L, Zhong T, Fan Q, et al. Correlation analysis of renal ultrasound elastography and clinical and pathological changes in patients with chronic kidney disease. Clin Nephrol. 2017;87(6):293–300.
- Chen D, Liu J, Duan S, et al. Clinicopathological features to predict progression of IgA nephropathy with mild proteinuria. Kidney Blood Press Res. 2018;43(2):318–328.
- Van Kooten C, Gerritsma JSJ, Paape MA, et al. Possible role for CD40-CD40L in the regulation of interstitial infiltration in the kidney. Kidney Int. 1997;51(3):711–721.
- Brunskill NJ. Rapamycin: a new string to the antiproteinuric bow? J Am Soc Nephrol. 2005;16(7):1878–1879.
- Lin HY, Lee YL, Lin KD, et al. Association of renal elasticity and renal function progression in patients with chronic kidney disease evaluated by real-time ultrasound elastography. Sci Rep. 2017;7(1):43303.
- Goya C, Kilinc F, Hamidi C, et al. Acoustic radiation force impulse imaging for evaluation of renal parenchyma elasticity in diabetic nephropathy. AJR Am J Roentgenol. 2015;204(2):324–329.
- Berthoux F, Mohey H, Laurent B, et al. Predicting the risk for dialysis or death in IgA nephropathy. J Am Soc Nephrol. 2011;22(4):752–761.
- Coppo R, D'Amico G. Factors predicting progression of IgA nephropathies. J Nephrol. 2005;18(5):503–512.
- Donadio JV, Bergstralh EJ, Grande JP. Proteinuria patterns and their association with subsequent endstage renal disease in IgA nephropathy. Nephrol Dial Transplant. 2002;17(7):1197–1203.
- National Kidney Foundation. K/DOQI clinical practice guidelines for chronic kidney disease: evaluation, classification, and stratification. Am J Kidney Dis. 2002;39:S1–S266.
- Goertz RS, Amann K, Heide R, et al. An abdominal and thyroid status with acoustic radiation force impulse elastometry—a feasibility study: acoustic radiation force impulse elastometry of human organs. Eur J Radiol. 2011;80(3):e226–e230.
- Feehally J, Floege J, Tonelli M, et al. Comprehensive clinical nephrology. In: Inker LA, Levey AS, editors. Assessment of glomerular filtration rate. 6th ed.; 2019. p. 29–38.
- Moghazi S, Jones E, Schroepple J, et al. Correlation of renal histopathology with sonographic findings. Kidney Int. 2005;67(4):1515–1520.
- Sugiura T, Nakamori A, Wada A, et al. Evaluation of tubulointerstitial injury by Doppler ultrasonography in glomerular diseases. Clin Nephrol. 2004;61(2):119–126.
- Buturović-Ponikvar J, Visnar-Perovic A. Ultrasonography in chronic renal failure. Eur J Radiol. 2003;46(2):115–122.
- Jennette JC, Olson JL, Silva FG, et al. Heptinstall’s pathology of the kidney. 7th ed. Acute and chronic. In: Brodsky SV, editor. Tubulointerstitial nephritis; 2012. p. 848–861.